
Falco Feeds extends the power of Falco by giving open source-focused companies access to expert-written rules that are continuously updated as new threats are discovered.

In this article, you'll learn how Starlink works in a domestic environment, and how to monitor Starlink connection with Prometheus.
SpaceX's Starlink uses satellites in low-earth orbit to provide high-speed Internet services to most of the planet. During the beta, Starlink expects users to see data speeds vary from 50Mb/s to 150Mb/s and latency from 20ms to 40ms. It's also expected that there will be brief periods of no connectivity at all. Currently, there are around 1,800 Starlink satellites in orbit.

How to monitor starlink connection
There are several great projects available from the open-source community, but the one we settled on using for the basis of our project was the Starlink Prometheus Exporter from Daniel Willcocks. We encourage you to look at his other project Starlink Monitoring System if you are interested in a pre-packaged solution.
To monitor starlink connection, we decided to fork the Starlink Prometheus Exporter project and create a PR that updates the Starlink gRPC bindings using the latest Starlink firmware to provide some additional metrics from Starlink Dishy. Also, we sent a PR to the exporter maintainers
How does it work
The Starlink Dishy is contactable at 192.168.100.1 on port 9200 for gRPC. If you are using the Starlink Wi-Fi router this should be reachable by default. In this example, you'll monitor starlink connection using the Starlink Exporter to talk to Starlink Dishy via gRPC, and expose metrics in a format Prometheus will understand.
Requirements and what you will use
- Access to a Starlink Internet Service.
- Linux Node running Ubuntu 20.04 LTS.
- Docker and Docker Compose.
- Starlink Prometheus Exporter.
- Prometheus.
Configure Prometheus and Launching Containers
First, you need to configure Prometheus to scrape the Starlink Exporter. Create a prometheus folder and add the configuration file prometheus.yml as seen below:
global:
  scrape_interval:     10s # By default, scrape targets every 15 seconds.
  evaluation_interval: 10s # By default, scrape targets every 15 seconds.
  scrape_timeout:      10s # By default, it is set to the global default (10s).


  external_labels:
      monitor: 'starlink-exporter'
      origin_prometheus: 'starlink'

scrape_configs:
  - job_name: 'starlink'
    static_configs:
      - targets: ['127.0.0.1:9817']
Next, launch the Prometheus and Starlink Exporter containers using Docker Compose and the following YAML (save this as docker-compose.yml in the same location as your prometheus.yml above):
version: '3.8'

volumes:
  prometheus_data: {}

services:
  starlink-exporter:
    image: sysdigdan/starlink_exporter:v0.1.3
    container_name: starlink_exporter
    restart: unless-stopped
    network_mode: host

  prometheus:
    image: prom/prometheus:v2.32.1
    container_name: prometheus
    restart: unless-stopped
    volumes:
      - ./prometheus.yml:/etc/prometheus/prometheus.yml
      - prometheus_data:/prometheus
    command:
      - '--config.file=/etc/prometheus/prometheus.yml'
      - '--storage.tsdb.path=/prometheus'
    network_mode: host
Now, from the same directory as your docker-compose.yml and prometheus.yml, you can launch the containers with the following command:
docker-compose up -d
Let's make sure everything is running:
docker ps

Monitor starlink connection with Prometheus dashboards
Now that both containers are running, you can access Prometheus (http://<NODE IP>:9090/) and look at the available metrics coming from Starlink Dishy (http://<NODE IP>:9817/metrics).
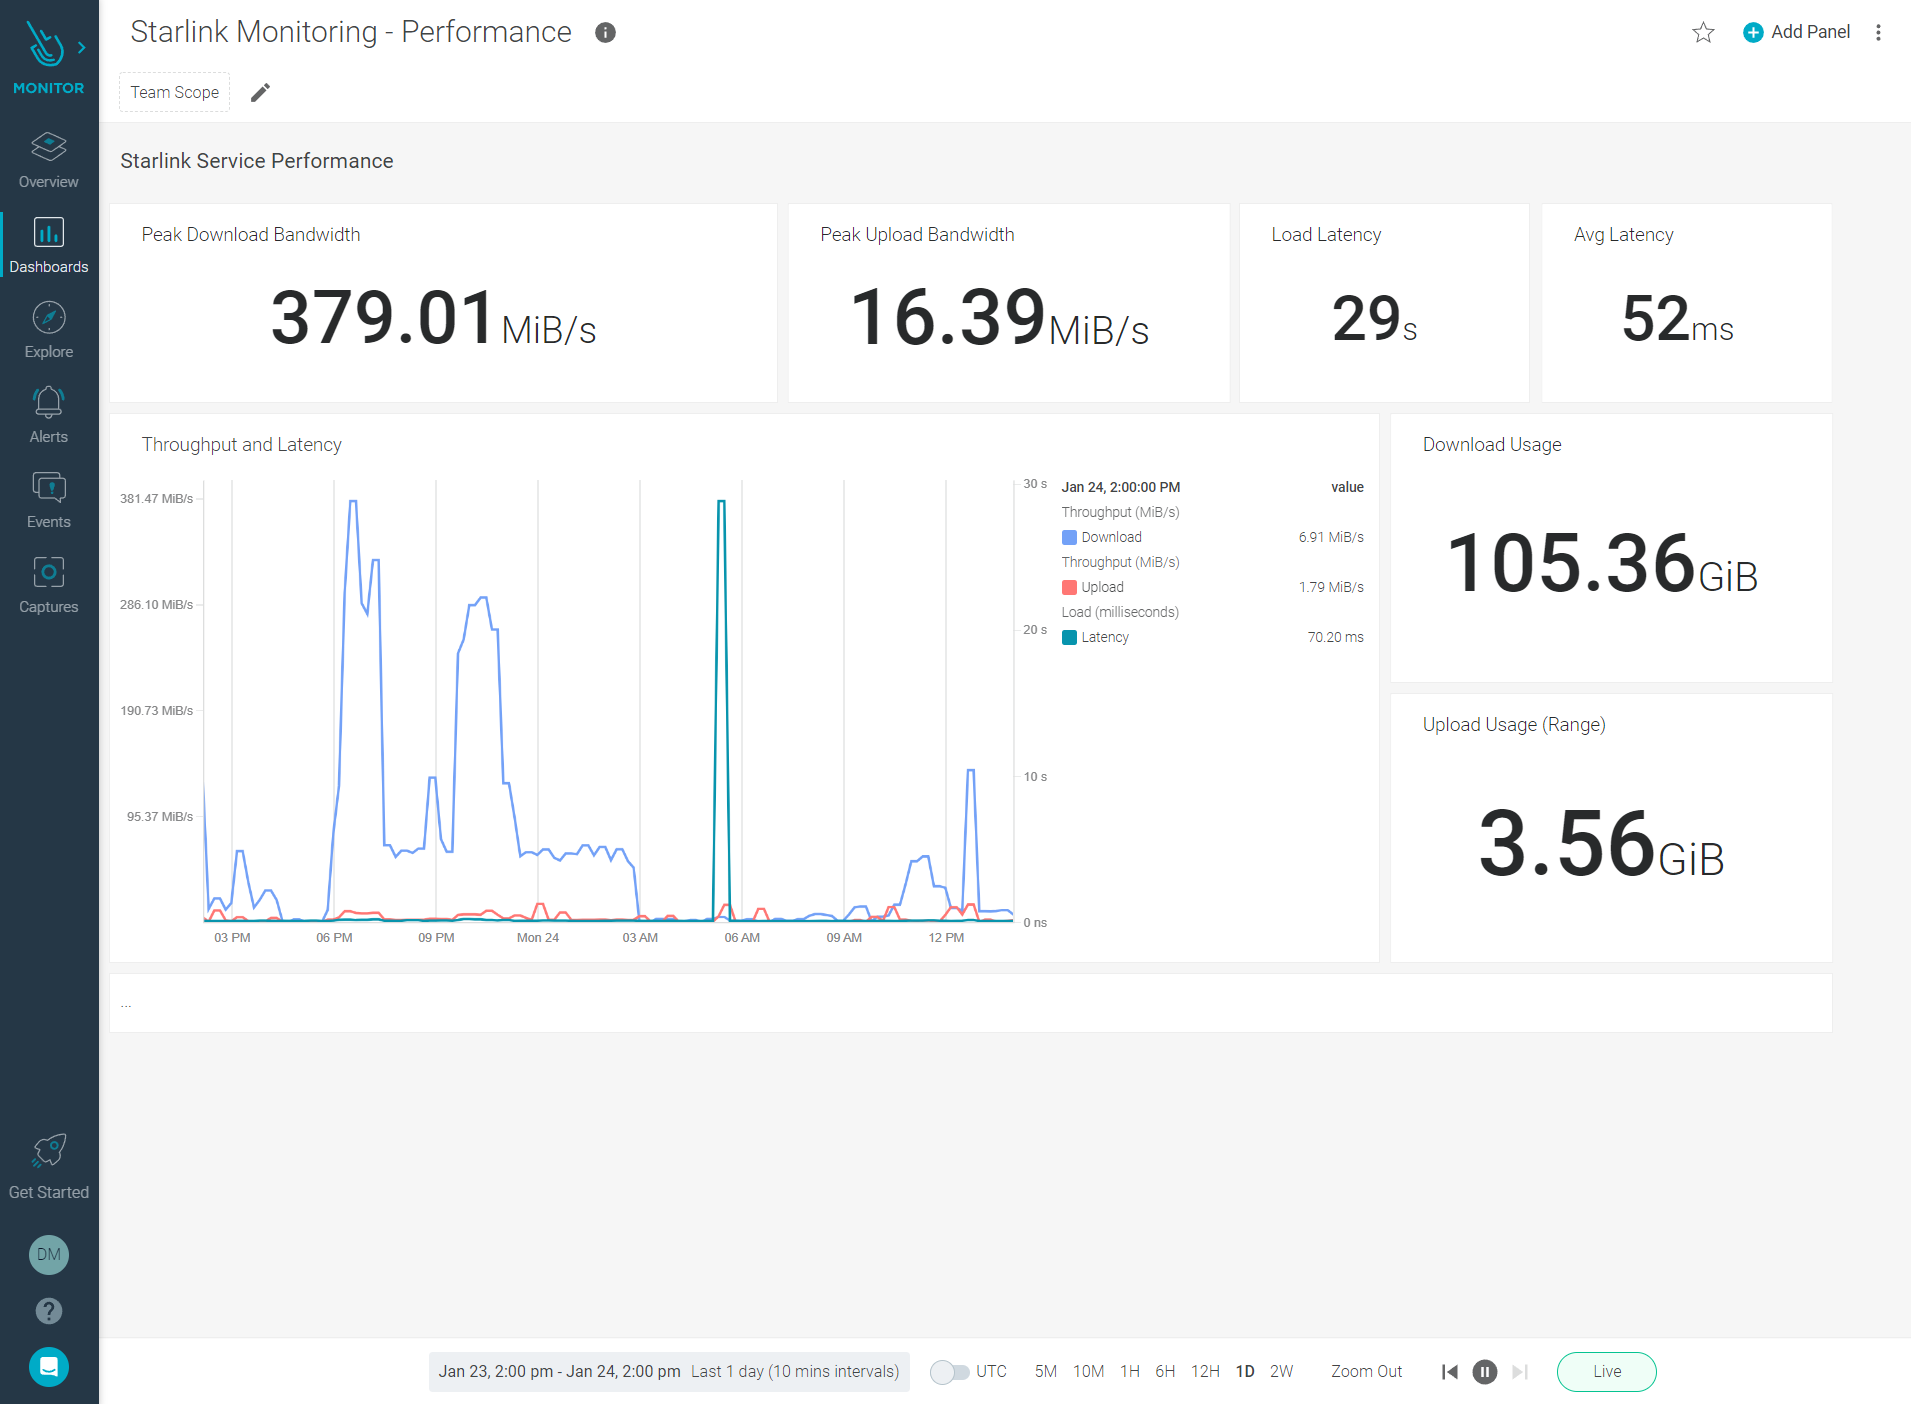
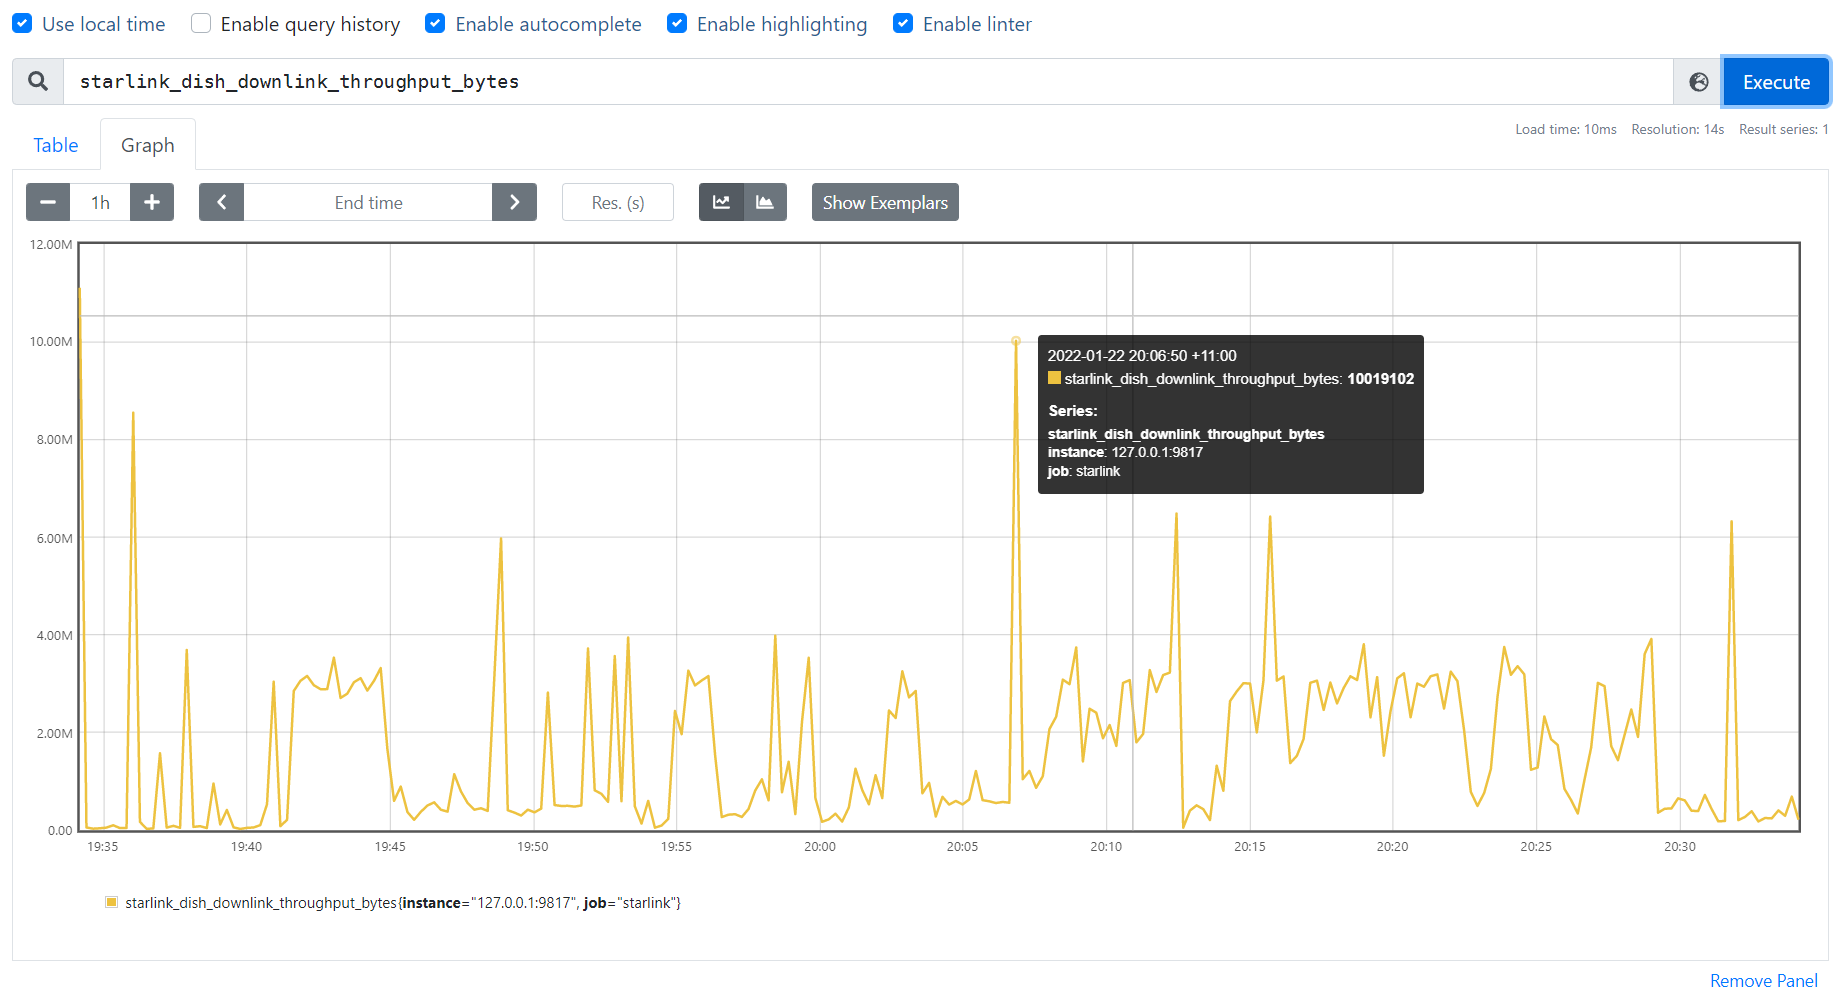
Monitor starlink connection: Performance Metrics
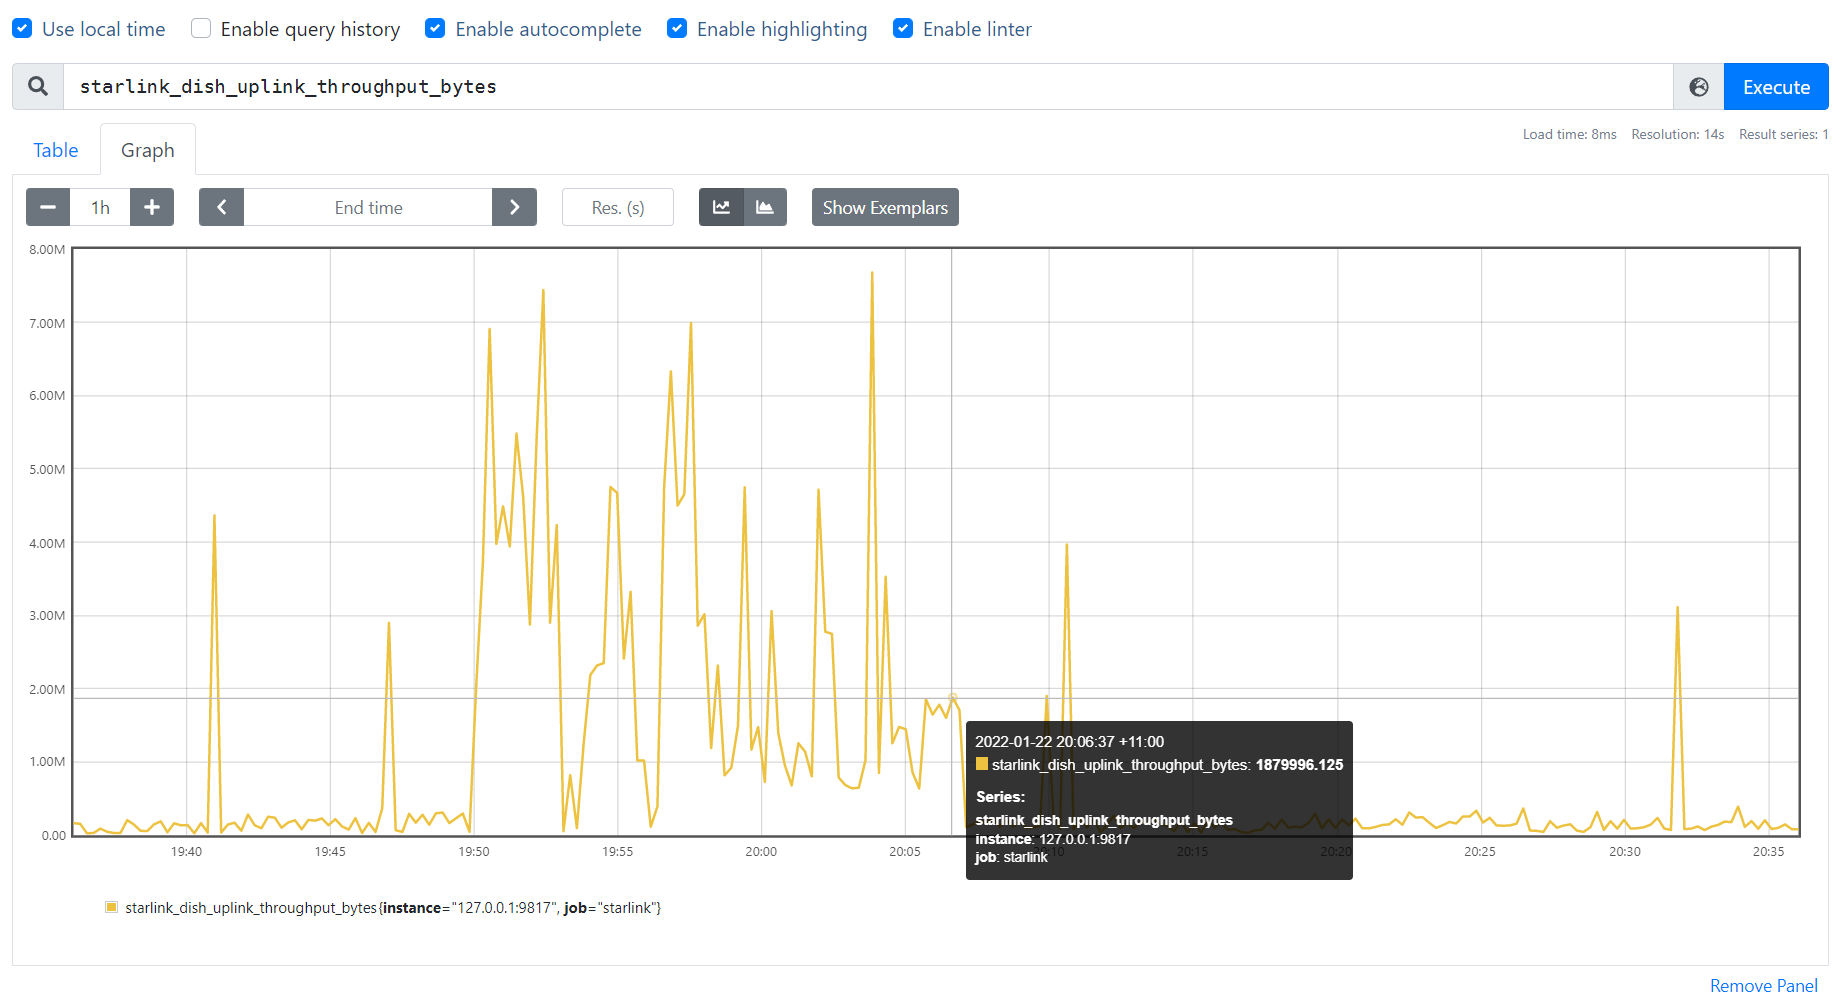
You can review metrics for throughput utilization by using the following: starlink_dish_downlink_throughput_bytes and starlink_dish_uplink_throughput_bytes.
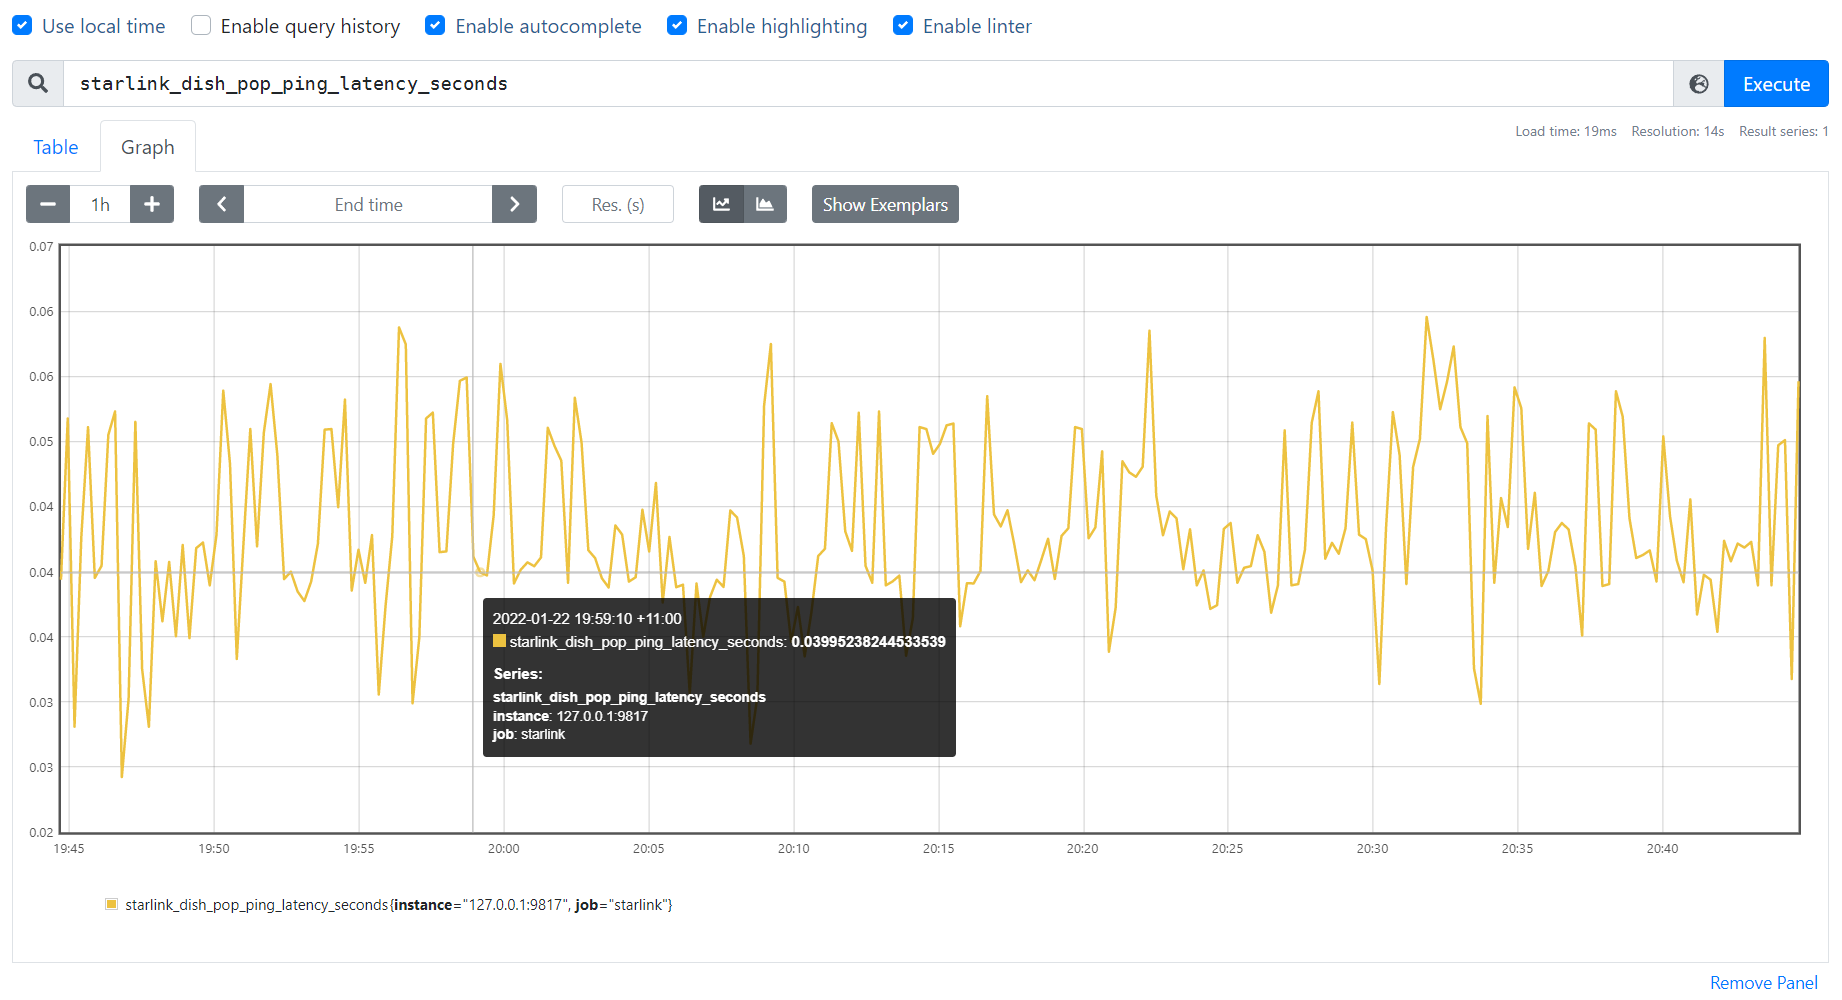
You can also quickly see the latency between Starlink Dishy, Satellite, and Ground Station by using starlink_dish_pop_ping_latency_seconds.
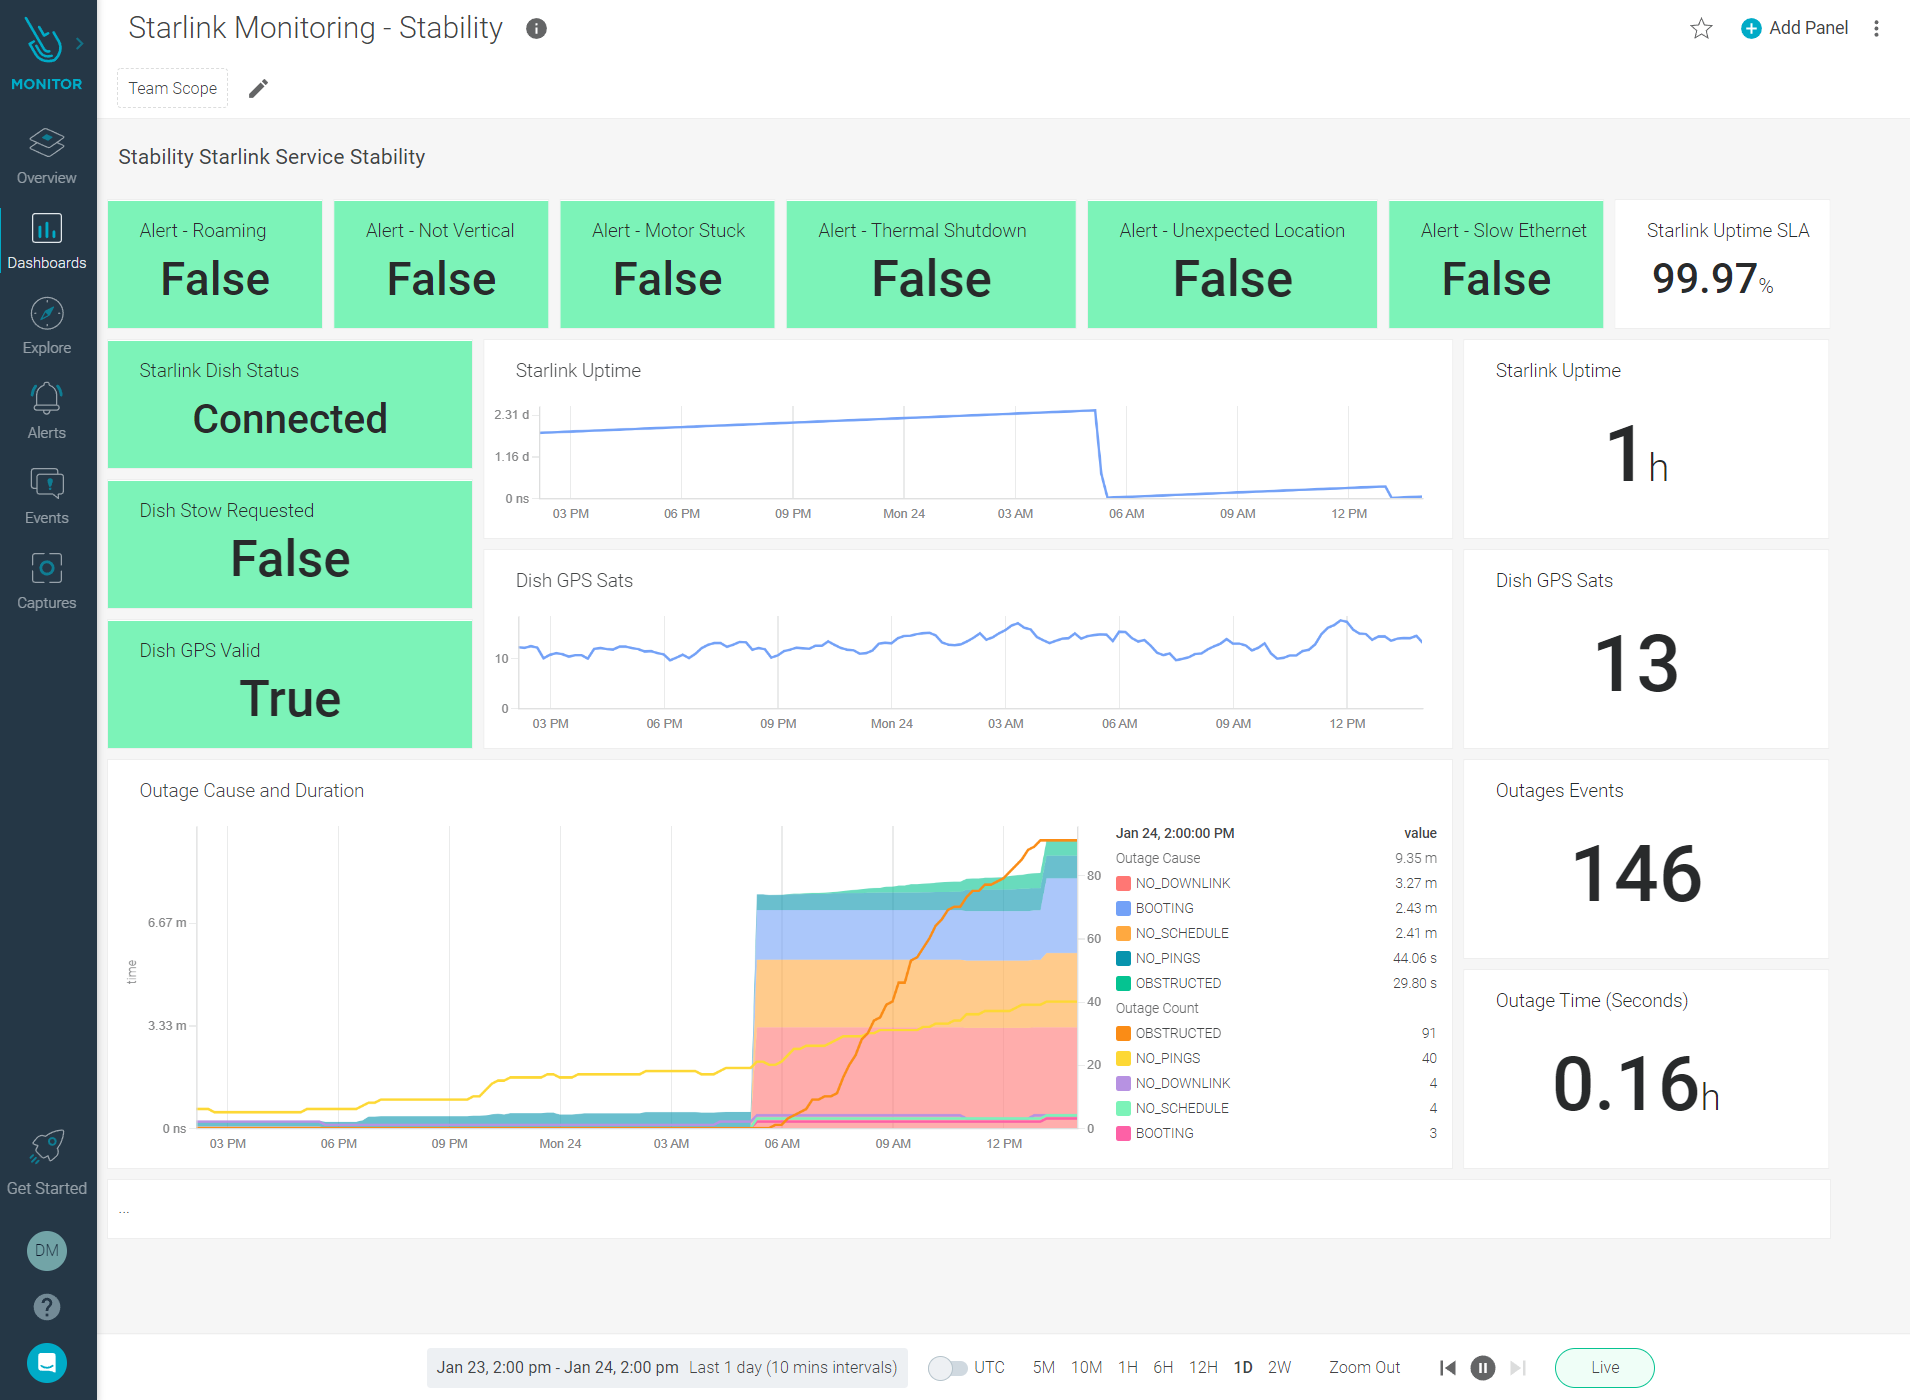
Monitor starlink connection: Stability Metrics
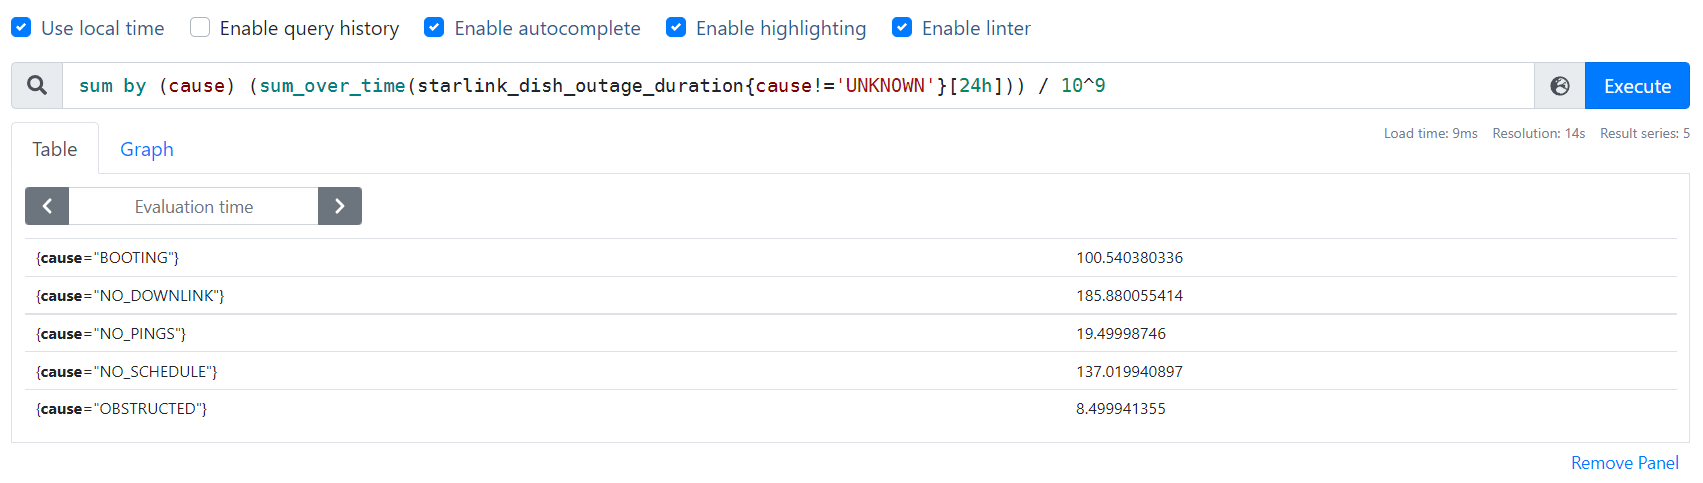
Use this PromQL query if you are interested in understanding the cause of outages; you can use the following PromQL to review all outages over the past 24 hours:
sum by (cause) (sum_over_time(starlink_dish_outage_duration{cause!='UNKNOWN'}[24h])) / 10^9
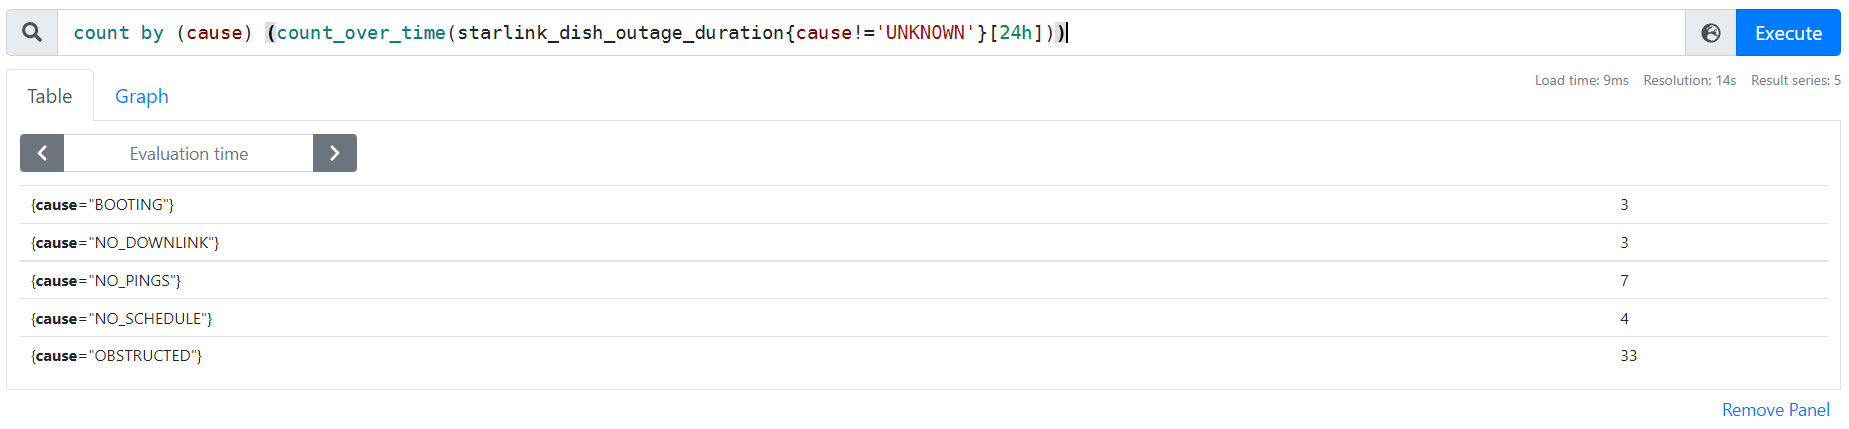
You can also count the occurrences.
count by (cause) (count_over_time(starlink_dish_outage_duration{cause!='UNKNOWN'}[24h]))
Want to dig deeper into PromQL? Read our getting started with PromQL guide to learn how Prometheus stores data, and how to use PromQL functions and operators.
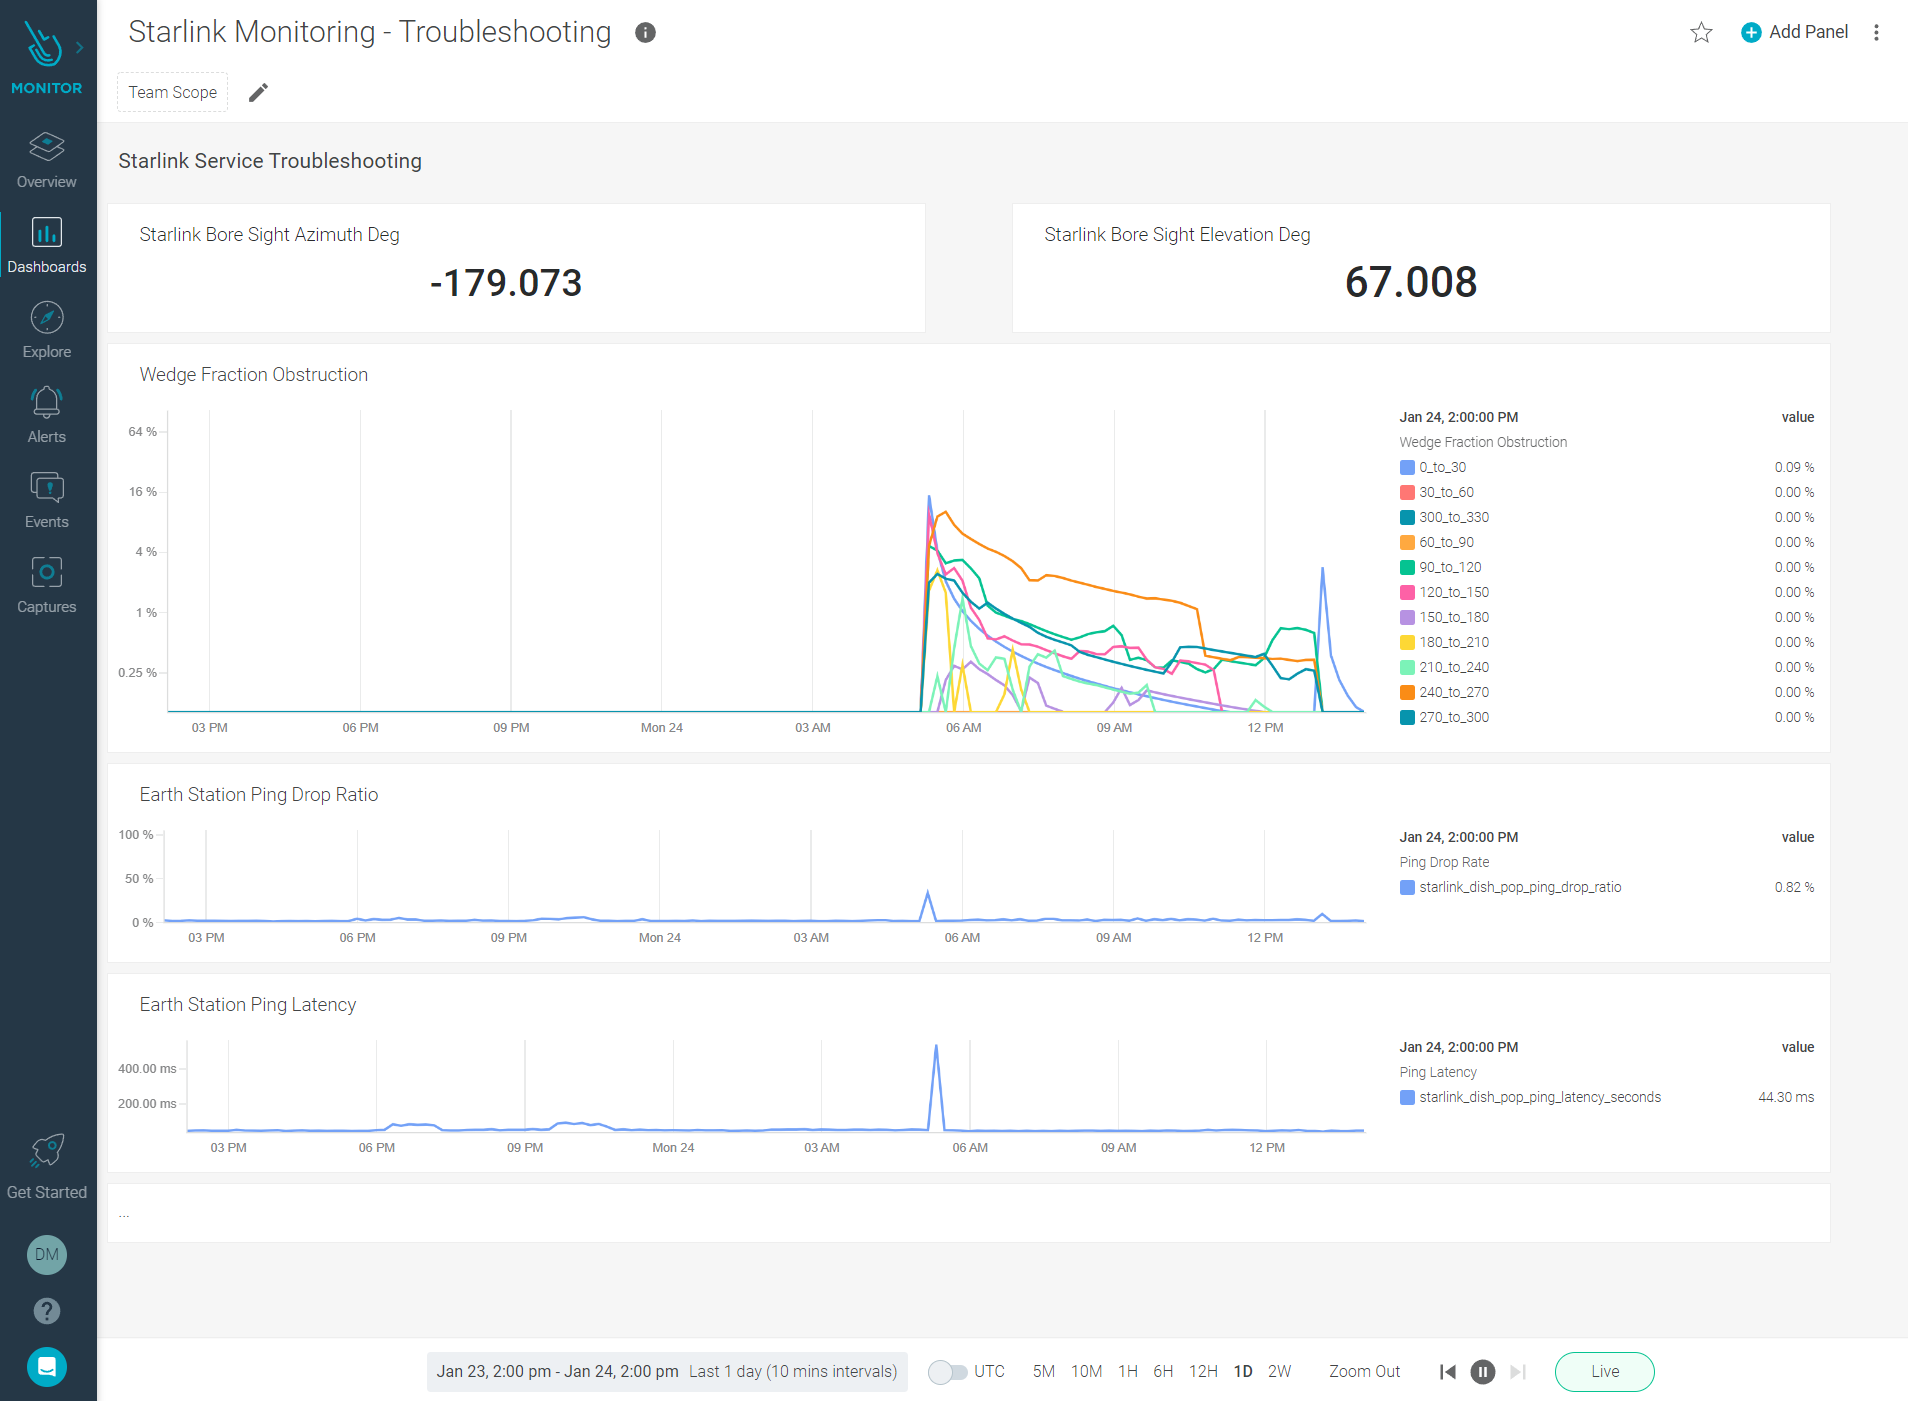
Monitor starlink connection: Troubleshooting Metrics
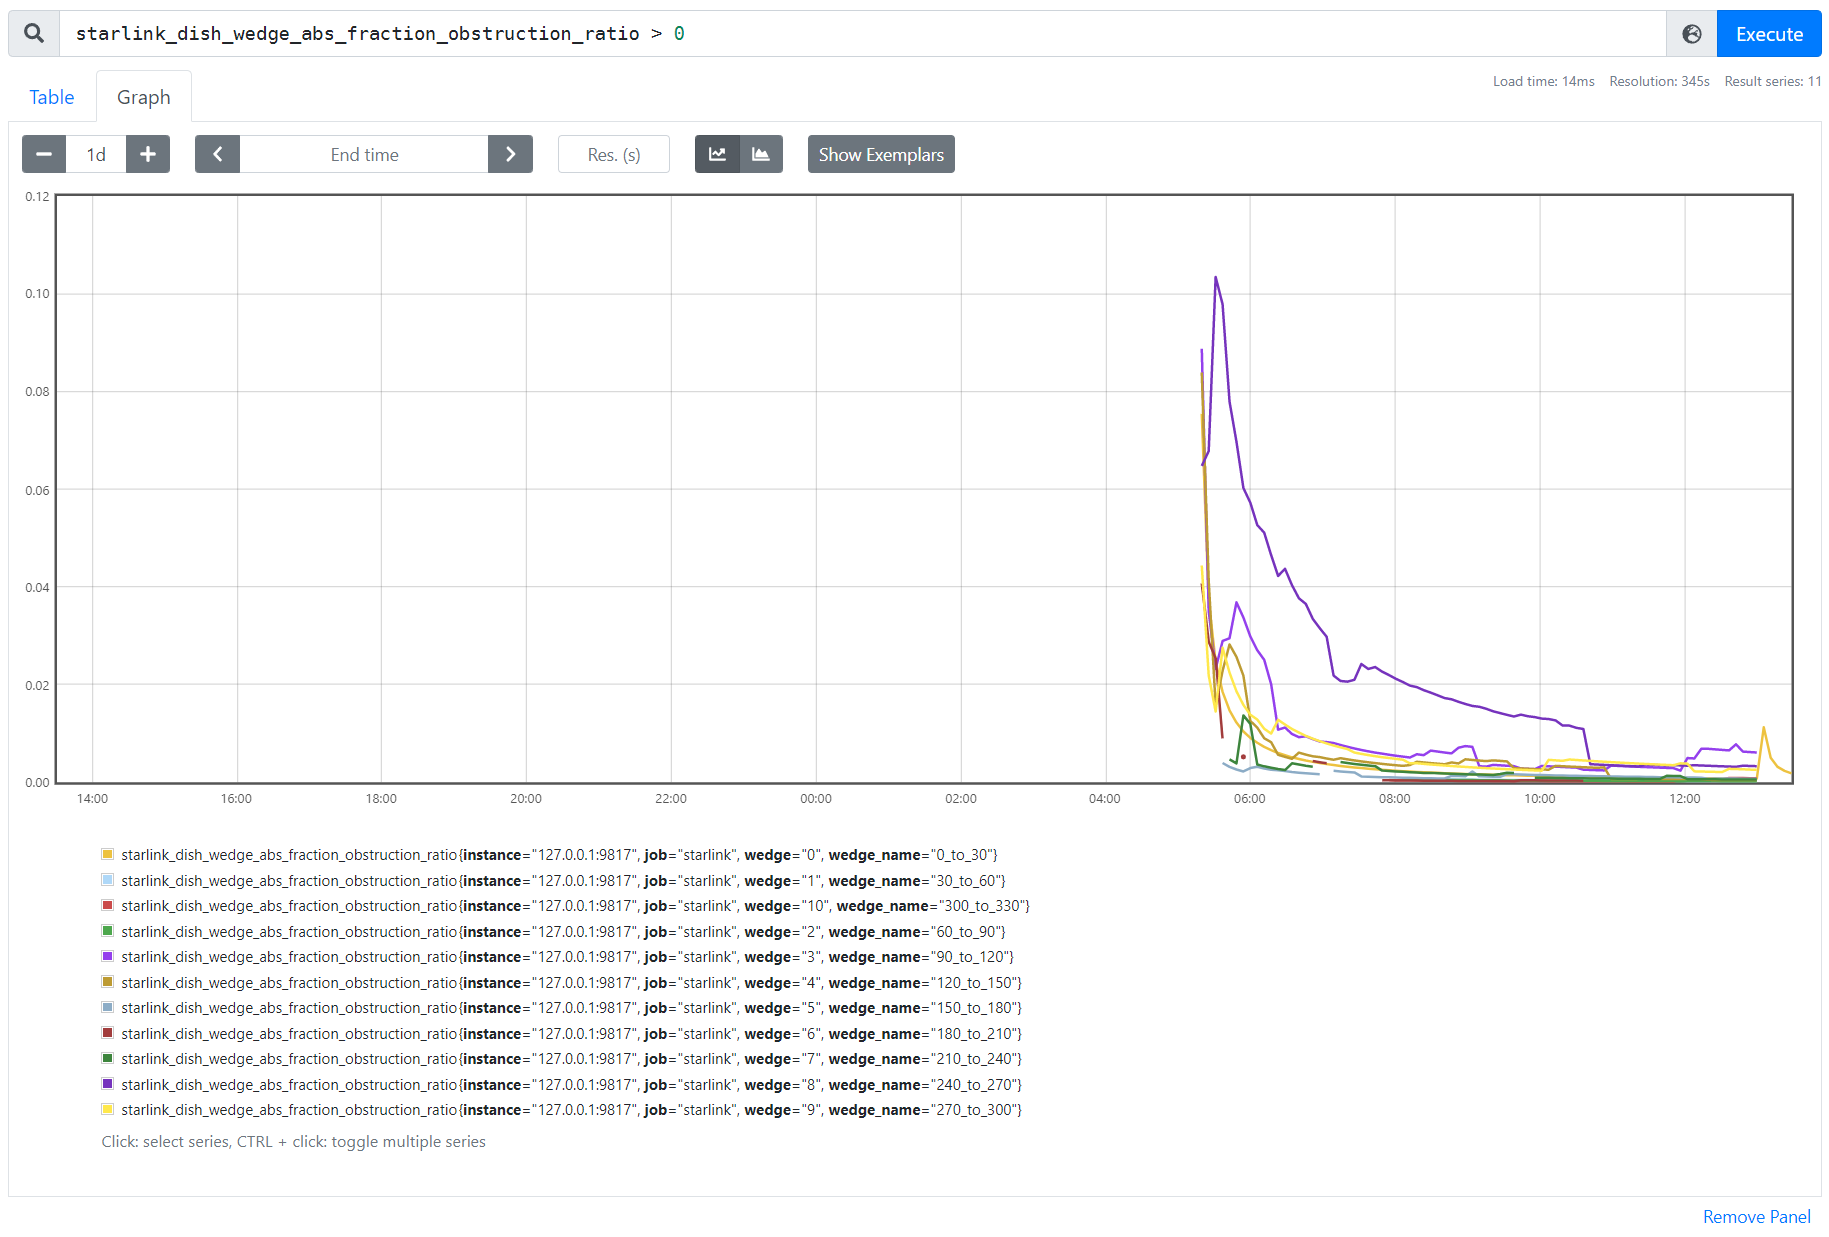
You want to understand satellite obstruction with the following PromQL that shows a measure of obstruction in 12 30-degree wedges around Dishy.
starlink_dish_wedge_abs_fraction_obstruction_ratio > 0
Monitor starlink connection with Sysdig Monitor LTS
With Prometheus and the Starlink Exporter all set up, we need to think of how best to provide longer retention for comparison over time. By default, Prometheus provides 15 days retention. This can be adjusted but the downside is we would then need to manage storage and backups.
One of the features that customers of Sysdig Monitor are taking full advantage of is Prometheus Remote Write, which allows us to natively ingest metrics from many Prometheus servers. There's also no need to manage storage, and with long retention and always on metrics, it's a simple choice!
The configuration for Prometheus Remote Write is simple. You just need to append the prometheus.yml file we created earlier with a new remote_write section, similar to the following.
remote_write:
- url: "https:///prometheus/remote/write"
bearer_token: ""
tls_config:
insecure_skip_verify: true
Restart the Prometheus container and you're done!