
Monitoring Amazon RDS may require some observability strategy changes if you switched from a classic on-prem MySQL/PostgreSQL solution.
Amazon RDS is a great solution that helps you focus on the data, and forget about bare metal, patches, backups, etc. However, since you don’t have direct access to the machine, you’ll need to adapt your monitoring platform.
In this article, we are going to describe the differences between an on-prem database solution and Amazon RDS, as well as how you can start monitoring Amazon RDS. Also, we will identify the top five key metrics for monitoring Amazon RDS. Maybe even more!
How Amazon RDS is different from other on-prem database solutions
Since Amazon RDS is a managed cloud service, the way you configure and use it is through the AWS Console or AWS API. You won’t have a terminal to access the machine directly, so every operation, like replication, backups, or disk management, has to be made this way.
You won’t have to worry about the infrastructure matters such as replication, scaling, or backups. But you won’t have direct access to the instance either. That being so, you won’t be able to monitor Amazon RDS using a classic node-exporter strategy.
Monitoring Amazon RDS
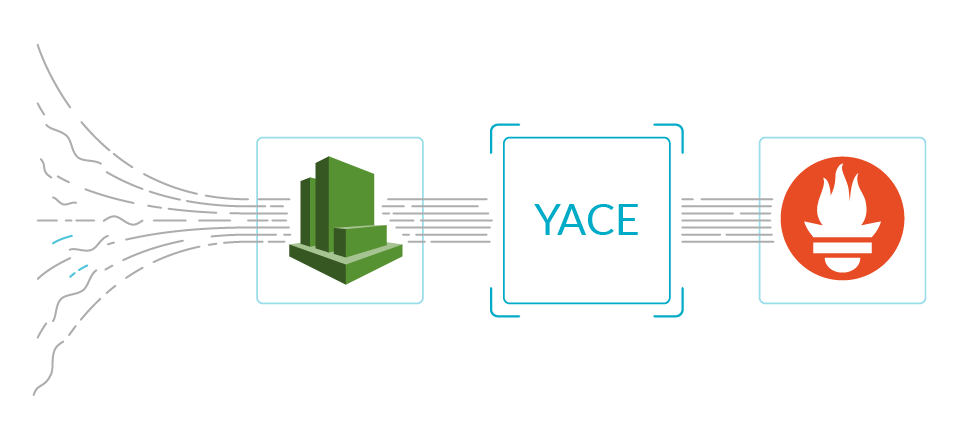
Monitoring AWS is pretty straightforward, using YACE to get data from AWS CloudWatch and store it in Prometheus.
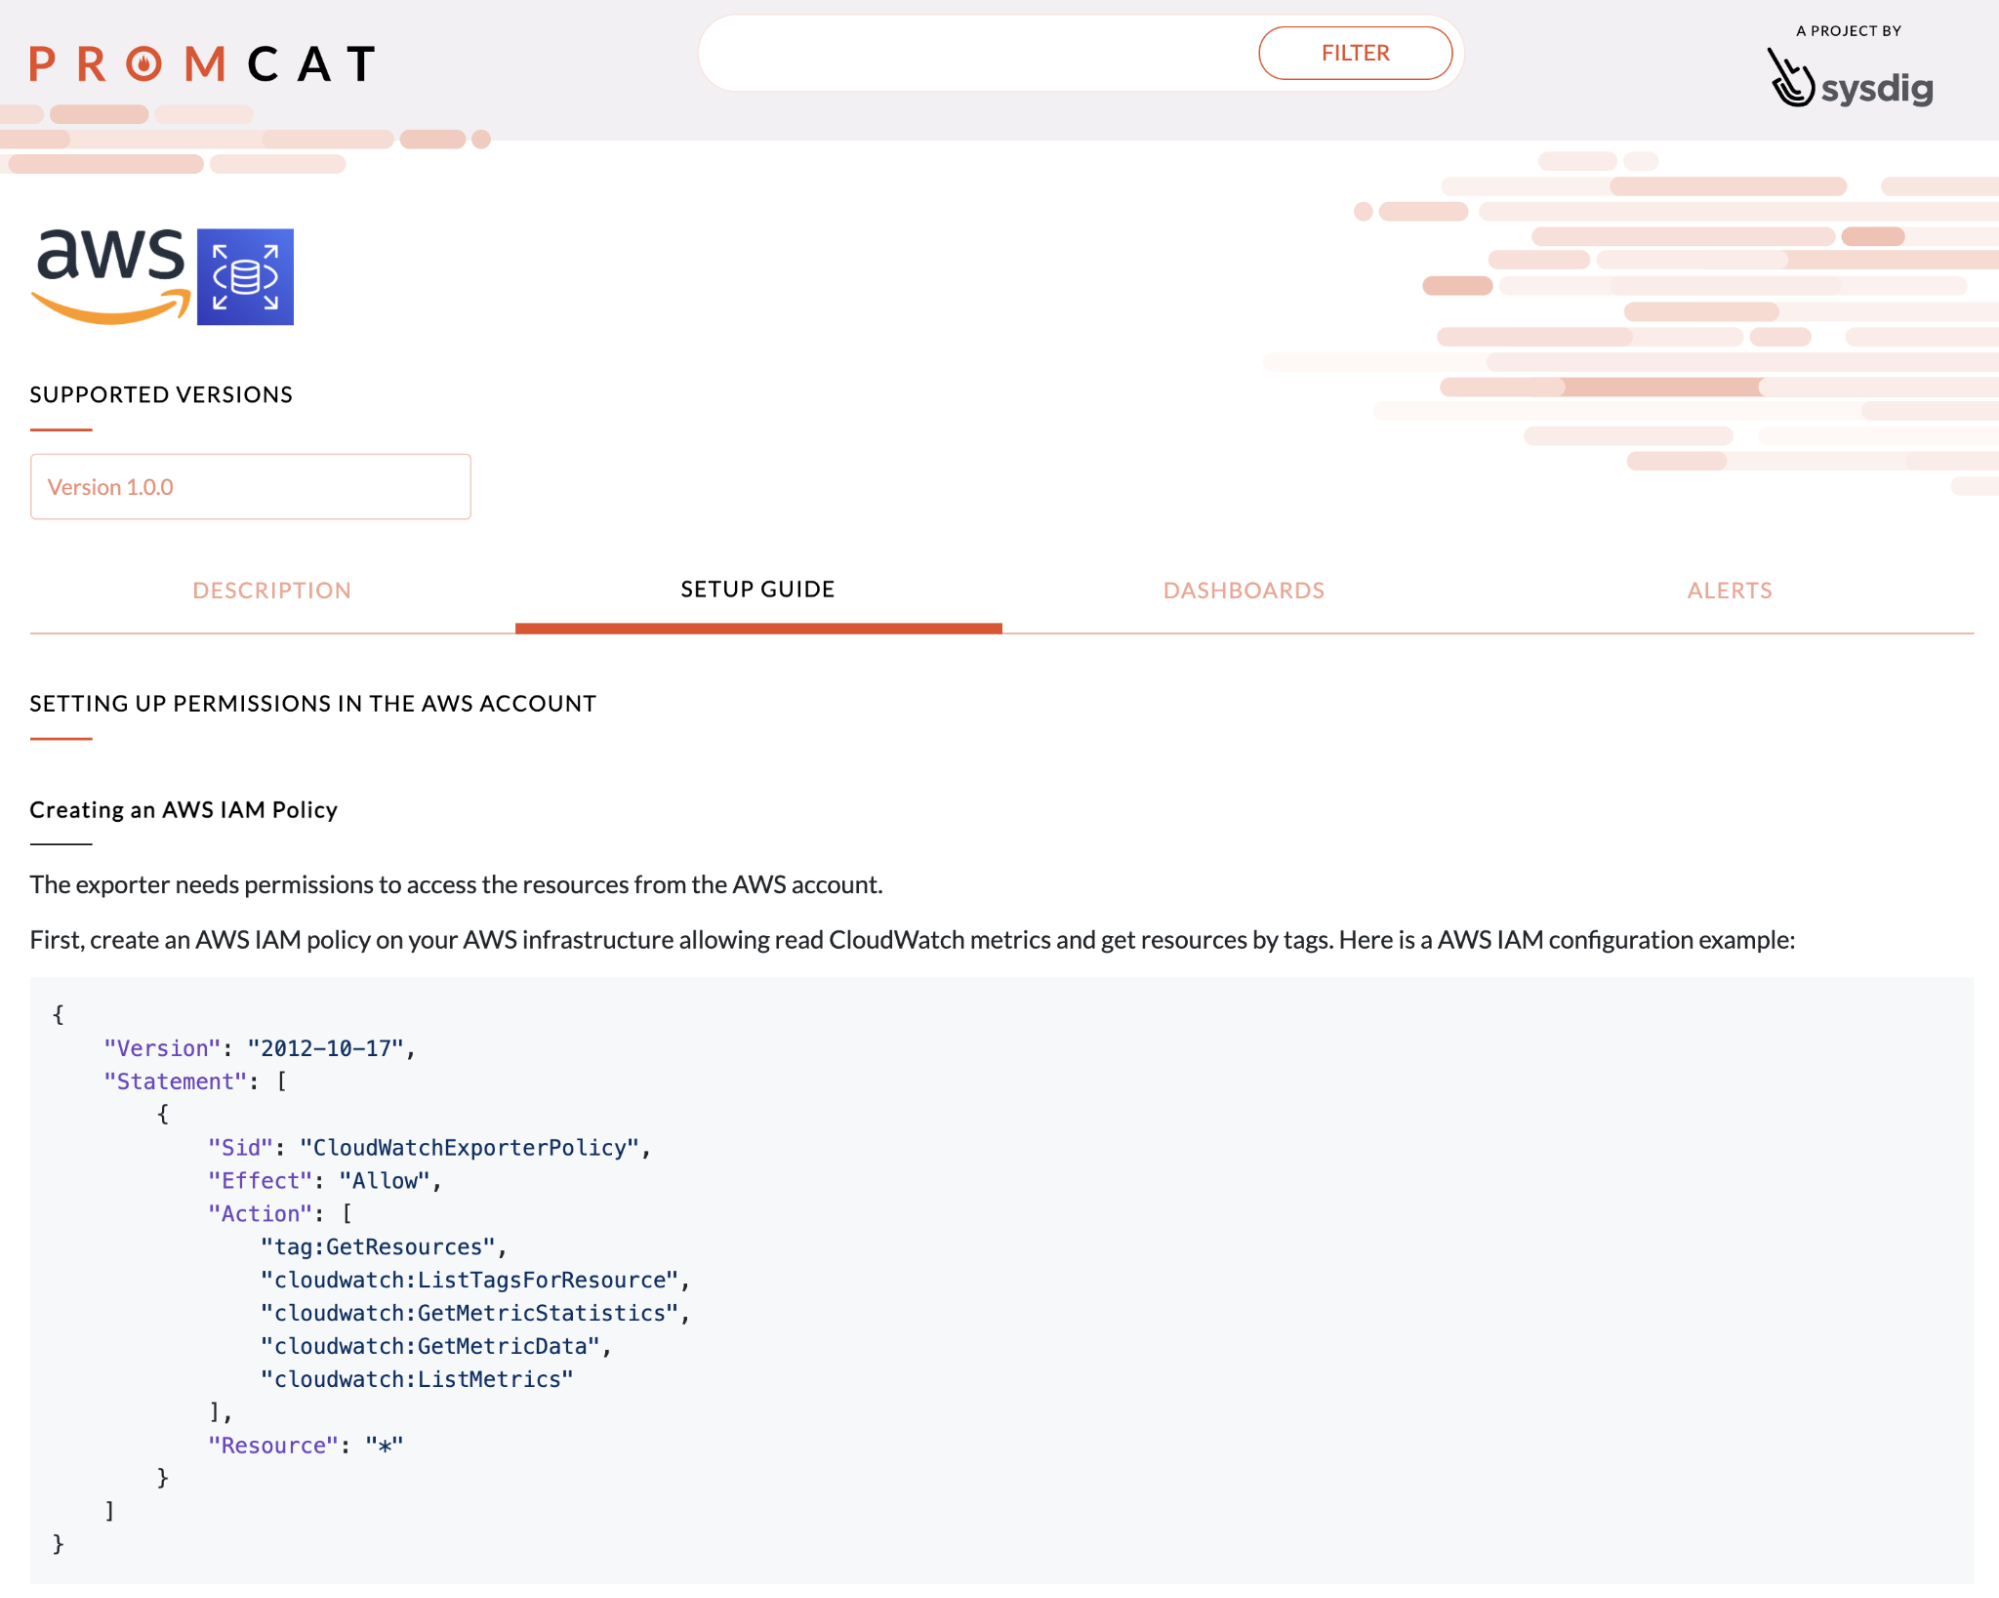
Using PromCat to include Amazon RDS in this setup will take you a couple of clicks. Just configure the credentials and apply the deployment in your cluster. Every step in the configuration is very well explained in the Amazon RDS PromCat setup guide.
Top 5 metrics you should look at
Memory
Why it matters
Memory is constantly used in databases to cache the queries, tables, and results in order to minimize disk operations. This is directly related to how your database will perform. Not having enough memory will cause a low hit rate in the cache and an increase in the response time in your database. This is not good news!
Also, every time a client connects to your database, it creates a new process that will use some memory. In situations with massive concurrent connections, like Black Friday, running out of memory can result in multiple rejected connections.
How to monitor and alert
Using the aws_rds_freeable_memory_average metric (which YACE reads from the CloudWatch FreeableMemory metric). This tells you the memory available (in bytes) for your instance.
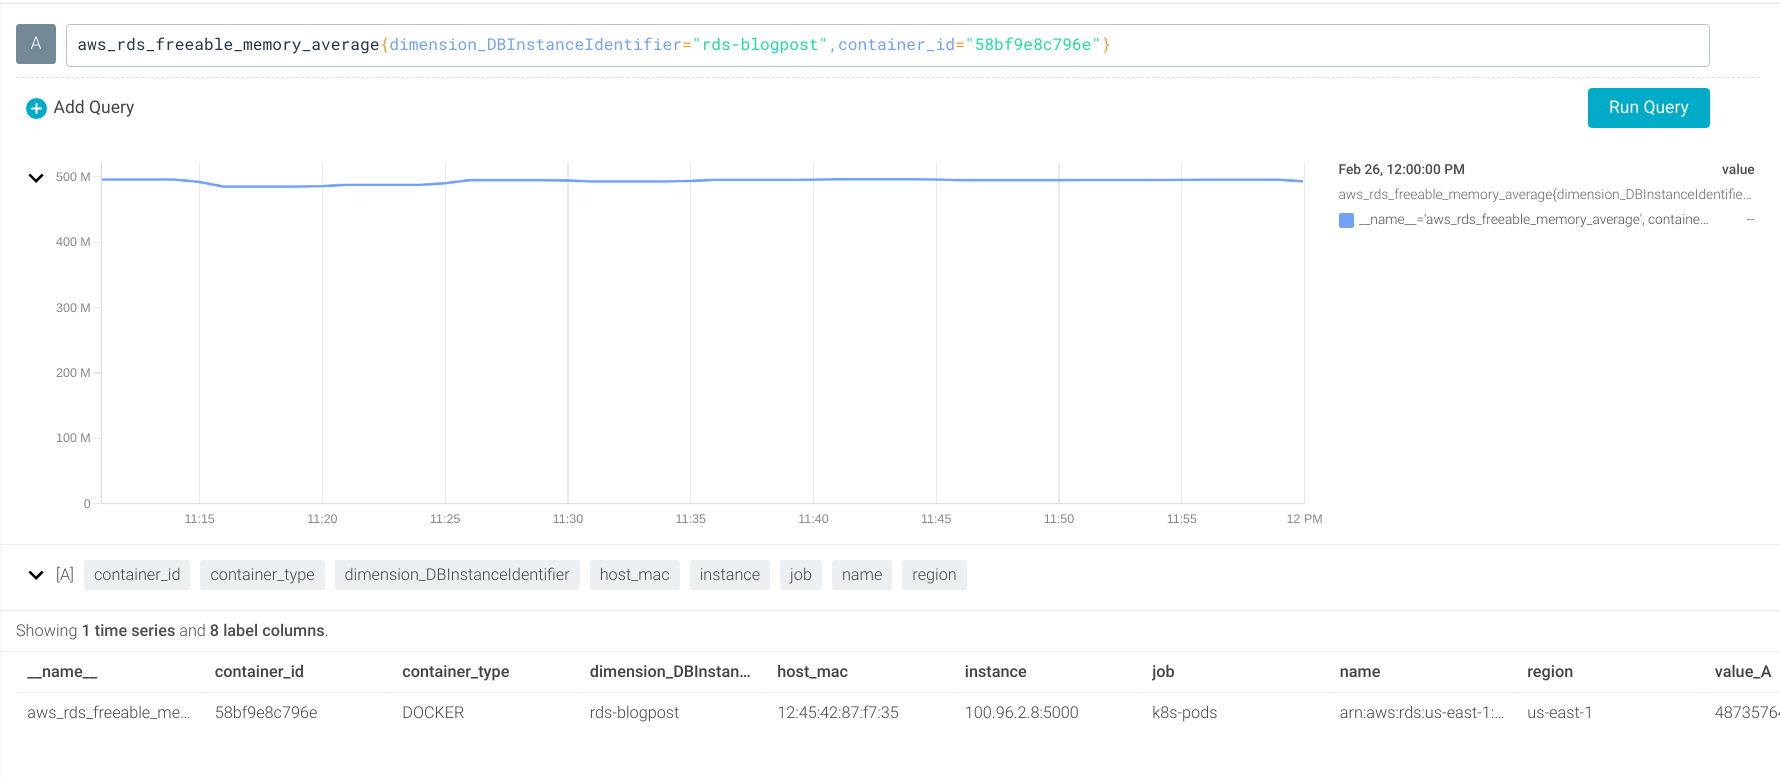
Let’s create an alert if the available memory is under 128Mb:
aws_rds_freeable_memory_average < 128*1024*1024
DB Connections
Why it matters
Even if there’s enough available memory, there is a max number of DB connections in every instance. If you reach this number, the following connections will be rejected, causing database errors in your application.
How to monitor and alert
Using the aws_rds_database_connections_average metric (which uses the DatabaseConnections CloudWatch metric).
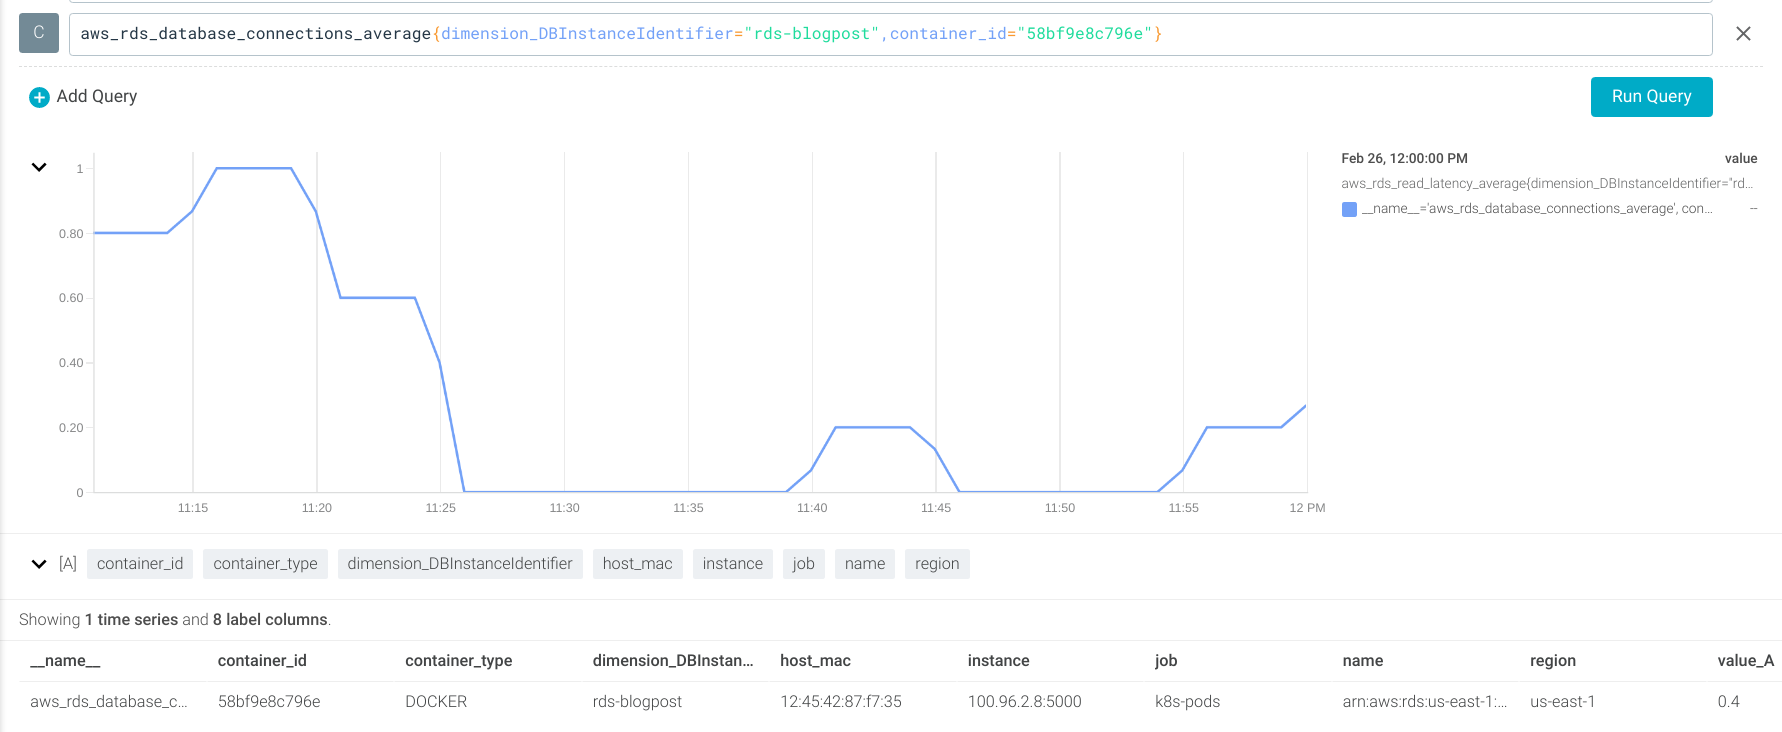
Let’s create an alert if the DB connections number is greater than 1000. Unfortunately, CloudWatch does not provide the maximum number of DB Connections, so you’ll need to specify it manually in the PromQL query.
aws_rds_database_connections_average > 1000
You can also create an alert in case the number of connections has increased significantly in the last hour. That can be used to detect attempts of brute force or DDoS attacks. In this example, you’ll be notified if the number of connections has increased 10 times in the last hour.
aws_rds_database_connections_average / aws_rds_database_connections_average offset 1h > 10
CPU
Why it matters
Databases use CPU to run queries. If there are multiple, concurrent, complex, or not well-optimized queries, the CPU usage can reach the limit of the running instance. This will result in a very high response time and possibly some time-outs.
How to monitor and alert
Using the aws_rds_cpuutilization_average metric (which uses the CloudWatch CPUUtilization metric).
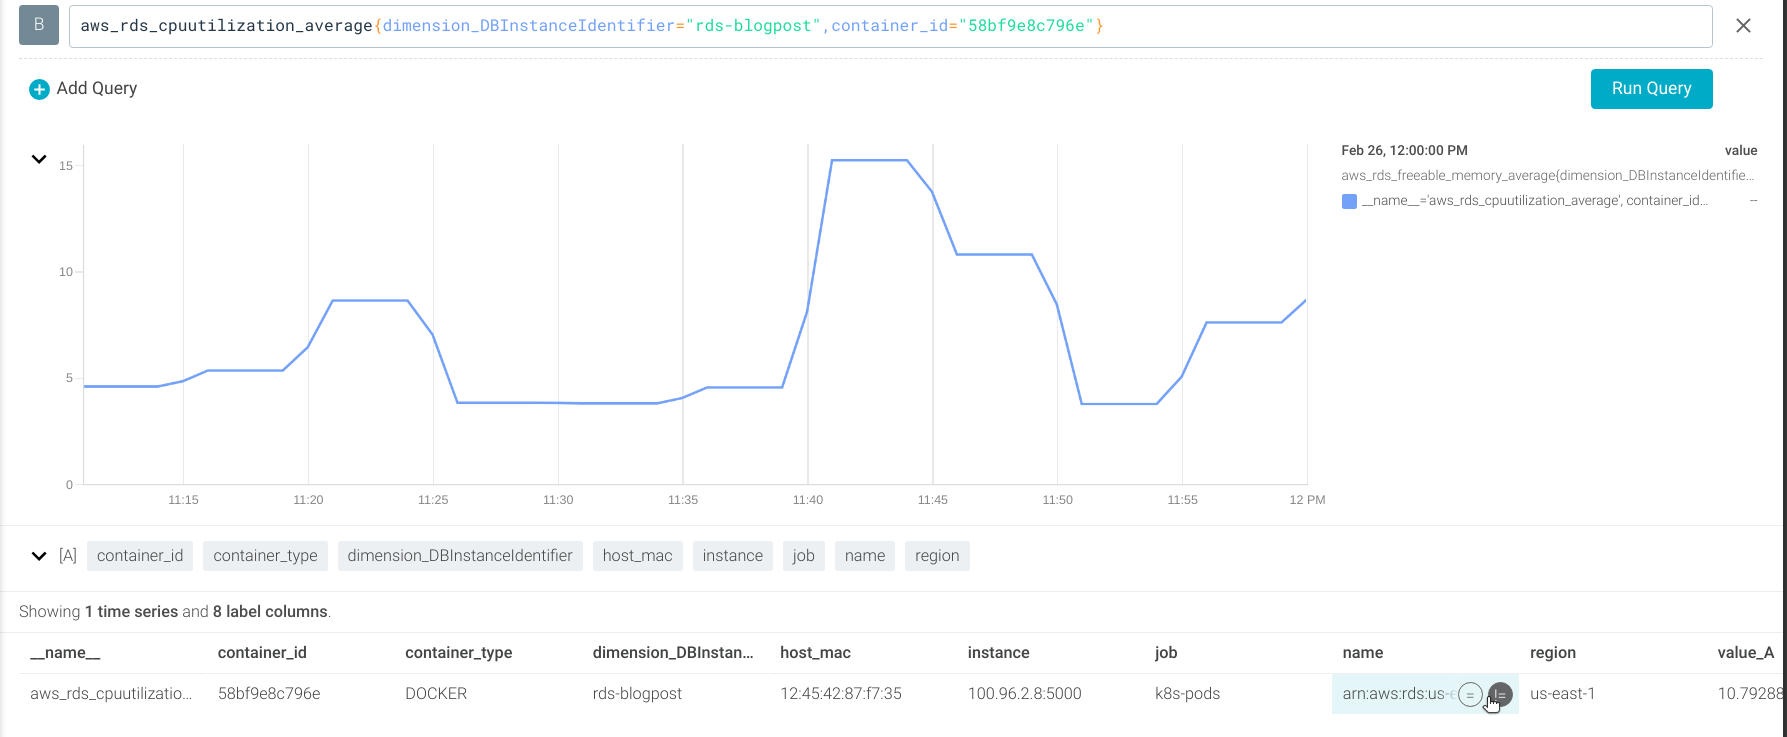
Let’s create an alert if the average CPU usage is higher than 95% of the instance.
aws_rds_cpuutilization_average > 0.95
Storage
Why it matters
Storage is one of the most important parts of a database since it’s where data is held. Not having enough storage capacity will crush your database.
Although setting up an auto-scaling strategy in Amazon RDS is very easy, it could affect your infrastructure costs. That’s why you should be aware of the instance disk state.
How to monitor and alert
Using the aws_rds_free_storage_space_average metric (which uses the FreeStorageSpace CloudWatch metric).
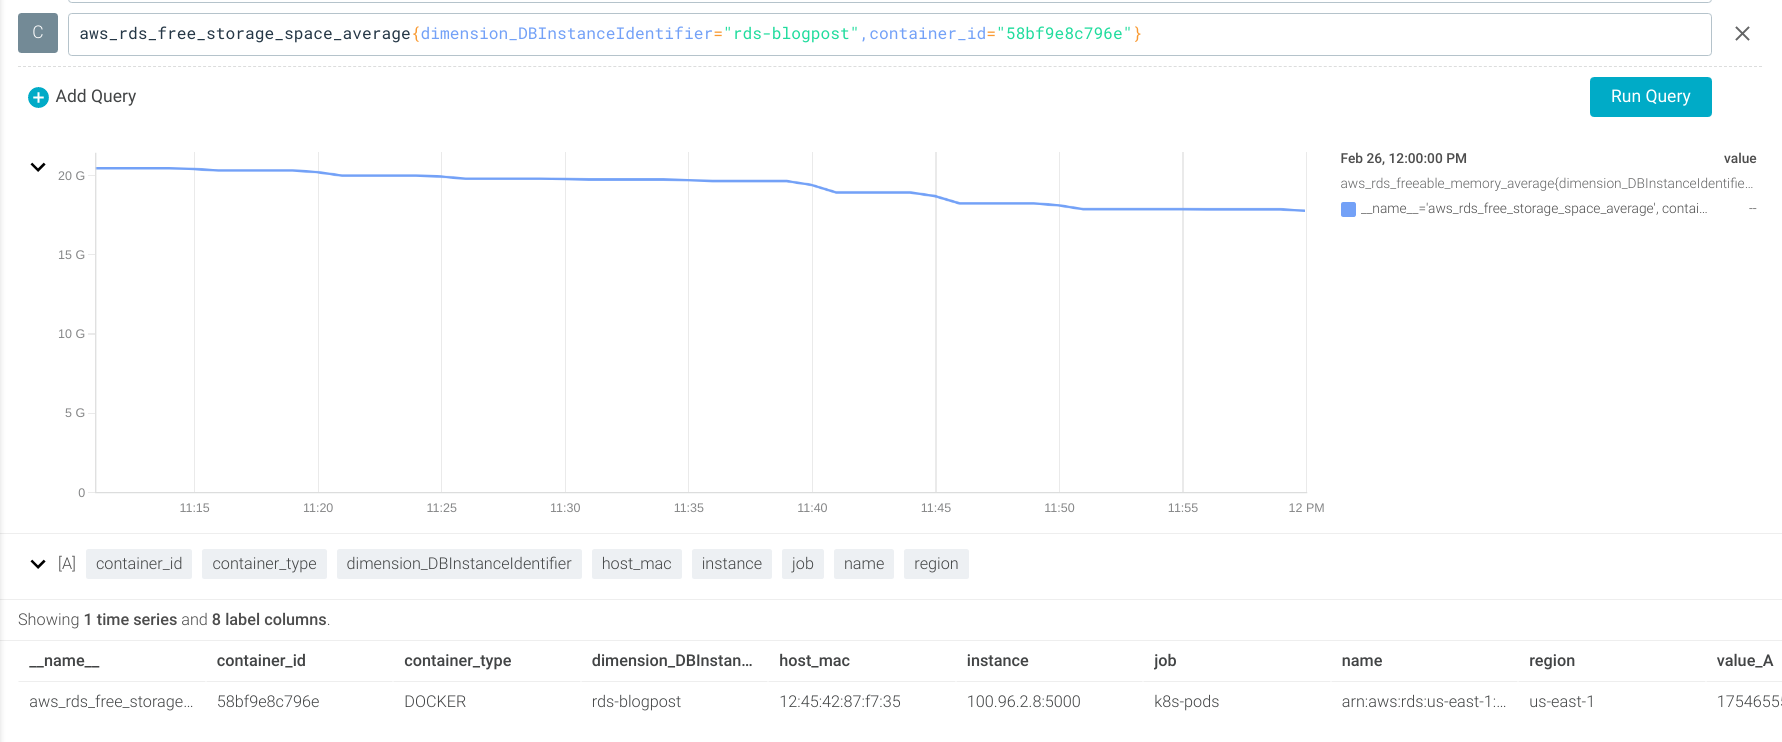
Let’s create an alert if the available storage is lower than 512Mb.
aws_rds_free_storage_space_average < 512*1024*1024
Apart from this PromQL query, you can go further by traveling to the future. How? Using the predict_linear PromQL function to predict when you are going to run out of storage. You may remember this from when we used it to cook a ham.
This PromQL query will alert you if you’re going to run out of storage in the next 48 hours.
predict_linear(aws_rds_free_storage_space_average[48h], 48 * 3600) < 0
If you want to dig deeper into PromQL functions, you can check our getting started PromQL CheatSheet.
Read/Write Latency
Why it matters
In situations where there are queries returning a massive amount of data, the database will need to perform disk operations.
Database disks normally have a low read/write latency, but they can have issues that can result in high latency operations. Monitoring this will assure you the disk latency is as low as expected.
How to monitor and alert
Using the aws_rds_read_latency_average and aws_rds_write_latency_average metrics (which use the ReadLatency and WriteLatency CloudWatch metrics).
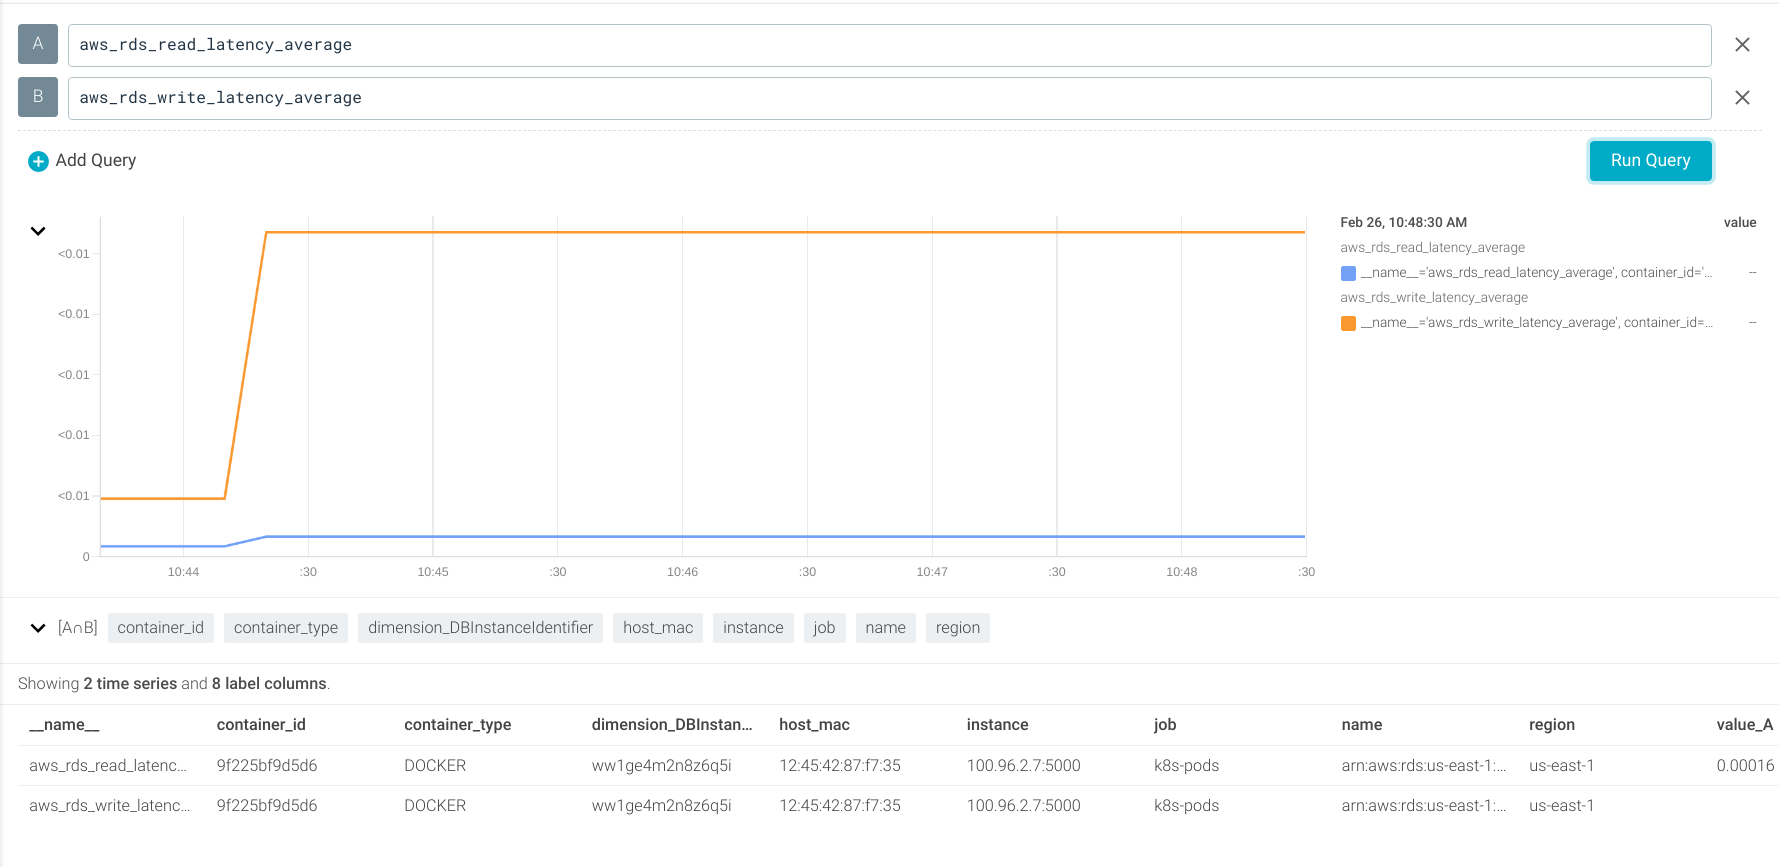
Let’s create alerts to notify when the read or write latency is over 250ms.
aws_rds_read_latency_average > 0.250
aws_rds_write_latency_average > 0.250
Just 5? Let’s dig deeper with some bonus metrics!
Network I/O
Why it matters
It doesn’t matter if the database is working correctly if there’s no connection from the outside. A misconfiguration or a malicious act from an attacker can result in losing connection to the instance.
Learn how an attacker can infiltrate your cloud infrastructure and perform lateral movement. Also, learn how to prevent and detect such attacks.
How to monitor and alert
Using the aws_rds_network_receive_throughput_average and aws_rds_network_transmit_throughput_average metrics (which use the NetworkReceiveThroughput and NetworkTransmitThroughput CloudWatch metrics).
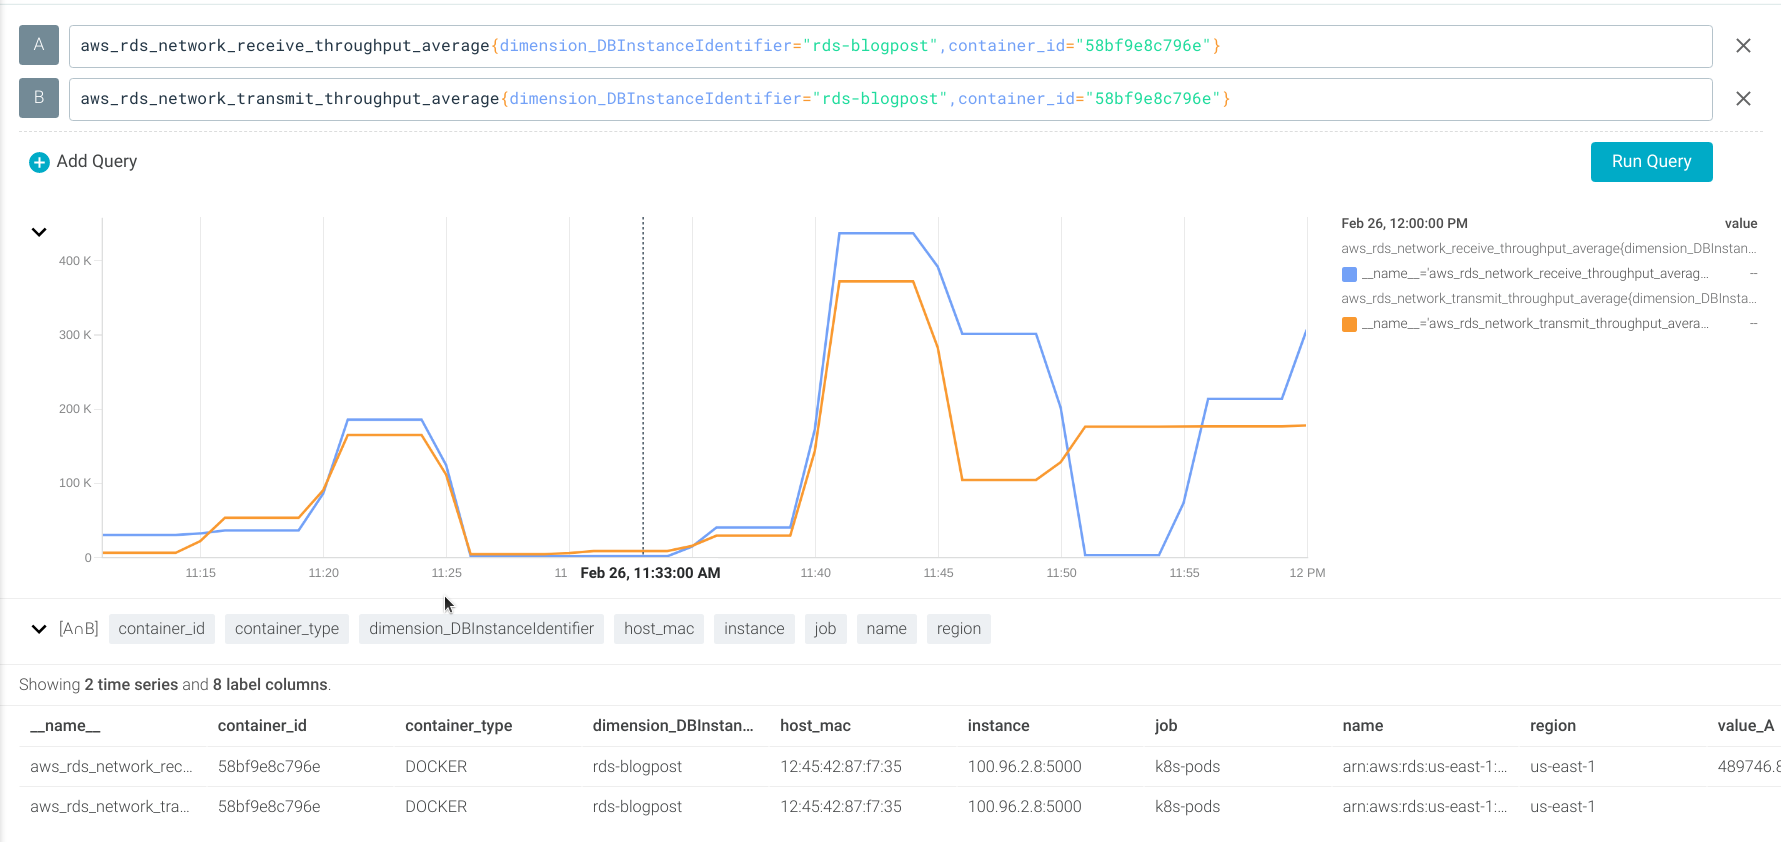
Let’s create an alert if the network traffic is down.
aws_rds_network_receive_throughput_average = 0 AND aws_rds_network_transmit_throughput_average = 0
Read / Write IOPS
Why it matters
The number of operations per second (IOPS) available in the instance, can be configured and is billed separately.
Not having enough can affect the performance of your application, and having more than needed will have a negative impact on your infrastructure costs.
How to monitor and alert
Using the aws_rds_read_iops_average and aws_rds_write_iops_average metrics (which use the ReadIOPS and WriteIOPS CloudWatch metrics).
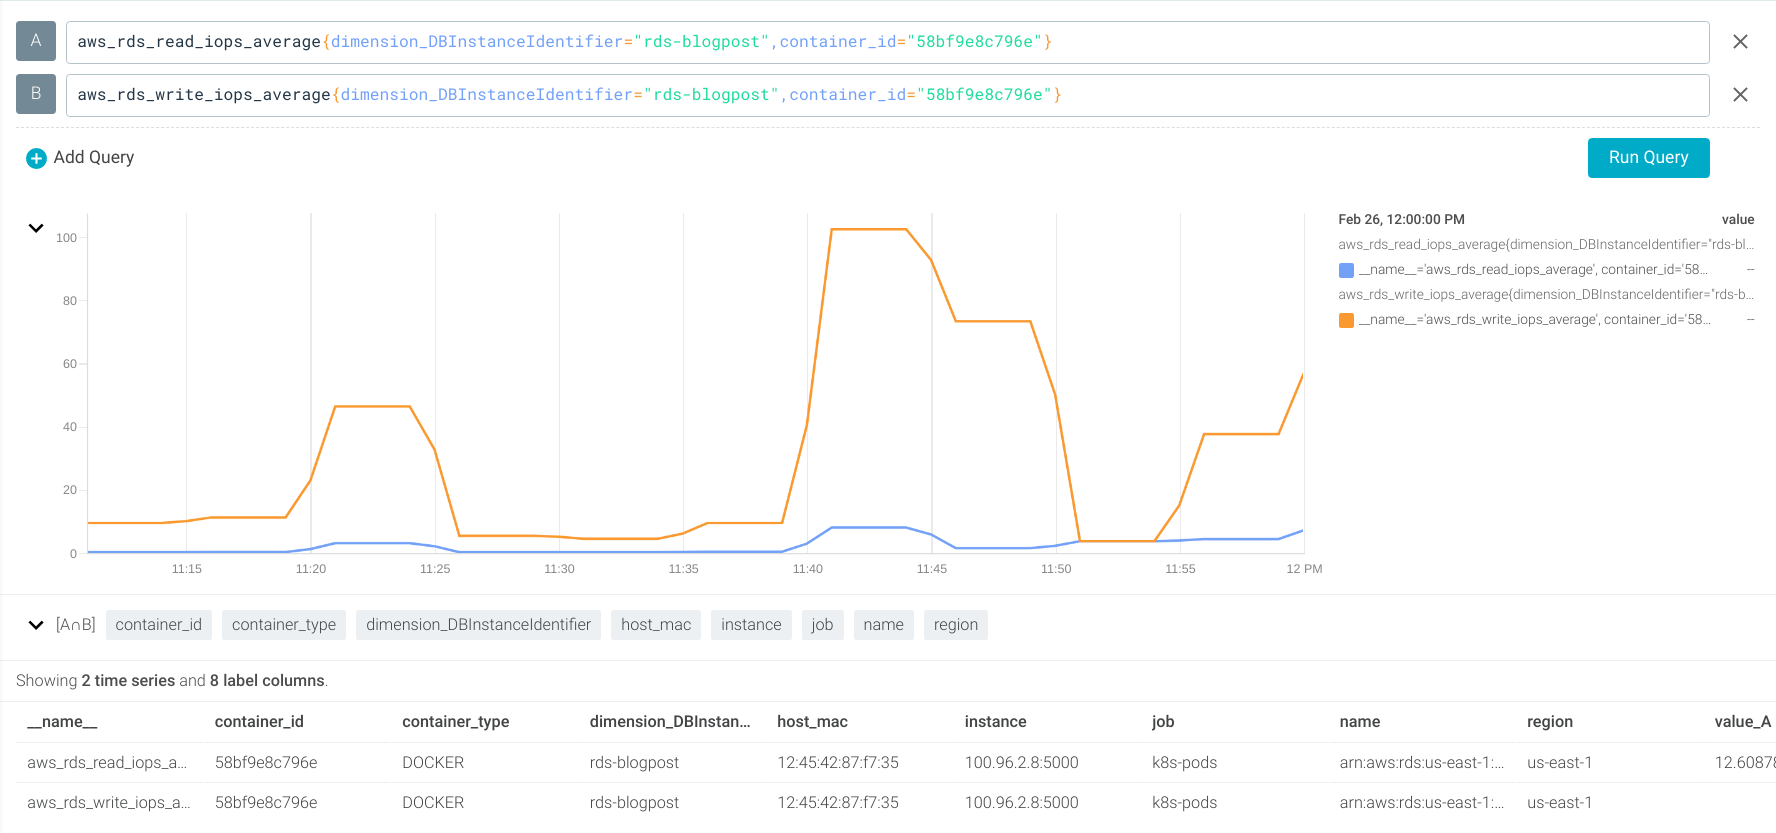
Let’s create alerts if the read or write IOPS are greater than 2,500 operations per second.
aws_rds_read_iops_average > 2500
aws_rds_write_iops_average > 2500
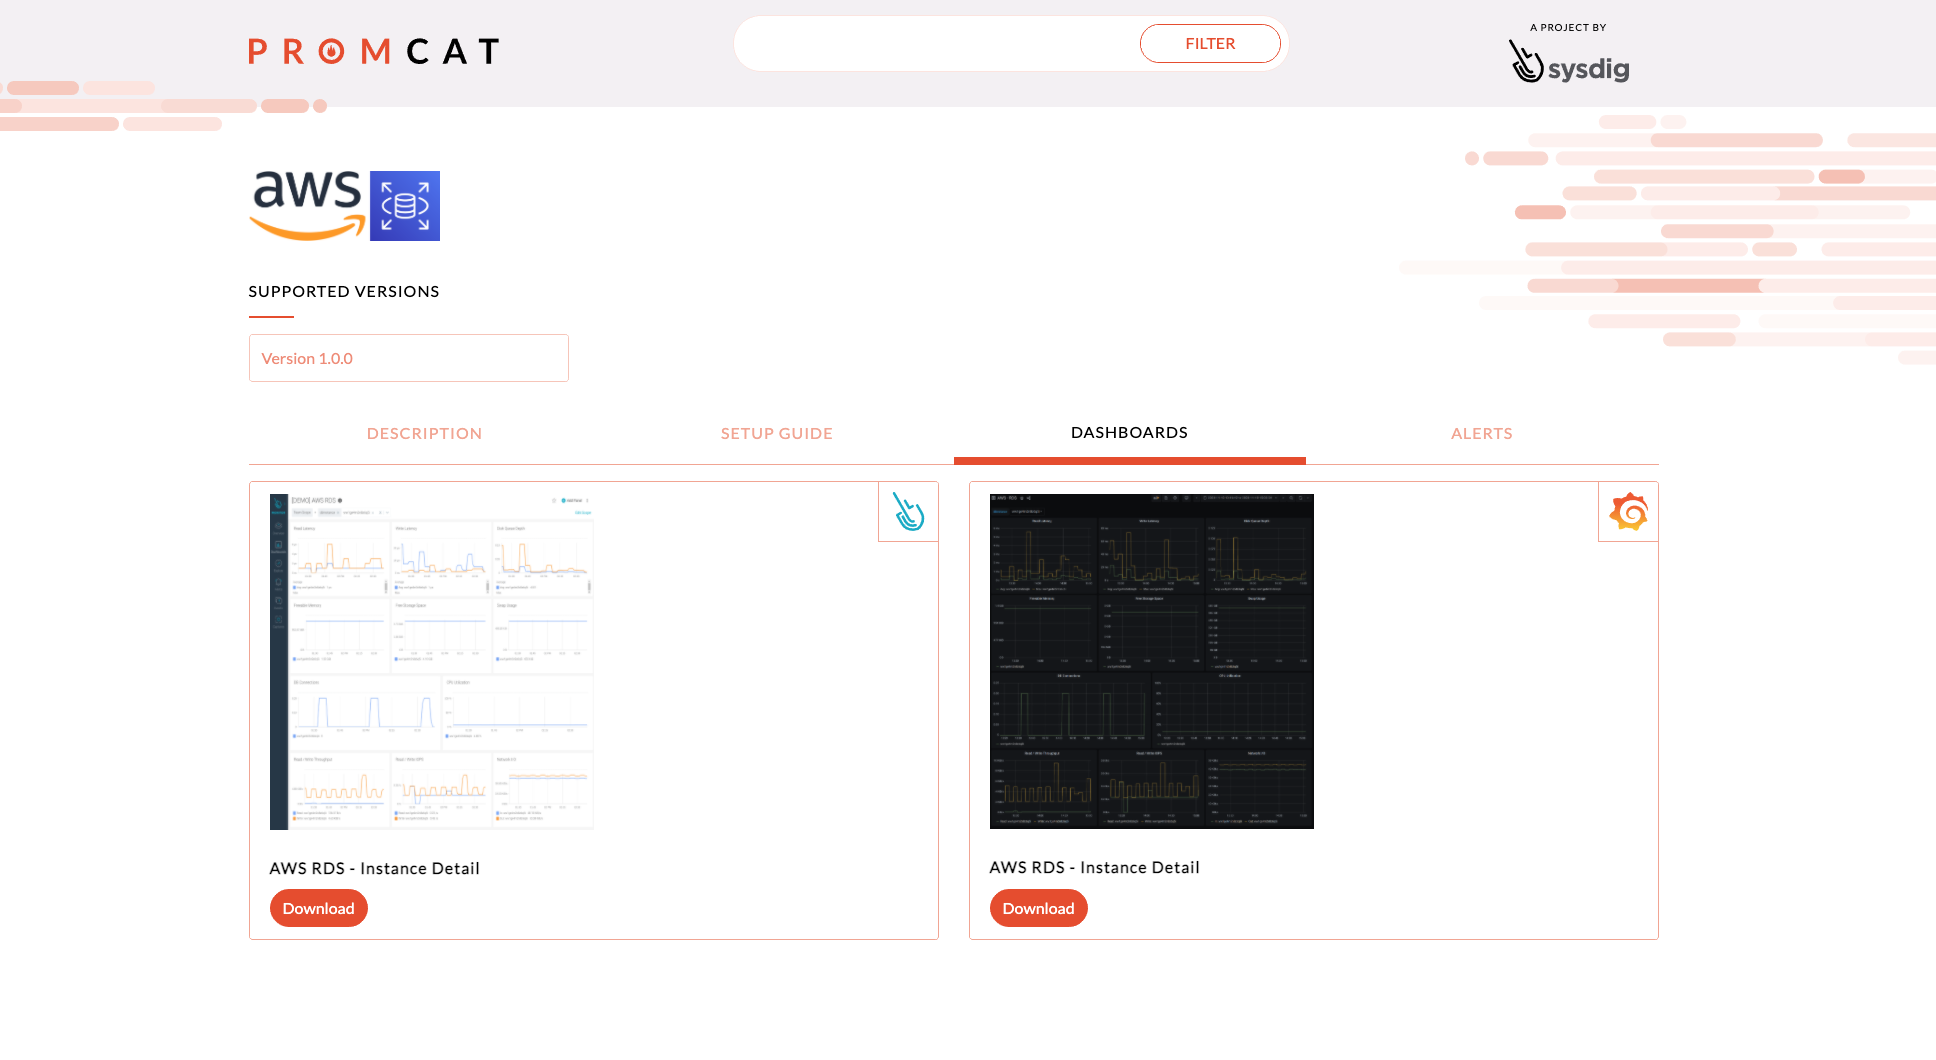
What’s next: Install this dashboard in a few clicks
In this article, we’ve learned how easy it is to monitor Amazon RDS and identify the top five key metrics when monitoring Amazon RDS with examples.
All these metrics are available in the dashboards you can download from PromCat. They can be used in Grafana and in Sysdig Monitor as well!
These top key metrics will allow you to see the full picture when troubleshooting and performing improvements in our Amazon RDS instance.
If you would like to try this integration, we invite you to sign up for a free trial of Sysdig Monitor.
Monitor Kubernetes and troubleshoot issues up to 10x faster
Sysdig can help you monitor and troubleshoot your Kubernetes cluster with the out-of-the-box dashboards included in Sysdig Monitor. Advisor, a tool integrated in Sysdig Monitor accelerates troubleshooting of your Kubernetes clusters and its workloads by up to 10x.
Sign up for a 30-day trial account and try it yourself!