
Monitoring Ceph with Prometheus is straightforward since Ceph already exposes an endpoint with all of its metrics for Prometheus. This article will help you start monitoring your Ceph storage cluster and guide you through all the important metrics.
Ceph offers a great solution for object-based storage to manage large amounts of data even on economical hardware. In addition, the Ceph Foundation is organized as a direct fund under the Linux Foundation.
Monitoring Ceph is crucial for maintaining the health of your disk provider, as well as keeping the cluster’s quorum.
How to enable Prometheus monitoring for Ceph
If you deployed Ceph with Rook, you won’t have to do anything else. Prometheus is already enabled and the pod is annotated, so Prometheus will gather the metrics automatically.
However, if you didn’t deploy Ceph with Rook, there are a couple of additional steps.
Enable Prometheus monitoring
Use this command to enable Prometheus in your Ceph storage cluster. It enables an endpoint returning Prometheus metrics.
ceph mgr module enable prometheus
Please note that you’ll need to restart the Prometheus manager module to completely enable Prometheus after doing this.
Annotate Ceph pods with Prometheus metrics
Add these annotations to ceph-mgr deployment so Prometheus service discovery can automatically detect your Ceph metrics endpoint.
annotations:
        prometheus.io/scrape: 'true'
        prometheus.io/port: '9283'
📀 Learn how easy it is to monitor Ceph with #Prometheus, and identify the top key metrics you need to look at 🤓 📈
Click to tweet
The Golden Signals
The Golden Signals are a reduced set of metrics that offer a wide view of a service from a user or consumer perspective, so you can detect potential problems that might be directly affecting the behavior of the application.
The four Golden Signals are errors, latency, saturation and traffic. If you want to read more about them, you can check our Golden Signals monitoring guide.
Monitoring Ceph errors
Ceph status
The absolute Top 1 metric you should check is ceph_health_status. If this metric doesn’t exist or it returns something different from 1, the cluster is having critical issues.
Let’s create an alert to be aware of this situation:
absent(ceph_health_status == 1)
Cluster remaining storage
As in all systems where you use disks, you need to check the remaining available storage. To check this, you can use ceph_cluster_total_bytes to get the total disk capacity (in bytes) and ceph_cluster_total_used_bytes to get the disk usage (in bytes).
Let’s create a PromQL query to alert when the space left is under 15% of the total disk space:
(ceph_cluster_total_bytes-ceph_cluster_total_used_bytes)/ceph_cluster_total_bytes < 0.15
Object Storage Daemon nodes down
Object Storage Daemon (OSD) is responsible for storing objects on a local file system and providing access to them over the network. There’s an OSD in each node. If an OSD goes down, you won’t have access to the physical disks mounted on that node.
Let’s create an alert as if there’s an OSD down:
ceph_osd_up == 0
When OSD starts up, it peers at other OSD daemons in the cluster to synchronize with them and recover more recent versions of objects and placement groups. This allows the Ceph OSD daemon to recover from unexpected outages, without losing data.
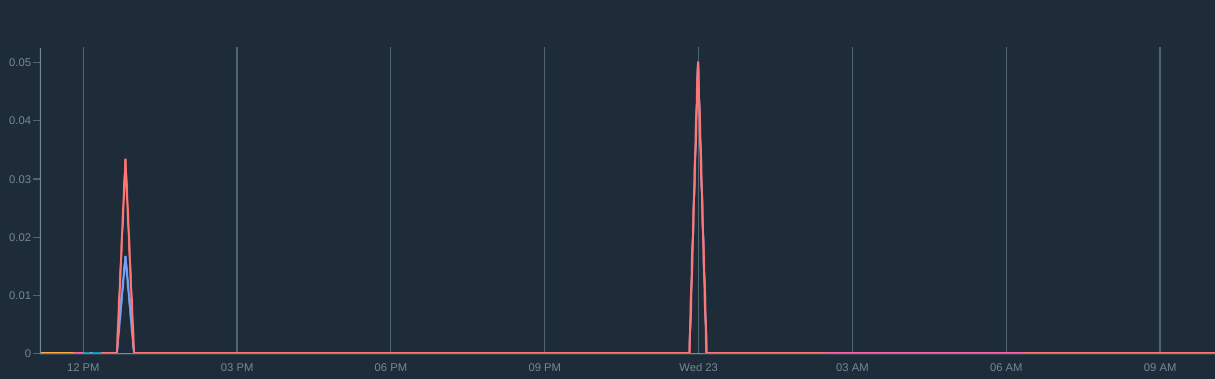
You can see how much impact the OSD downtime generated by analyzing the recovery operations with the ceph_osd_recovery_ops metric. The more recovery operations, the bigger the impact.
This query will return the number of bytes that have been used to recover the sync after a failure:
rate(ceph_osd_recovery_bytes[5m])
Let’s create an alert to notify when an OSD has performed recovery operations as a sign of unexpected failure or termination of the process:
rate(ceph_osd_recovery_ops[5m]) > 0
Missing MDS replicas
It’s important to check that the actual number of MDS replicas isn’t lower than expected. Usually, for high availability (HA), the number is three. But in larger clusters, it can be higher.
ceph-mds is the metadata server daemon for the Ceph distributed file system. It coordinates access to the shared OSD cluster. If MDS is down, you won’t have access to the OSD cluster.
This PromQL query will alert you if there’s no MDS available.
count(ceph_mds_metadata == 1) == 0
Quorum
In case the Ceph MONs cannot form a quorum, cephadm is unable to manage the cluster until the quorum is restored. Learn more about how Ceph uses Paxos to establish consensus about the master cluster map in the Ceph documentation.
It’s recommended to have three monitors to get a quorum. If any is down, then the quorum is at risk.
This can be alerted with the ceph_mon_quorum_status metric:
count(ceph_mon_quorum_status{%s} == 1) <= ((count(ceph_mon_metadata{%s}) %s 2) + 1)
Want to dig deeper into PromQL? Download our PromQL cheatsheet!
Monitoring Ceph latency
Also, you can measure the latency of write/read operations, including the queue to access the journal. To do this, you will use the following metrics:
ceph_osd_op_r_latency_count: Returns the number of reading operations running.ceph_osd_op_r_latency_sum: Returns the time, in milliseconds, taken by the reading operations. This metric includes the queue time.ceph_osd_op_w_latency_count: Returns the number of writing operations running.ceph_osd_op_w_latency_sum: Returns the time, in milliseconds, taken by the writing operations. This metric includes the queue time.
Write latency
Let’s calculate the latency of writing operations, including queue time:
(rate(ceph_osd_op_w_latency_sum[5m]) / rate(ceph_osd_op_w_latency_count[5m]) >= 0)
Read latency
Now, let’s calculate the latency of reading operations, including queue time:
(rate(ceph_osd_op_r_latency_sum[5m]) / rate(ceph_osd_op_r_latency_count[5m]) >= 0)
Since Ceph uses a journal to cache the small operations, you can go deeper and evaluate where the high-latency issues are, either in the write-ahead log or in the synchronization with the physical disk. For this, you can use these metrics:
ceph_osd_commit_latency_ms: Returns the time it takes OSD to read or write to the journal.ceph_osd_apply_latency_ms: Returns the time it takes to write the journal to the physical disk.
Monitoring Ceph saturation
The saturation should describe how full the cluster is. Since Ceph is a storage solution, the main element that is going to be full is the disk. For analyzing this, you can use:
ceph_cluster_total_bytes: Returns the total disk available in the cluster, in bytes.ceph_cluster_total_used_bytes: Returns how much disk capacity is being used, in bytes.
This query will return the percentage of disk available in the cluster:
((ceph_cluster_total_bytes-ceph_cluster_total_used_bytes)/ceph_cluster_total_bytes) * 100
Let’s create an alert that triggers when the cluster will run out of space in the next five days:
predict_linear(ceph_cluster_total_used_bytes[1d],5 * 24 * 3600) > ceph_cluster_total_bytes
Monitoring Ceph traffic
When we talk about traffic in a storage solution, we are referring to read and write operations. When monitoring ceph traffic, you can analyze the number of operations per second (IOPS) and the average operation speed, called throughput. For this, you can use the following metrics:
ceph_osd_op_w: Returns the total write operations.ceph_osd_op_r: Returns the total read operations.ceph_osd_op_w_out_bytes:Returns the total written bytes.ceph_osd_op_r_out_bytes:Returns the total read bytes.
IOPS
To get the number of operations per second performed by Ceph, you can use the following PromQL queries:
rate(ceph_osd_op_w[5m]): Returns the write IOPS.rate(ceph_osd_op_r[5m]):Returns the read IOPS.
Throughput
rate(ceph_osd_op_r_out_bytes[5m]): Returns the write throughput.rate(ceph_osd_op_w_in_bytes[5m]):Returns the read throughput.
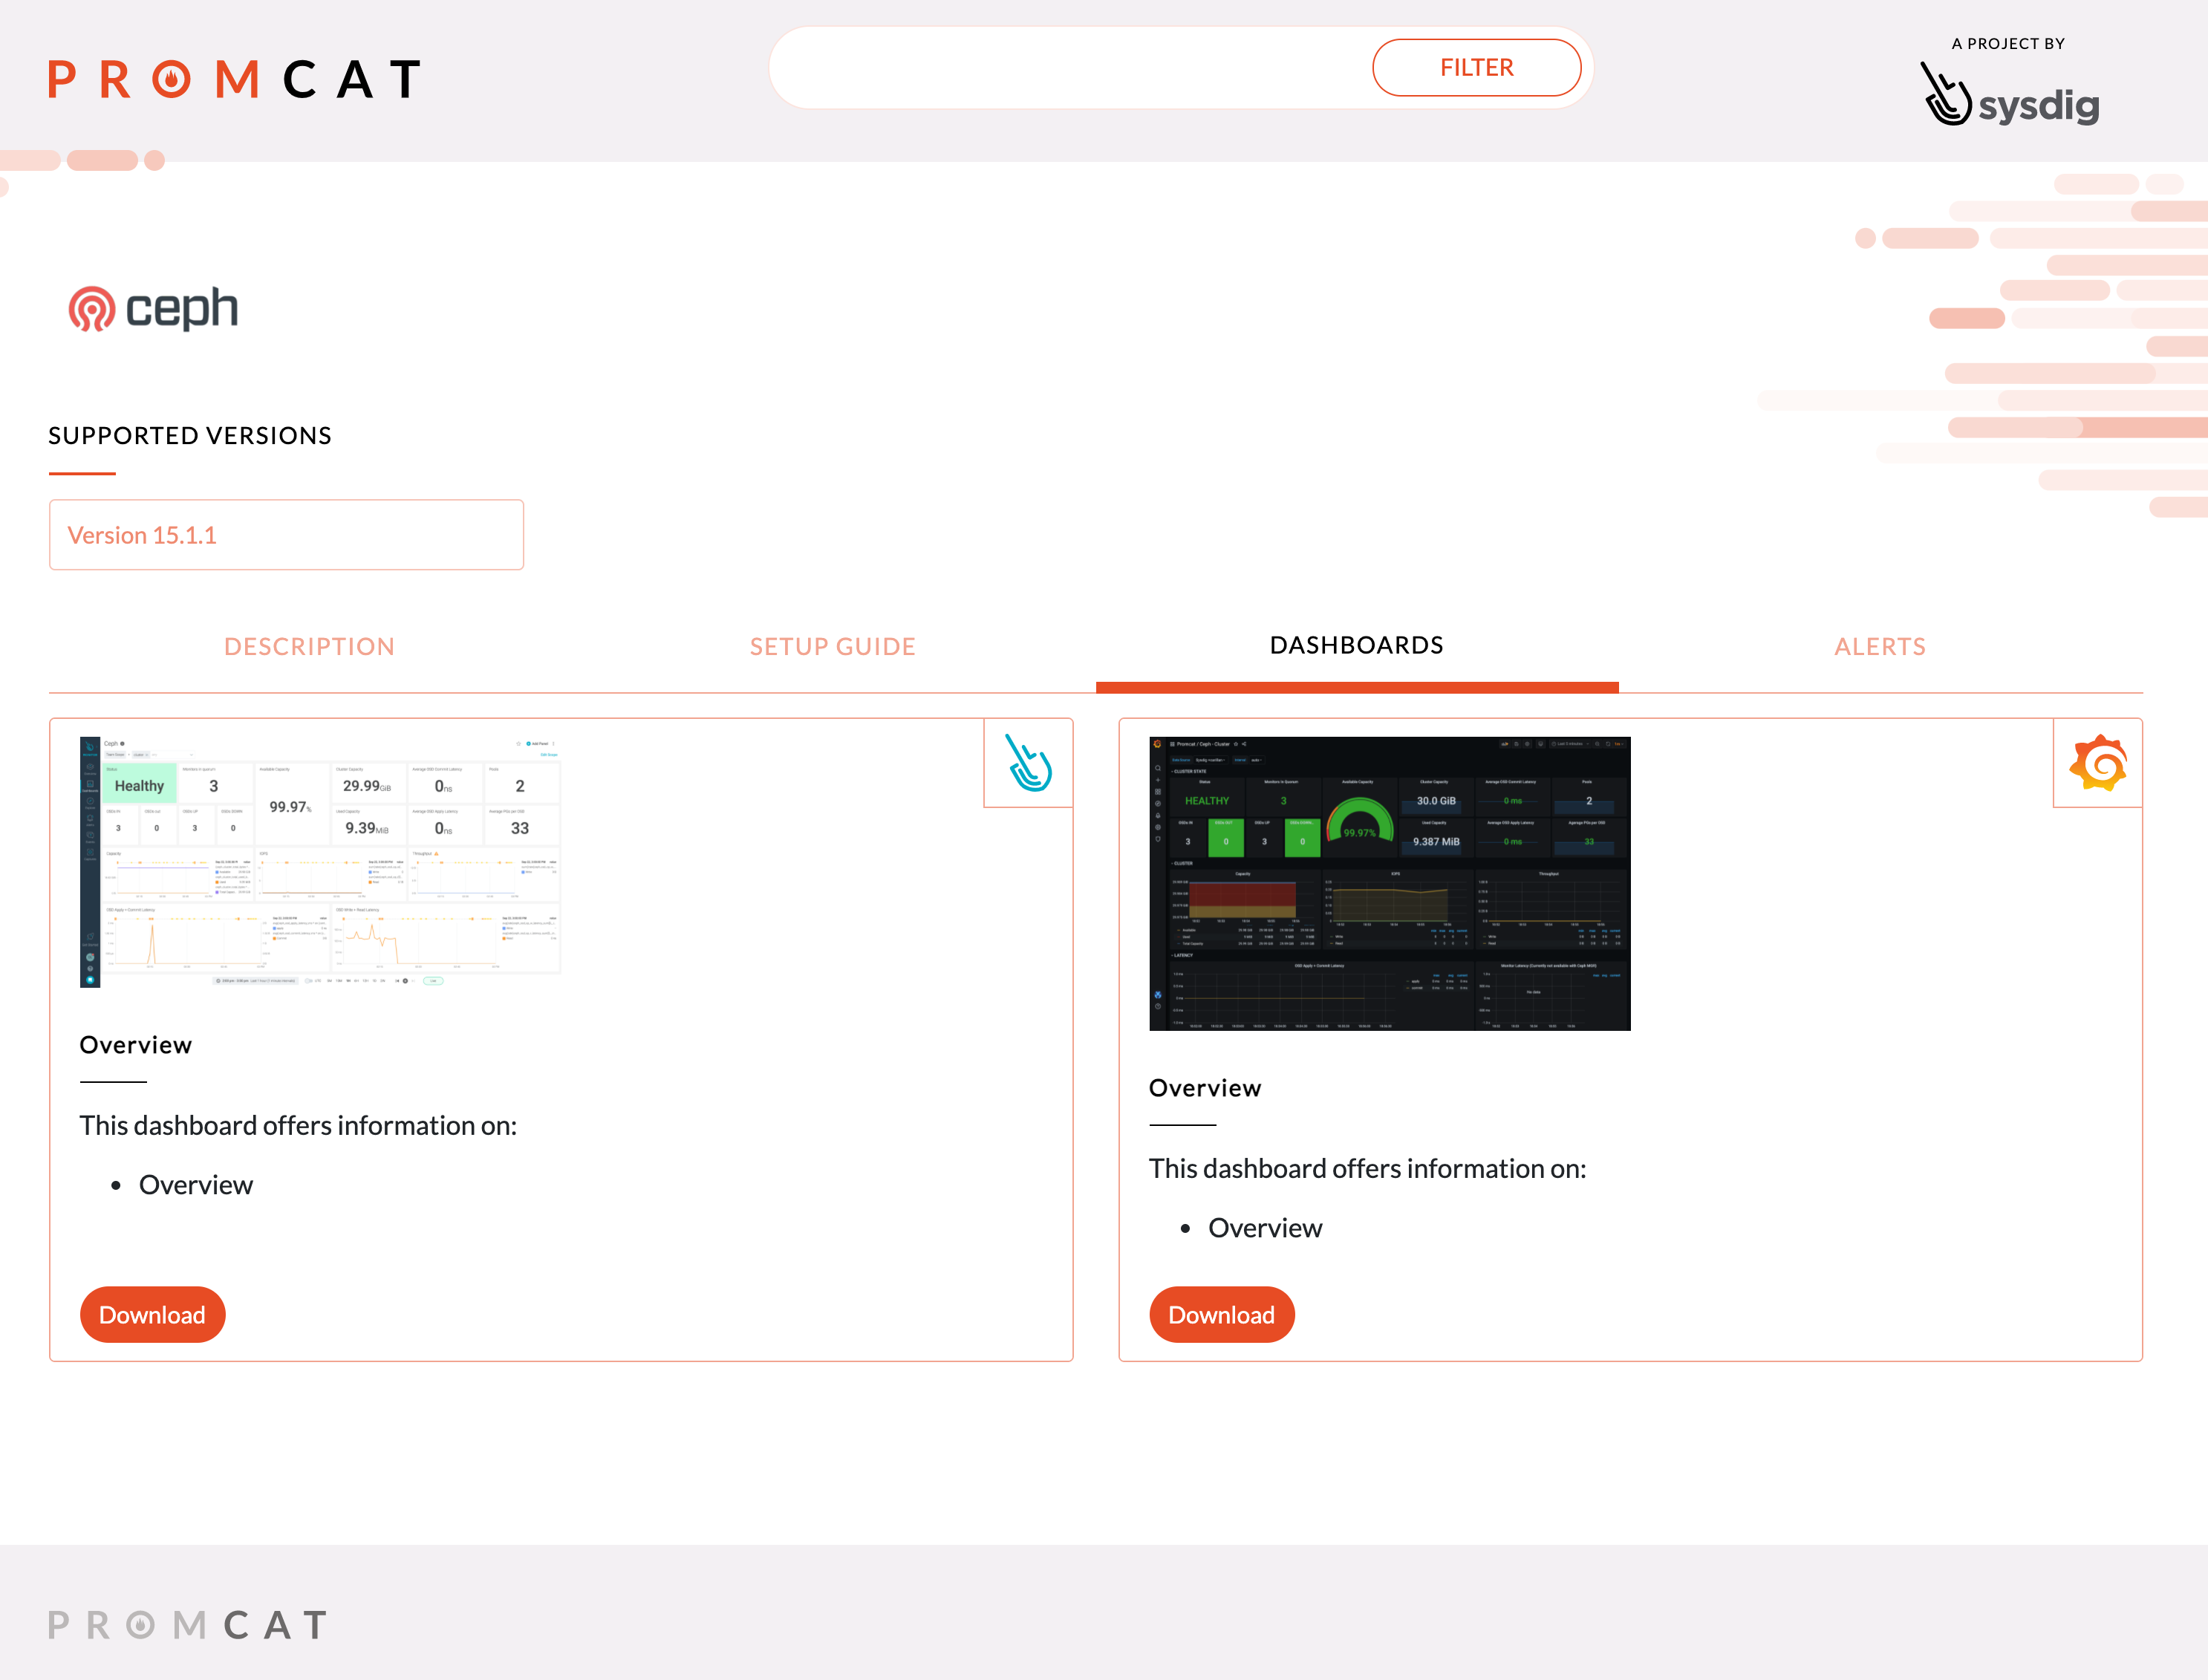
Add these metrics to Grafana or Sysdig Monitor in a few clicks
In this article, we’ve learned how monitoring Ceph health with Prometheus can easily help you check your Ceph cluster health, and identified the top five key metrics you need to look at.
In PromCat.io, you can find a dashboard and the alerts showcased in this article, ready to use in Grafana or Sysdig Monitor. These integrations are curated, tested, and maintained by Sysdig.
Also, learn how easy it is to monitor Ceph with Sysdig Monitor.
If you would like to try this integration, we invite you to sign up for a free trial of Sysdig Monitor.