


Falco Feeds extends the power of Falco by giving open source-focused companies access to expert-written rules that are continuously updated as new threats are discovered.

In this blog post, we are going to teach you how to aggregate all Kubernetes security events across your AWS container services. We'll be using AWS FireLens to route Falco notifications, centralizing all the security events, such as AWS CloudWatch, in one service.
We will:
- Aggregate events from any AWS container platform (EKS, ECS, Kubernetes on EC2, etc.).
- Stream events to CloudWatch or different Amazon Kinesis Data Firehose destinations (Amazon S3, Amazon Elasticsearch Service, and Amazon Redshift) for further analysis.
In doing so, we'll unlock several key benefits:
- Consolidate all of your container security events in one place for continuous log retention for compliance and audit purposes.
- Create dashboards and alerts from the security events with CloudWatch Insights to accelerate incident response.
- Trigger automatic responses through AWS services to remediate certain security incidents.
- Gain confidence in your infrastructure by standardizing log collection and forwarding using open source components like Fluent Bit and Falco that work anywhere, across different clusters and providers.
Introducing Falco for multi-cluster security.

Introduction to the tools: FireLens, Falco and CloudWatch
Definitions:
FireLens is an Amazon created project that routes logs from your AWS container services to several destinations. With just a simple configuration in your ECS, EKS or Fargate clusters, FireLens can route any container logs to services like AWS CloudWatch and S3, Elasticsearch or Redshift through Kinesis Firehose.
Falco is the CNCF open source project for intrusion and abnormality detection for containers and cloud-native apps. Falco will generate security events when it finds abnormal behaviors, which are defined by a customizable set of rules.
CloudWatch is the monitoring and observability service for AWS environment. When doing incident response, you can use CloudWatch to query several logs at once, crossing information to make debugging and post-mortem analysis faster and more effective. CloudWatch also processes your logs to create metrics than can be used to set alarms or visualize trends in dashboards.
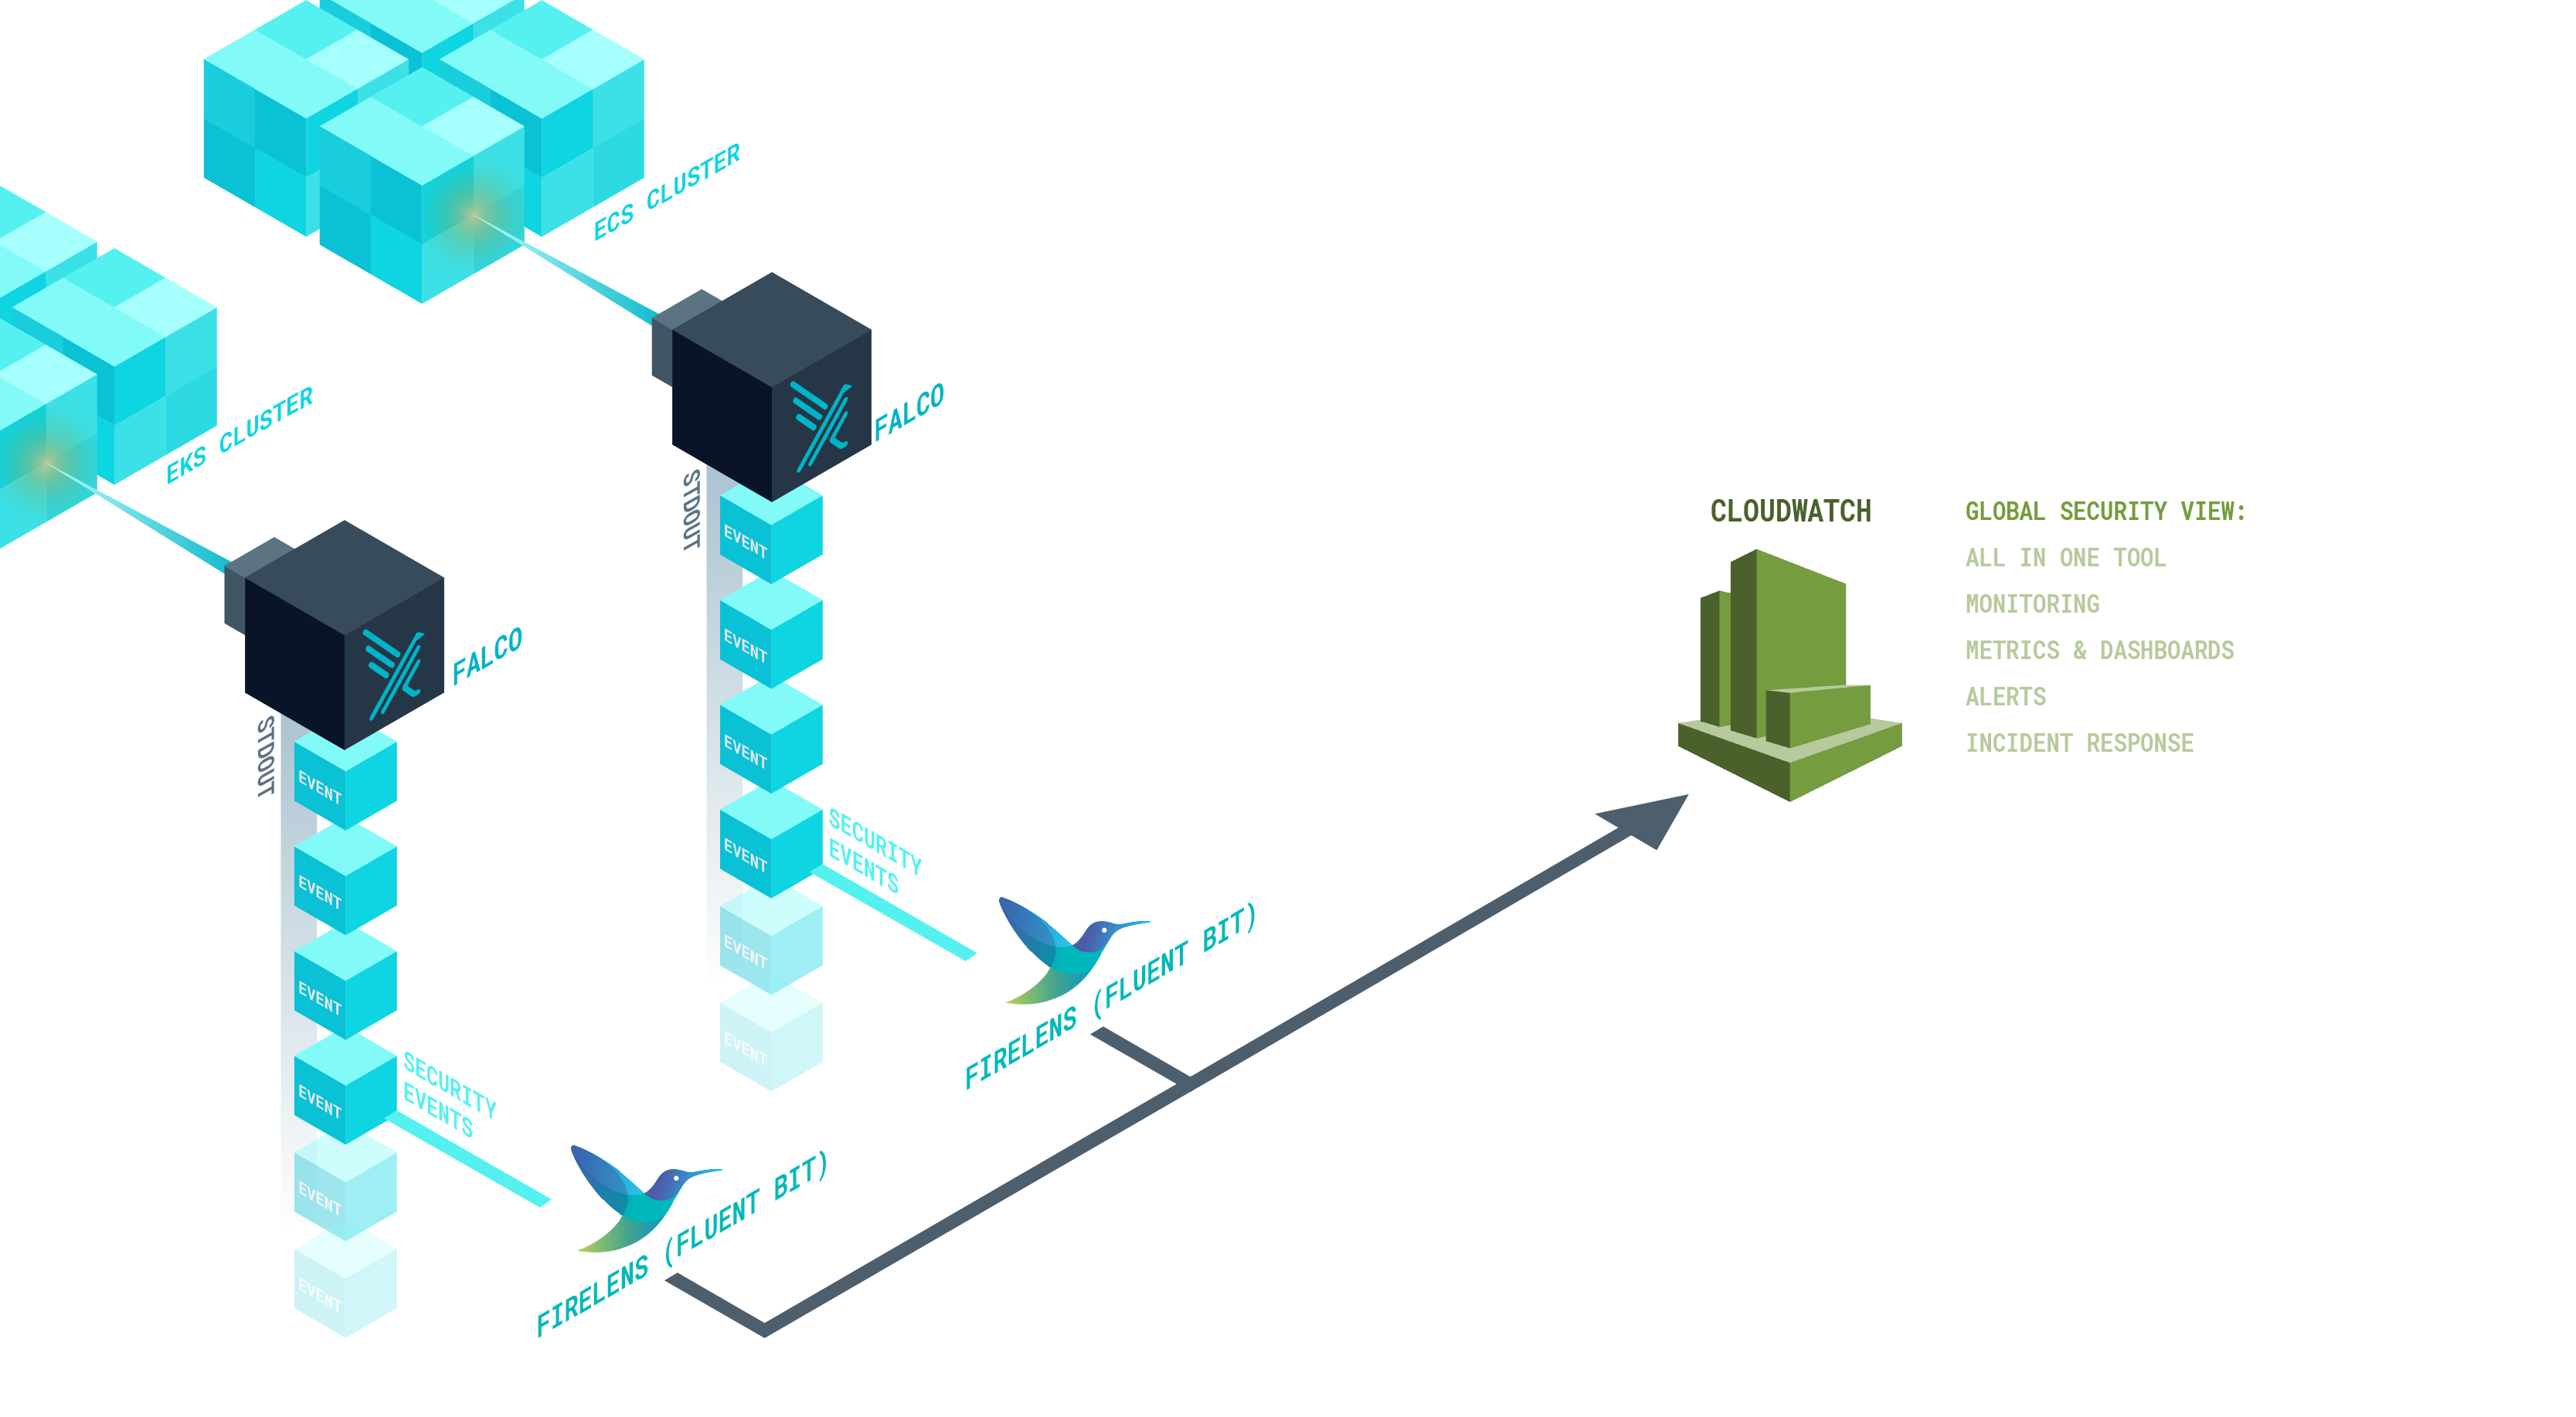
We'll use Falco in each of our cluster nodes to detect runtime security events, then we'll deploy CloudWatch to monitor our infrastructure.
As Falco will output the events into the standard output, we'll leverage FireLens to collect and send them into CloudWatch. Here lies the strength of AWS FireLens; it can connect two services that don't know how to talk to each other, or rather, that are talking in different channels.
Under the hood, FireLens bundles open source log collection tools, such as Fluent Bit and fluentd, with specific output plugins for AWS services, like CloudWatch and Kinesis Firehose.
Hands on! Streaming Falco alerts to AWS FireLens
Now that our tools are introduced, it's time to trace an implementation plan. There are several ways to deploy FireLens, each adapted to a different kind of cluster or the AWS container service that you use.
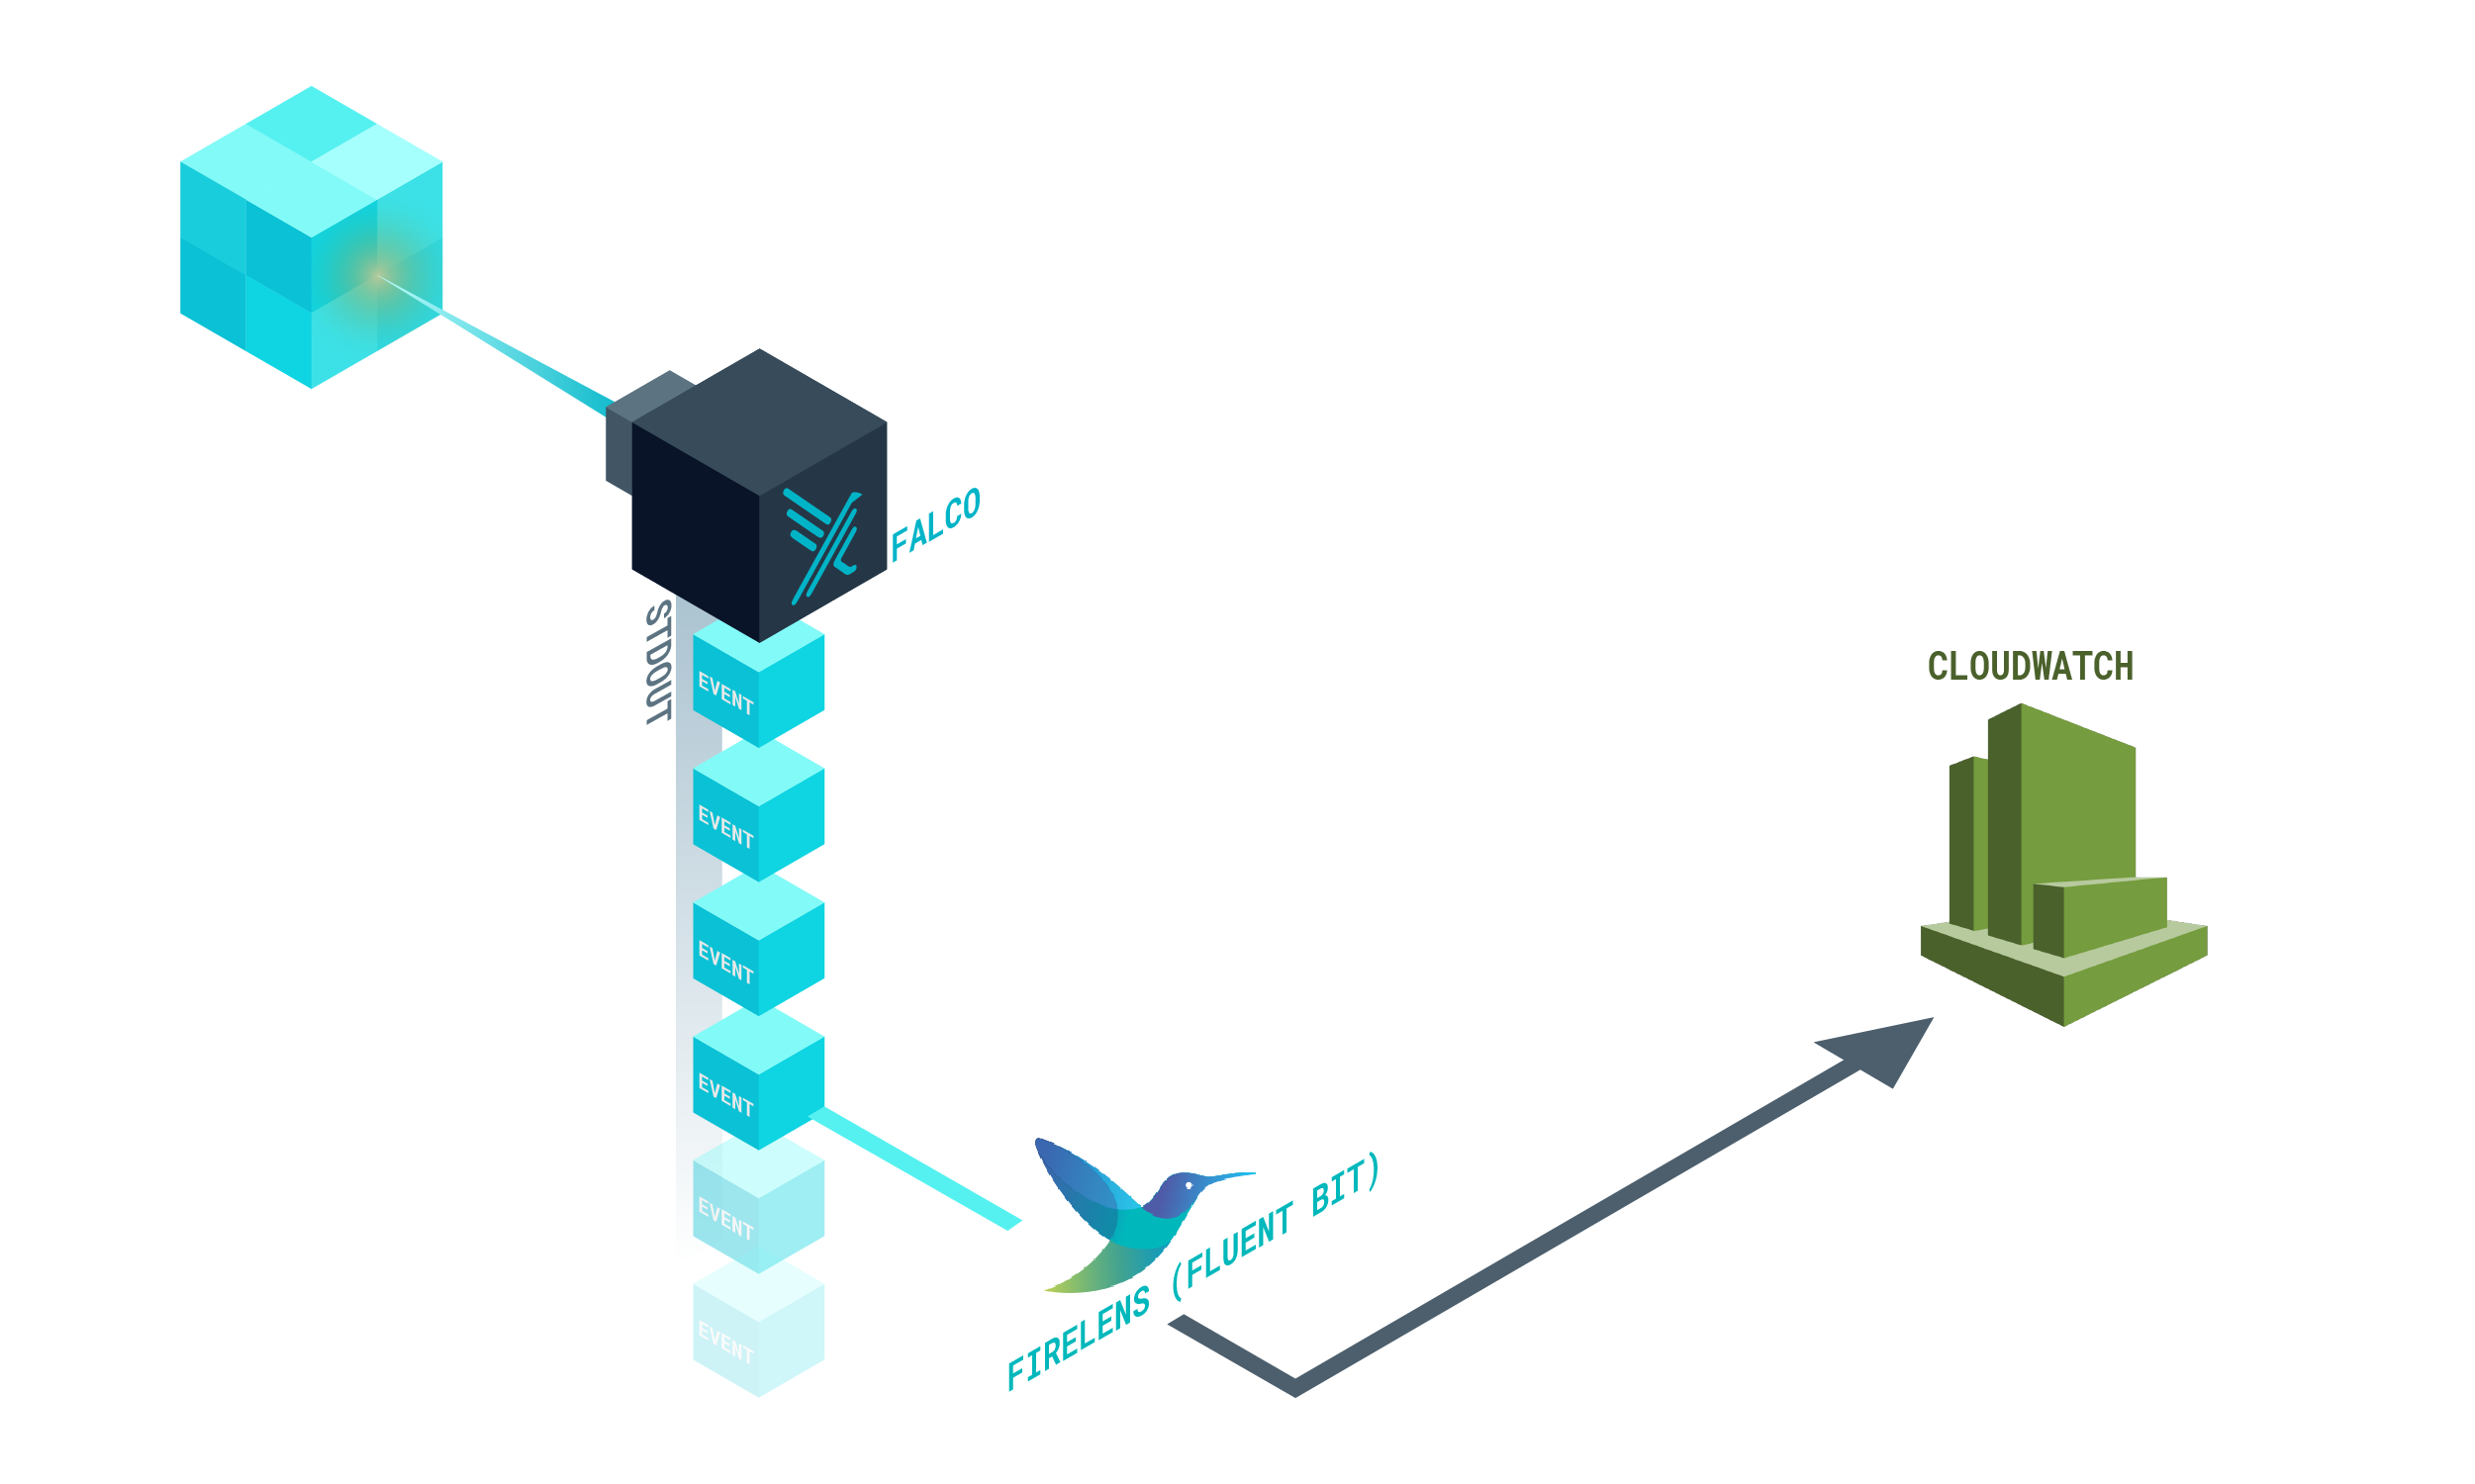
This is the journey that Falco security events will follow towards CloudWatch:
- Falco outputs security events to STDOUT. It will use the JSON formatter.
- Then, FireLens collects the JSON log and processes the payload.
- Finally, FireLens forwards the event into a CloudWatch log stream.
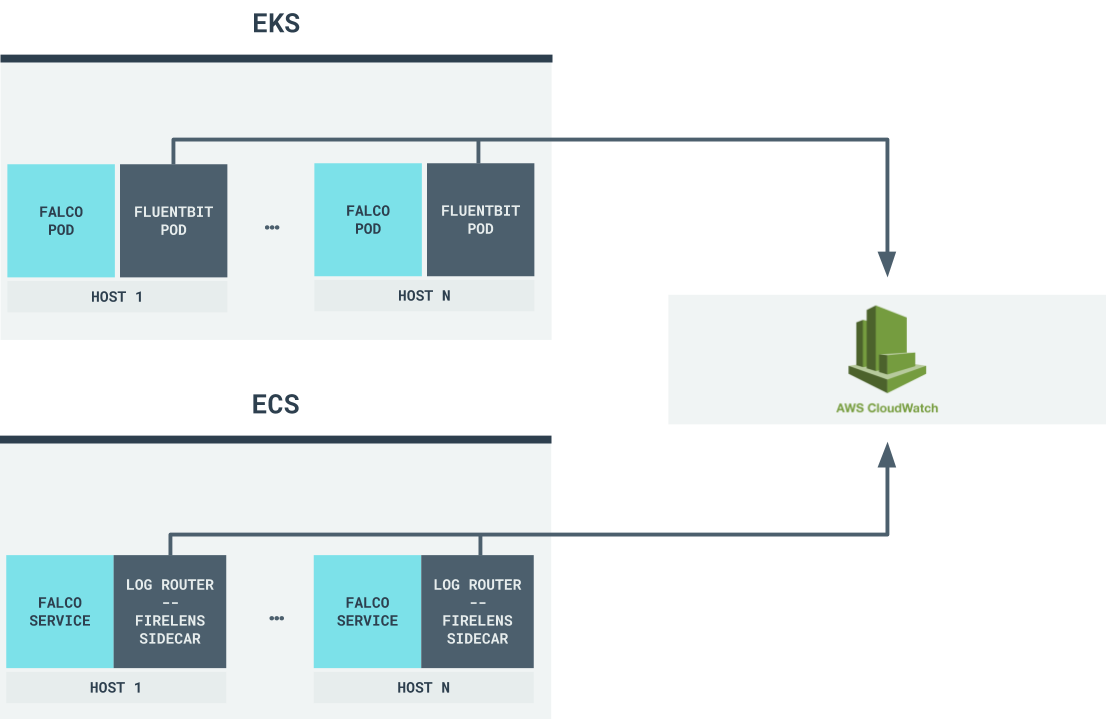
We will be deploying FireLens in EKS using the Fluent Bit container image distributed by Amazon and in ECS, using a sidecar container, also provided by Amazon.
We have documented step-by-step process and scripted it for your convenience.
Don't forget to star the sysdiglabs/falco-aws-firelens-integration GitHub repository. Okay, now let's get started!
Deploying Falco and FireLens Fluent Bit on EKS
First, you will need to clone sysdiglabs/falco-aws-firelens-integration and ensure you meet the following prerequisites:
- Helm with Tiller deployed on the EKS cluster.
- aws cli tools to handle all AWS configuration settings. Ensure you are using an
awscli tool which uses boto greater or equal to 1.12.224. - jq to help with the scripts.
$ git clone https://github.com/sysdiglabs/falco-aws-firelens-integration
$ cd falco-aws-firelens-integration/eks
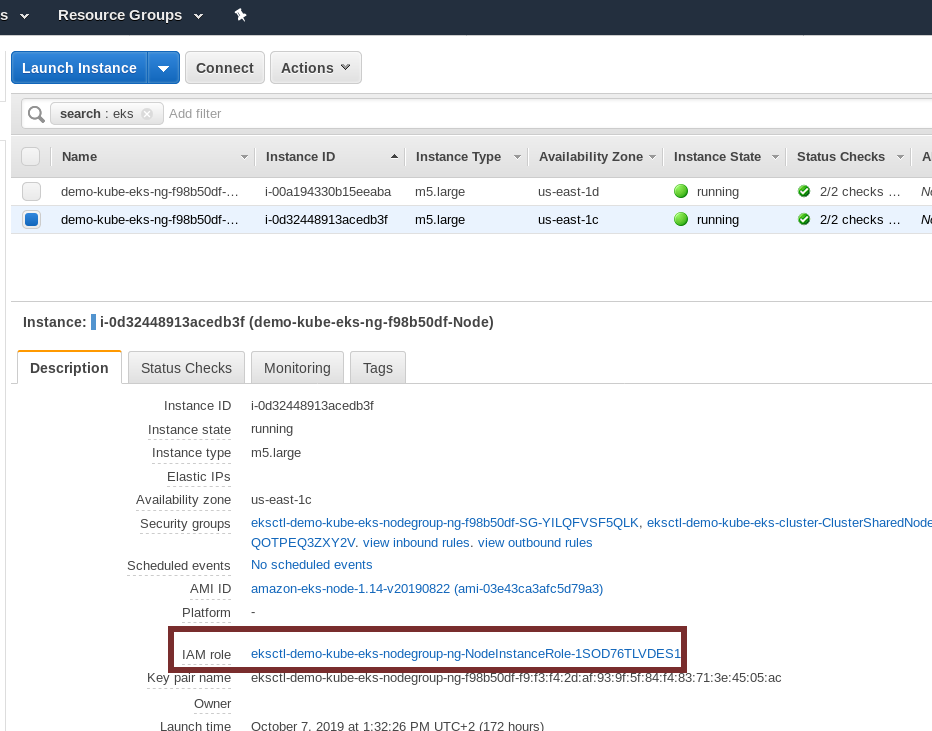
Once you have your EKS cluster deployed, make sure that your EKS worker nodes can send logs to CloudWatch. In order to do so, find the IAM role used for each node and ensure it has permissions to send logs to CloudWatch. Using the aws cli, it would be like this:
$ aws iam create-policy --policy-name EKS-CloudWatchLogs --policy-document file://./fluent-bit/aws/iam_role_policy.json
$ aws iam attach-role-policy --role-name --policy-arn `aws iam list-policies | jq -r '.[][] | select(.PolicyName == "EKS-CloudWatchLogs") | .Arn'`
Don't forget to replace the EKS-NODE-ROLE-NAME with the IAM role your nodes are using. You can get this value from your EC2 dashboard. Find the EC2 instance that runs the EKS node, select it, and see the details about the IAM role:
By using IAM roles at a node level, all pods running on our node will share the same permissions. For EKS deployed clusters, Amazon announced another interesting option on September 2019, the IAM roles for Service Accounts (IRSA). IRSA allows you to set fine grained permissions at pod level, which is great for security as this reduces the attack surface.
The following step is to install the Fluent Bit daemonSet:
$ kubectl apply -f fluent-bit/
This will create the serviceAccount, the configMap and the daemonSet itself.
Let's go through the configMap that contains the Fluent Bit configuration:
apiVersion: v1
kind: ConfigMap
metadata:
name: fluent-bit-config
labels:
app.kubernetes.io/name: fluentbit
data:
fluent-bit.conf: |
[SERVICE]
Parsers_File parsers.conf
[INPUT]
Name tail
Tag falco.*
Path /var/log/containers/falco*.log
Parser falco
DB /var/log/flb_falco.db
Mem_Buf_Limit 5MB
Skip_Long_Lines On
Refresh_Interval 10
[OUTPUT]
Name cloudwatch
Match falco.**
region eu-west-1
log_group_name falco
log_stream_name alerts
auto_create_group true
parsers.conf: |
[PARSER]
Name falco
Format json
Time_Key time
Time_Format %Y-%m-%dT%H:%M:%S.%L
Time_Keep Off
# Command | Decoder | Field | Optional Action
# =============|==================|=================
Decode_Field_As json log
This configuration instructs Fluent Bit to read the STDOUT for the Falco containers, decode the entries with a JSON parser and send them to you CloudWatch stream.
CloudWatch organizes logs into log groups containing streams. A group can represent an application, containing one stream for each type of log (security events, debug information, ect.). We'll send our events to the Falco log group under a stream named alerts.
Finally, we need to install Falco, and we will do it using the Helm chart:
$ helm install --name=falco --set falco.jsonOutput=true stable/falco
Once this deployment is completed, Falco will be scanning our Kubernetes cluster for anomalous behavior and outputting the events formatted as JSON to the STDOUT.
Deploying Falco and FireLens on ECS
Deploying Falco and FireLens on ECS is quite a similar process in EKS, with some particularities.
Similar to before, our ECS nodes need to send the alerts to CloudWatch. Make sure the nodes have permission to execute these commands from the falco-aws-firelens-integration/ecs folder in our sysdiglabs/falco-aws-firelens-integration repository:
$ aws iam create-policy --policy-name ECS-CloudWatchLogs --policy-document file://./fluent-bit/iam_role_policy.json
$ aws iam attach-role-policy --role-name --policy-arn `aws iam list-policies | jq -r '.[][] | select(.PolicyName == "ECS-CloudWatchLogs") | .Arn'`
Like the EKS deployment, you can get its value from your EC2 dashboard. Find the EC2 instance who runs the ECS node, select it, and see the details about the IAM role.
As we mentioned earlier, we'll deploy FireLens with the Falco service using the Fluent Bit sidecar container provided by AWS. In the task definition, make sure that you are using the awsfirelens log driver:
...
{
"essential": true,
"image": "amazon/aws-for-fluent-bit:latest",
"name": "log_router",
"firelensConfiguration": {
"type": "fluentbit",
"options": {
"enable-ecs-log-metadata": "true"
}
},
"memory": 128
},
{
"name": "falco",
"image": "falcosecurity/falco:0.17.1",
"essential": true,
"cpu": 10,
"memory": 512,
"privileged": true,
"command": [
"/usr/bin/falco",
"-pc",
"-o", "json_output=true"
],
"logConfiguration": {
"logDriver":"awsfirelens",
"options": {
"Name": "cloudwatch",
"region": "eu-west-1",
"log_group_name": "falco",
"log_stream_name": "alerts",
"auto_create_group": "true"
}
},
…
We need to include cluster metadata in our logs, both to know where an alert comes from, and to be able to filter our security events. With the enable-ecs-log-metadata parameter, Fluent Bit will enrich the logs with fields like ecs_cluster, ecs_task_definition, or ec2_instance_id.
At the end, with logDriver: awsfirelens and Name: cloudwatch, we instruct Fluent Bit to route the security events to the proper log stream in CloudWatch.
Finally, to deploy the task definition and the service, run:
$ aws ecs register-task-definition --cli-input-json file://./falco/task-definition.json
$ aws ecs create-service --cluster "" --service-name falco --task-definition `aws ecs list-task-definitions | jq -r '.taskDefinitionArns[] | select(. | contains("Falco"))'` --scheduling-strategy DAEMON
You can get the CLUSTER_ARN value by listing your ECS clusters from the CLI, then looking for the one you want to deploy Falco in:
$ aws ecs list-clusters
{
"clusterArns": [
"arn:aws:ecs:eu-west-1:845153661675:cluster/nestor-sysdig-ecs-firelens-demo"
]
}
AWS folks have already published awesome documentation on Custom Log Routing on ECS. Don't miss it if you want to learn more about FireLens on Amazon Elastic Container Service.
Visualizing the Falco security events in CloudWatch
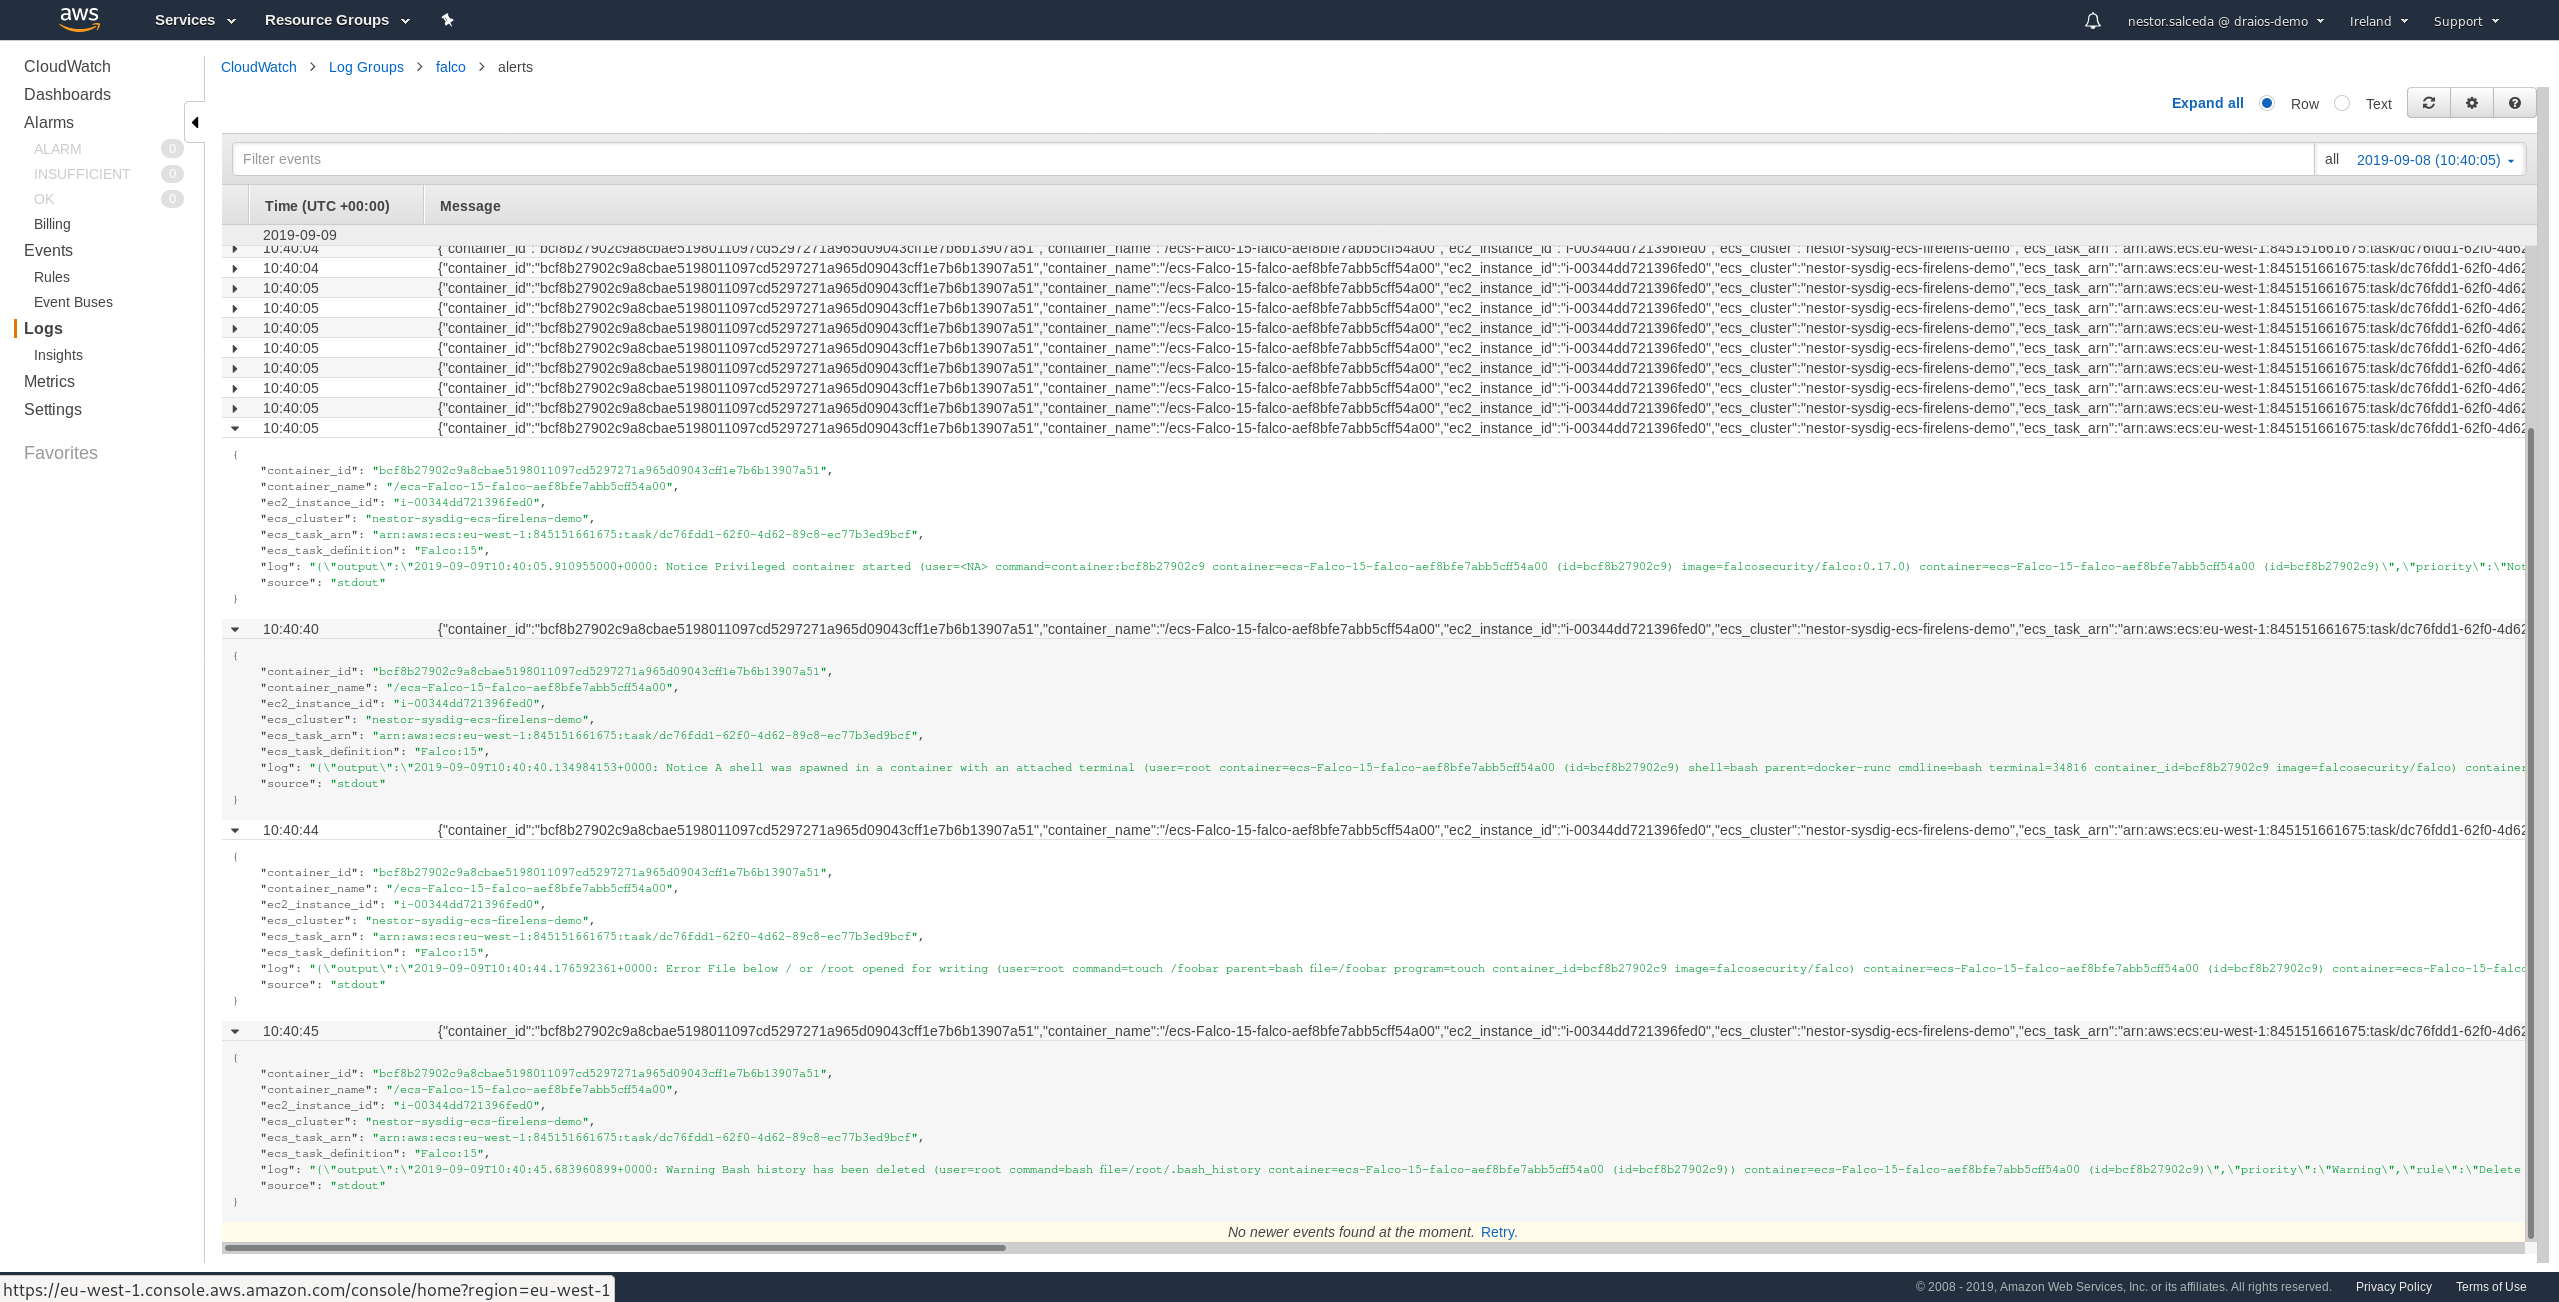
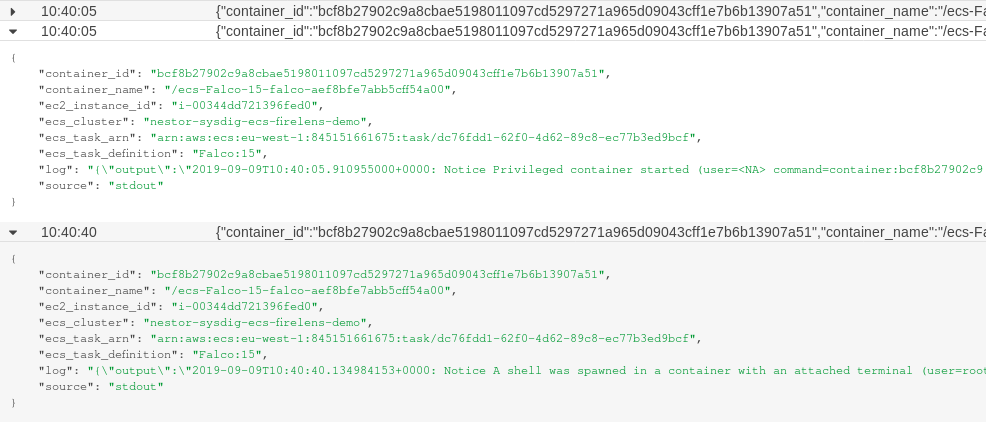
Once everything is deployed, we can head to CloudWatch to check the Falco log group and the alerts log stream. There we can see all security events from our clusters, centralized in the same tool:

Now you are ready to setup automated responses to remediate these security events, and you can do so by using AWS Lambda functions, read on Securing Amazon EKS Using Lambda and Falco.
Conclusions
Falco can go beyond host and cluster detection. With a centralized event forwarding and one aggregation solution, you can get information about what's happening in containers across all your clusters on any AWS container service, like ECS, EKS or self-hosted Kubernetes on EC2.
AWS FireLens provides an easy way to collect logs across different clusters and AWS managed container platforms like ECS and EKS. By aggregating them in CloudWatch, you simplify your log management and speed up your incident response.