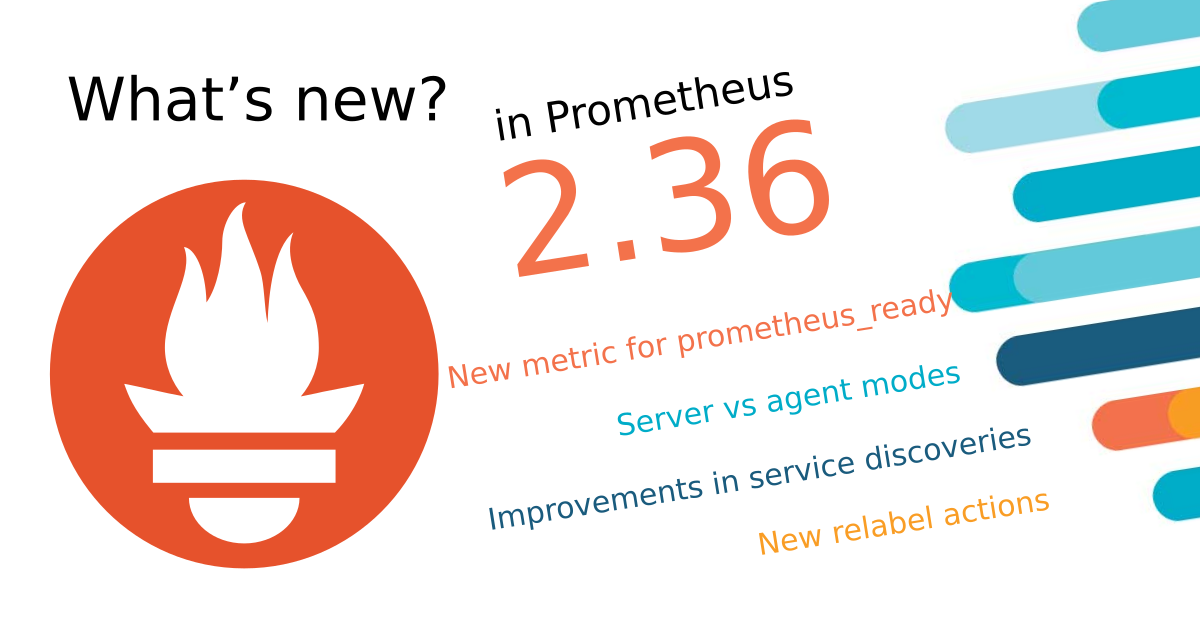
In this article, we will analyze some new features and the impact they might have on the Prometheus community. Here’s our editor’s pick:
#10641 New relabel actions
In this new version, we can use two new actions that change the value of a metric to uppercase or lowercase. This is important, for example, in metric names that do not follow the standard. Also, this fixes some issues with the new service discovered for IONOS Cloud, that was providing some labels in uppercase format.
Example code:
relabel_configs:
  - action: uppercase
    source_labels: [instance]
    target_label: instance
David Lorite – Integrations Engineer at Sysdig
#10682 New metric for prometheus_ready
There is a classic architecture consisting of a Prometheus monitoring other Prometheus. Its aim is to detect malfunctions in the main monitoring server and to become the watcher of the watcher. This new version introduces a new metric: prometheus_ready. This one joins the already existing up metric. The difference is that “up” monitors when the Prometheus server is running, while prometheus_ready monitors when the WAL is processed after a restart and new metrics start to be ingested.
This metric is useful to monitor slow starts that can mean loss of data and alerts not being triggered. You can create an alert to monitor it with the following example:
prometheus_ready = 0
Nikola Milikic – Software Engineer at Sysdig
#9638 Identification between server and agent modes
It’s now been more than six months since the community presented the feature to use Prometheus in agent mode. This means that the local Prometheus does not store data, and sends the time series to a remote endpoint through remote write. This new mode is gaining traction and maturity. A good example is that from this release, the logs will clearly state if Prometheus is running in server mode (Prometheus Server) or in agent mode (Prometheus Agent).
There is an open discussion about if it would be interesting to add a new metric with information on the mode. We will for sure see more movement around this in following releases.
Carlos Adiego – Integrations Engineer at Sysdig
#10714, #10514, #10673 Improvements in service discoveries
As we saw in Prometheus 2.35, the integration of the Prometheus service discovery with different cloud providers has become a priority for vendors. They can offer their customers a native and official compatibility with Prometheus. However, the open source Prometheus maintainers are also making a good effort to help developers implement and perform the tests needed to ship these new integrations.
The new service discoveries added are for Vultr (#10714), and IONOS Cloud (#10514).
Also, following up the implementation of a metric to count failures in Azure that we saw in the previous release (prometheus_sd_azure_failures_total), we now have a new metric available for Linode service discovery prometheus_sd_linode_failures_total.
Here, we have an example alert on how to detect failures in Linode service discovery:
rate(prometheus_sd_linode_failures_total[5m]) > 0
Jesús Ángel Samitier – Integrations Engineer at Sysdig
These were the new features chosen by our team, but there are more. You can find the full list of changes in the official release notes of Prometheus 2.36.


