blogs
Insights at Cloud Speed
Marimo OSS Python Notebook RCE: From Disclosure to Exploitation in Under 10 Hours
Sysdig Threat Research Team
|
April 9, 2026
Marimo OSS Python Notebook RCE: From Disclosure to Exploitation in Under 10 Hours
TeamPCP expands: Supply chain compromise spreads from Trivy to Checkmarx GitHub Actions
Sysdig Threat Research Team
|
March 23, 2026
TeamPCP expands: Supply chain compromise spreads from Trivy to Checkmarx GitHub Actions

Runtime security for AI coding agents: Protecting AI-assisted development
Eric Carter
|
March 23, 2026
Runtime security for AI coding agents: Protecting AI-assisted development

CVE-2026-33017: How attackers compromised Langflow AI pipelines in 20 hours
Sysdig Threat Research Team
|
March 19, 2026
CVE-2026-33017: How attackers compromised Langflow AI pipelines in 20 hours
join our newsletter
Stay up to date– subscribe to get blog updates now
Thank you! Your submission has been received!
Oops! Something went wrong while submitting the form.
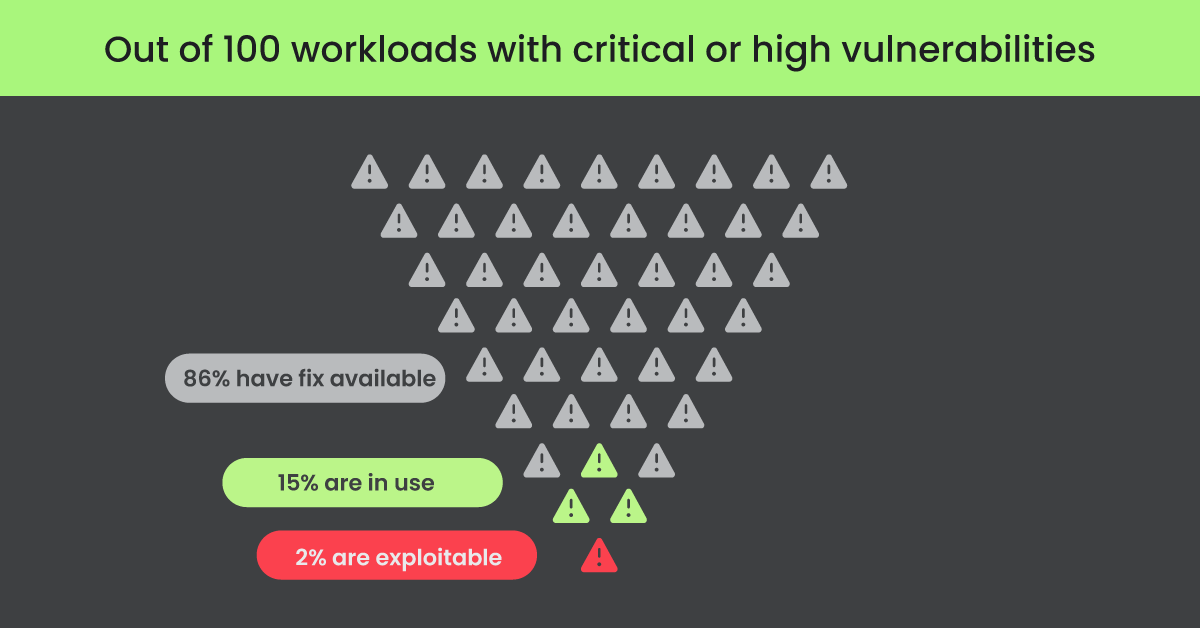
Use in-use vulnerability prioritization to focus on critical risks
April 14, 2026
Matt Kim
Use in-use vulnerability prioritization to focus on critical risks
Cloud Security

Next-gen container security: Why cloud context matters
April 14, 2026
Matt Kim
Next-gen container security: Why cloud context matters
Cloud Security
Kubernetes & Container Security
Guidance for compliance with NIS2, DORA, & other regulations
April 14, 2026
Rayna Stamboliyska
Guidance for compliance with NIS2, DORA, & other regulations
Cloud Security
Compliance

5 steps to securing AI workloads
April 13, 2026
Marla Rosner
5 steps to securing AI workloads
No items found.
Marimo OSS Python Notebook RCE: From Disclosure to Exploitation in Under 10 Hours
April 9, 2026
Sysdig Threat Research Team
Marimo OSS Python Notebook RCE: From Disclosure to Exploitation in Under 10 Hours
Cloud detection & response
Cloud Security
Kubernetes & Container Security
Security for AI

How to use AI to manage cloud security threats
April 8, 2026
Eric Carter
How to use AI to manage cloud security threats
Cloud Security
Kubernetes & Container Security
Sysdig Features
AI for cloud security
