


Falco Feeds extends the power of Falco by giving open source-focused companies access to expert-written rules that are continuously updated as new threats are discovered.

Let's build a smart gardening system with Prometheus and a Raspberry pi.\r\r
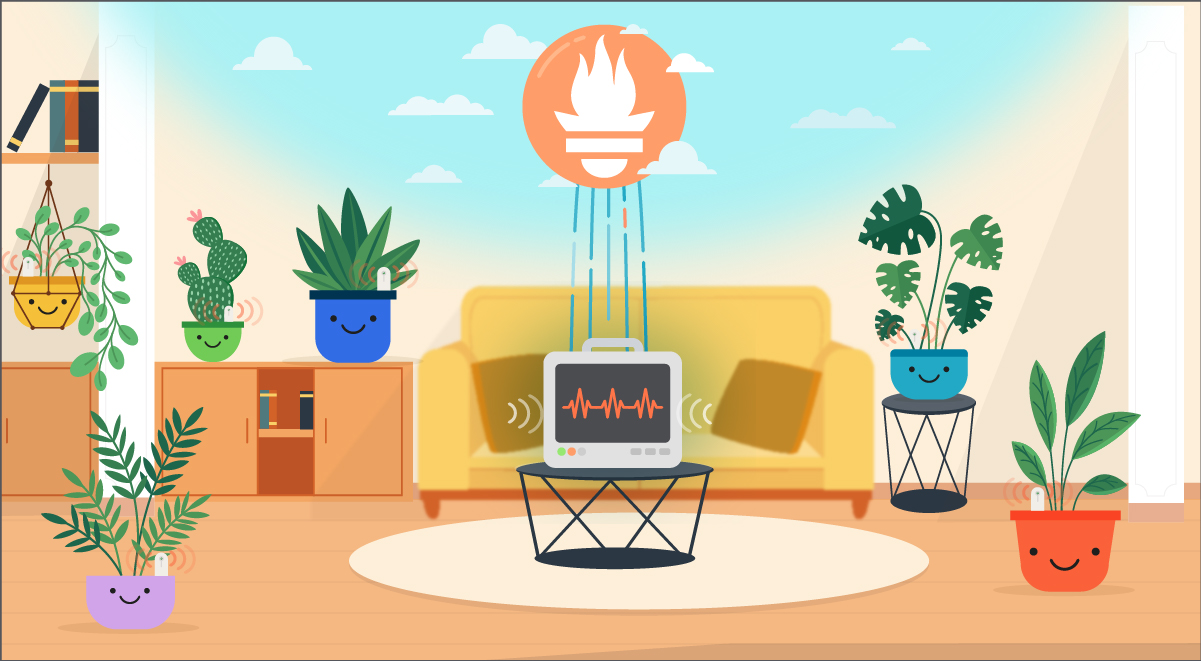
\rHaving plants at home can reduce your stress levels and make your home look more delightful. Seeing your indoor oasis growing gives us a sense of accomplishment and makes us feel proud… until you see that first brown leaf. That's when you start doubting your green fingers.\r
\r
\rPlants have different needs, and having a monitoring system that helps you understand their exact moisture levels, as well as the perfect temperature and light, is a great way to see them grow strong and healthy without guessing if we're doing things right.\r
\r\r\r
What you'll need
\r
- \r
- Flower Sensors (like these)\r
- Raspberry Pi with Bluetooth\r
- MicroSD + adapter (to install RaspOS on the Pi)\r
- Plants\r \r
\r
\rSome optional accessories you may need depending on your Pi setup are a Micro HDMI/HDMI cable and a USB keyboard.\r
\r\r\r
How does this work
\r
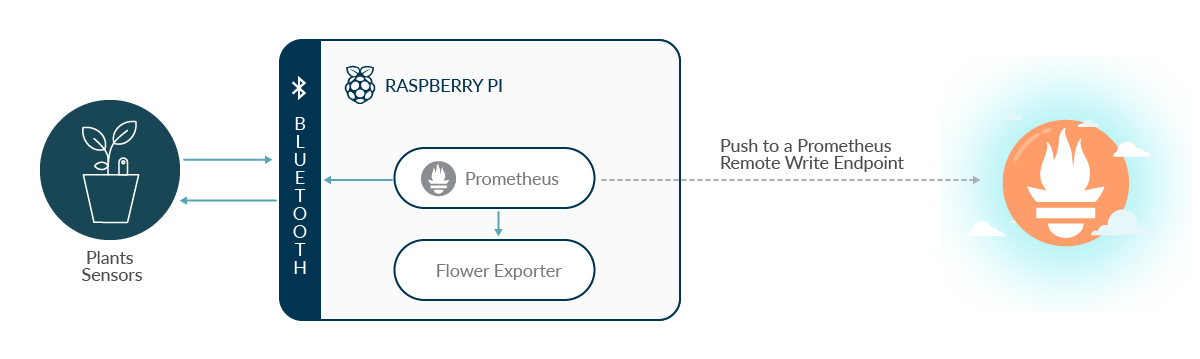
\rSensors will send metrics to the Bluetooth receiver on the Raspi. Then, an exporter will parse these metrics and send them to the service Prometheus instance installed on the Raspi. Finally, this Prometheus instance will push the metrics to a Prometheus remote write endpoint to make them available in the long term.\r
\r\r
\r
\r
\r\r
What you'll monitor
\r
- \r
- Light\r
- Moisture\r
- Temperature\r
- Soil Fertility (thanks to soil conductivity)\r
- Battery % (of the sensor)\r \r
\r
\rBefore starting the configuration, place your sensors in the soil and check your phone to ensure they are working properly. You may need to adjust their positioning – leaves can cover the sensor and you may receive the light metric as 0, while it's just a positioning matter.\r
\r
\rThe next step will be setting up your sensors to communicate with your Pi.\r
\r\r\r
Set up your Raspberry Pi
\r
\rTo get your Pi up and running, all you have to do is to install Raspberry Pi Desktop OS by using Raspberry Pi Imager, following the guided steps, and then connecting it to your WiFi.\r
\r\r\r
Connect your flower sensors
\r
\rOn the Pi, run the following commands:
\r
\r\r\r
sudo bluetoothctl
scan on
\r\r
\rThis will detect the Bluetooth devices around you. Find the flower sensors and take note of their MAC addresses; you'll need them later when configuring the flower exporter. This is how they're going to look:
\r
\r\r
[NEW] Device C4:7C:8D:6B:85:69 Flower care
[NEW] Device C4:7C:8D:6B:85:62 Flower care\r
\r\r\r
Configure Prometheus and the exporter
\r
\rYou can install Prometheus in your Rasperry following the steps on how to install Prometheus in a Raspberri Pi using docker.\r
\r
\rYou'll also need an exporter to collect stats and translate them to a Prometheus format. For this project, you can use flowercare-exporter.\r
\r
\rLet's install it:\r
\r\r
git clone https://github.com/xperimental/flowercare-exporter.git\r
\r
\rYou now need to install Go and build it:\r
\r\r
sudo apt-get install golang\r
go build .\r
\r
\rNow, configure the flower exporter service. Here is where you'll need to paste the MAC addresses detected to associate them with a plant.\r
\r\r
[Unit]\r
Description=Flower exporter\r
After=network.target\r
[Service]\r
ExecStart=./flowercare-exporter -s your_plant_name=MACaddress\r
WorkingDirectory=/home/pi/flowercare-exporter\r
StandardOutput=inherit\r
StandardError=inherit\r
Restart=always\r
User=root\r
[Install]\r
WantedBy=multi-user.target\r
\r\r\r
Configure Prometheus remote write
\r
\rLastly, you need to configure Prometheus to send metrics to a Prometheus remote write endpoint.\r
\r
\rThe configuration of your Prometheus server depends on how you installed it. In general, you have to configure the remote_write section in your prometheus.yml configuration file:\r
\rglobal:\r
  scrape_interval:     10s # By default, scrape targets every 15 seconds.\r
  evaluation_interval: 10s # By default, scrape targets every 15 seconds.\r
  scrape_timeout: 10s      # By default, is set to the global default (10s).\r
  # Attach these labels to any time series or alerts when communicating with\r
  # external systems (federation, remote storage, Alertmanager).\r
  external_labels:\r
      gardener: francesca\r
# A scrape configuration containing exactly one endpoint to scrape:\r
scrape_configs:\r
  - job_name: 'greendig_plants'\r
    static_configs:\r
      - targets: ['127.0.0.1:9294']\r
remote_write:\r
- url: ""\r
  tls_config:\r
    insecure_skip_verify: true\r
\r\r
\rNow, your metrics received in the Raspi, will be pushed to the Prometheus remote write endpoint!\r
\r\r\r
Easy smart gardening with Prometheus
\r
\r
\r
\r
\rIn this article, you learned how to build a smart gardening solution with Prometheus that helps you assure their moisture, temperature, and light levels are OK. Now you can relax while you see them grow strong and healthy!\r
\r\r\r\r
Start gardening now with Sysdig
\r
\rIf you want to try this right now, you can sign-up for a Sysdig Monitor free trial to start using Sysdig's managed Prometheus platform, and its Prometheus remote write endpoint!\r
\r
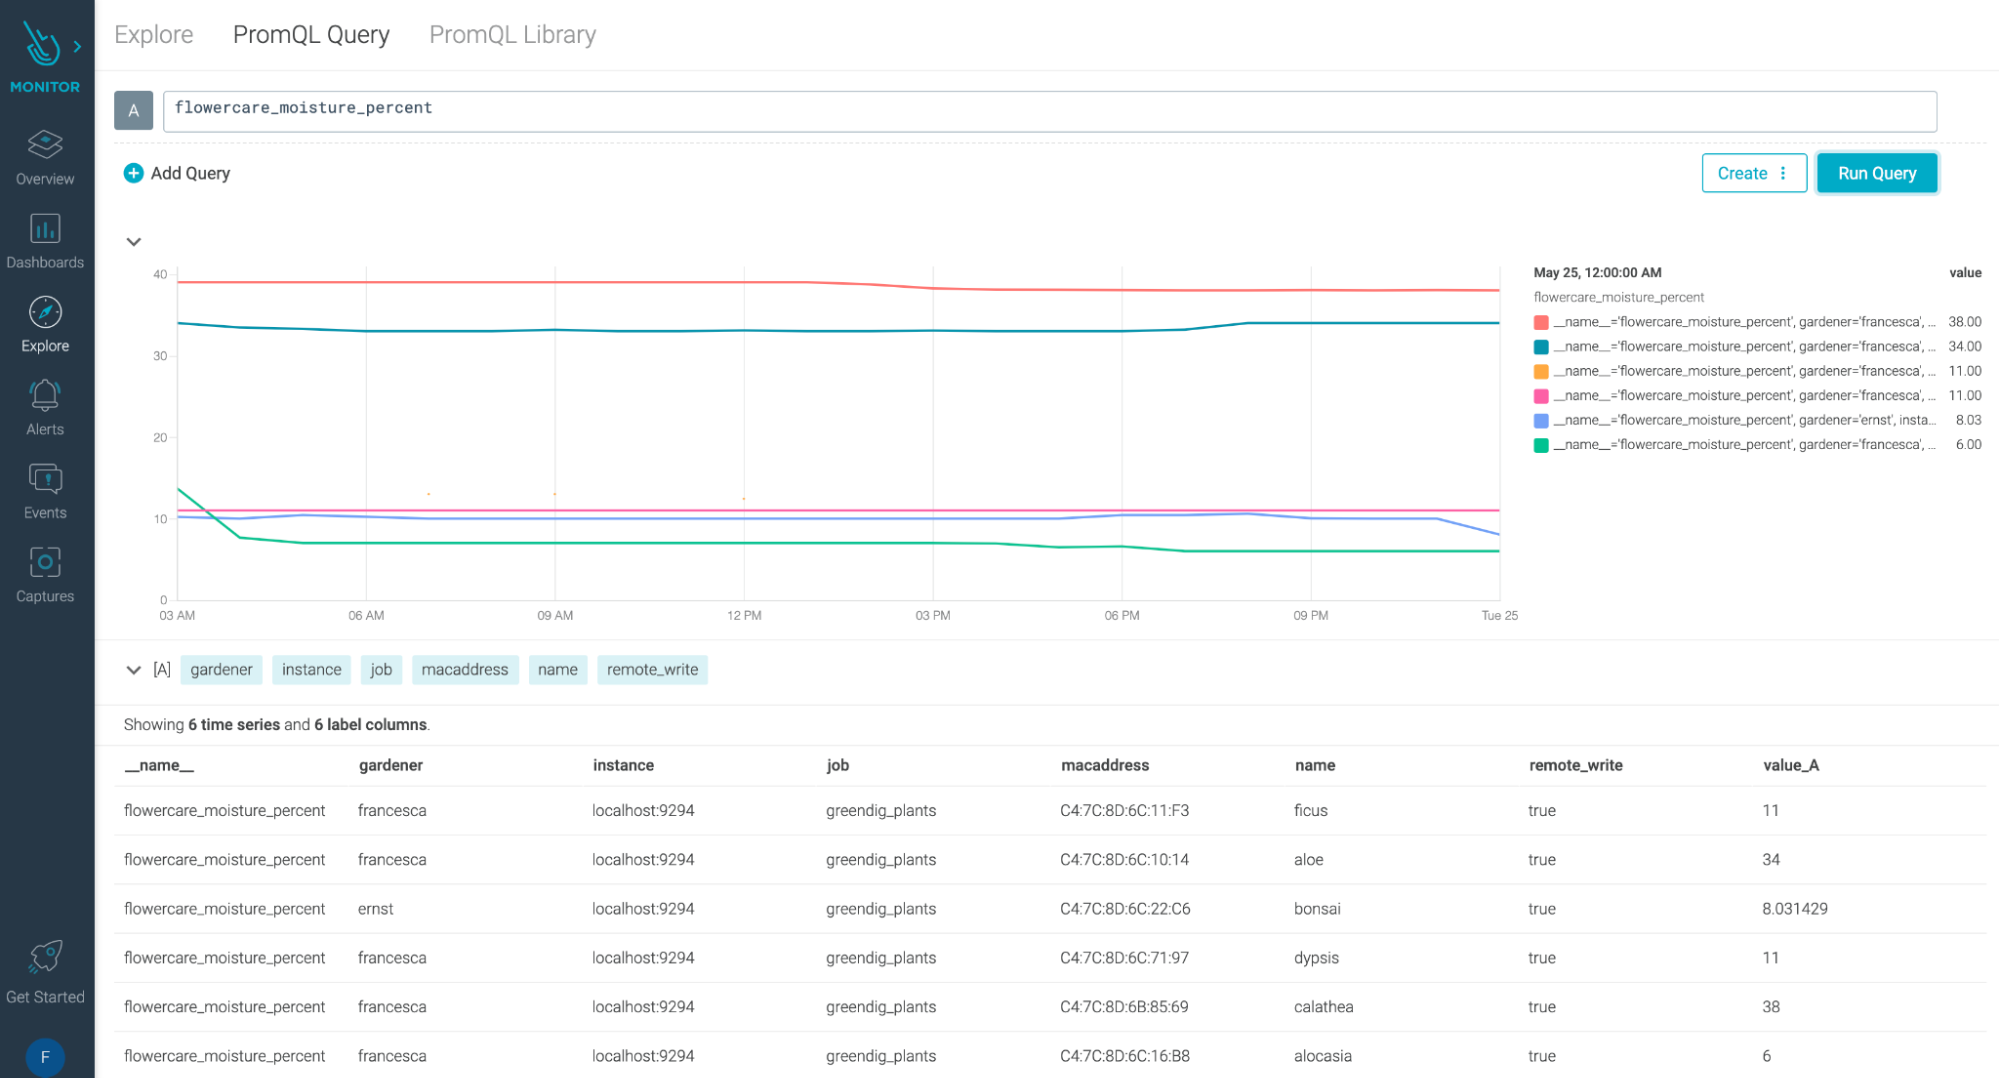
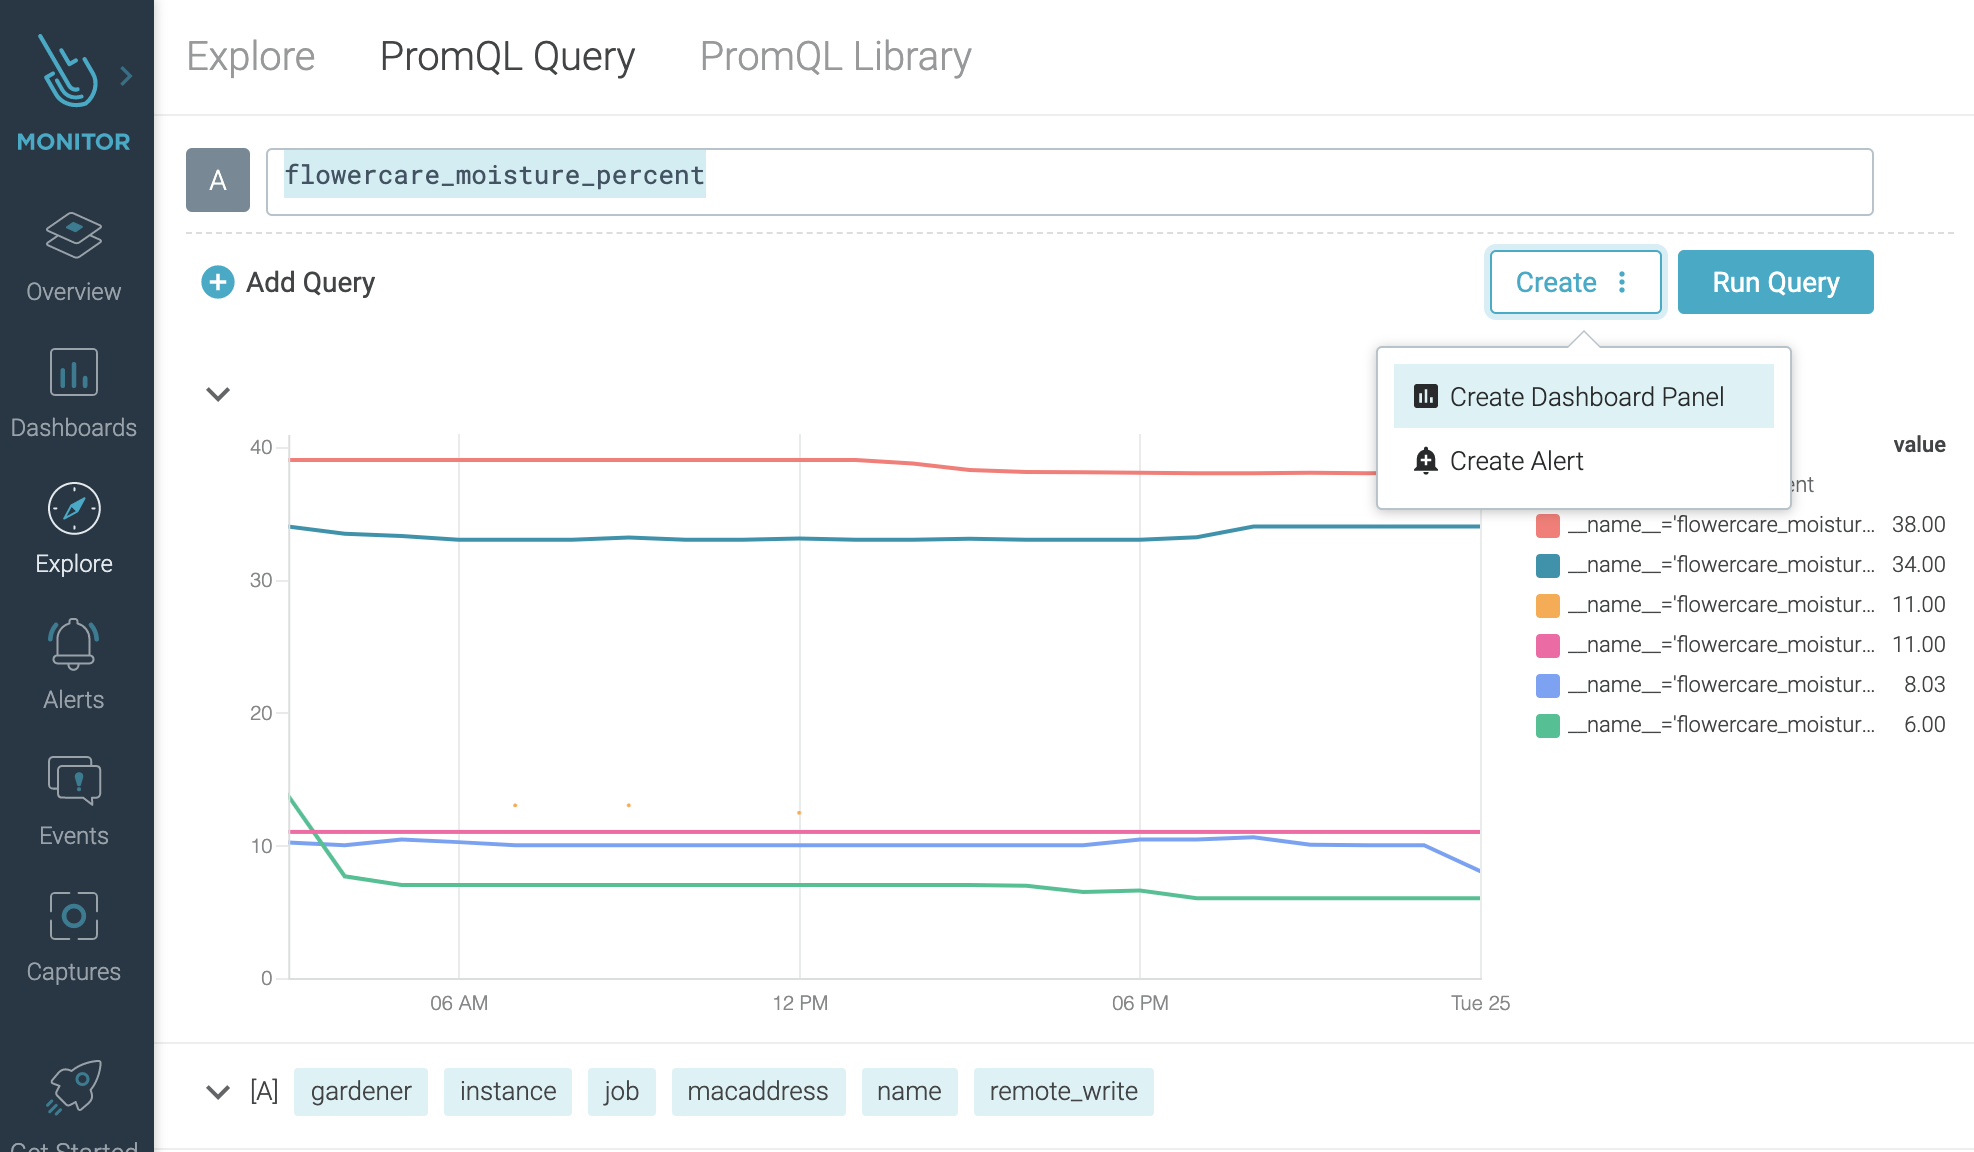
\rOnce you configured your Raspi to send metrics to Sysdig's Prometheus Remote write endpoint, you can log into Sysdig and see how your metrics look in PromQL Explore. You can also be able to filter them by all of the available labels; For example, you can identify your plants by filtering by 'gardener,' which is a custom label you previously set in the prometheus.yml.
Let's see if your plants' moisture level is OK. You just need to query:\r
\r
\rflowercare_moisture_percent\r
\r\r
\r… to have a detailed trend for every plant and see all of the available labels:\r
\r\r\r
\r
\r
\r
\r
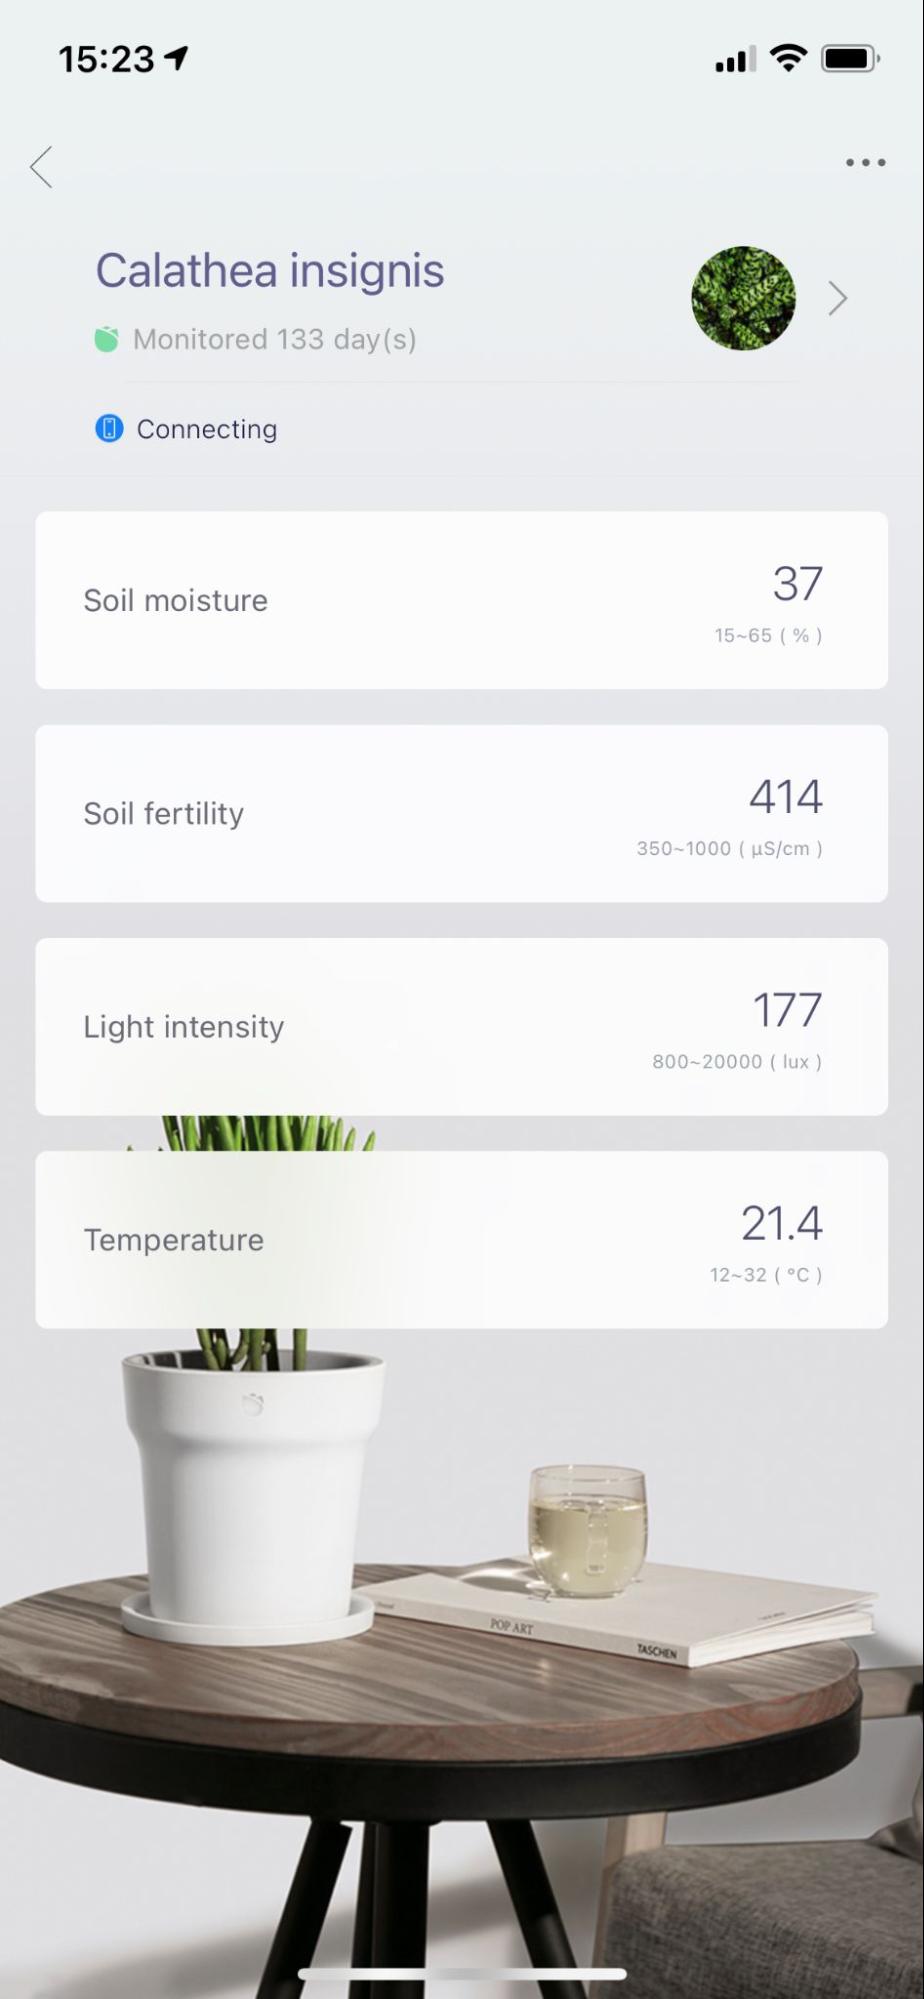
How do you know if our moisture, light, and temperature values are OK?\r
\r
\r
\r
\r
\rThe sensors' app provides indications for that. It's easy to identify the correct values for every metric specifying the plant type. These values will be the guide when setting up our alerts for the plants.\r
\r\r\r
Set up your Dashboard
\r
\rIn Sysdig, you can create a Dashboard to keep an eye on your plants and monitor them daily. If you're familiar with PromQL, you can directly create a Dashboard from PromQL Explore:\r
\r
\r
\r
\r
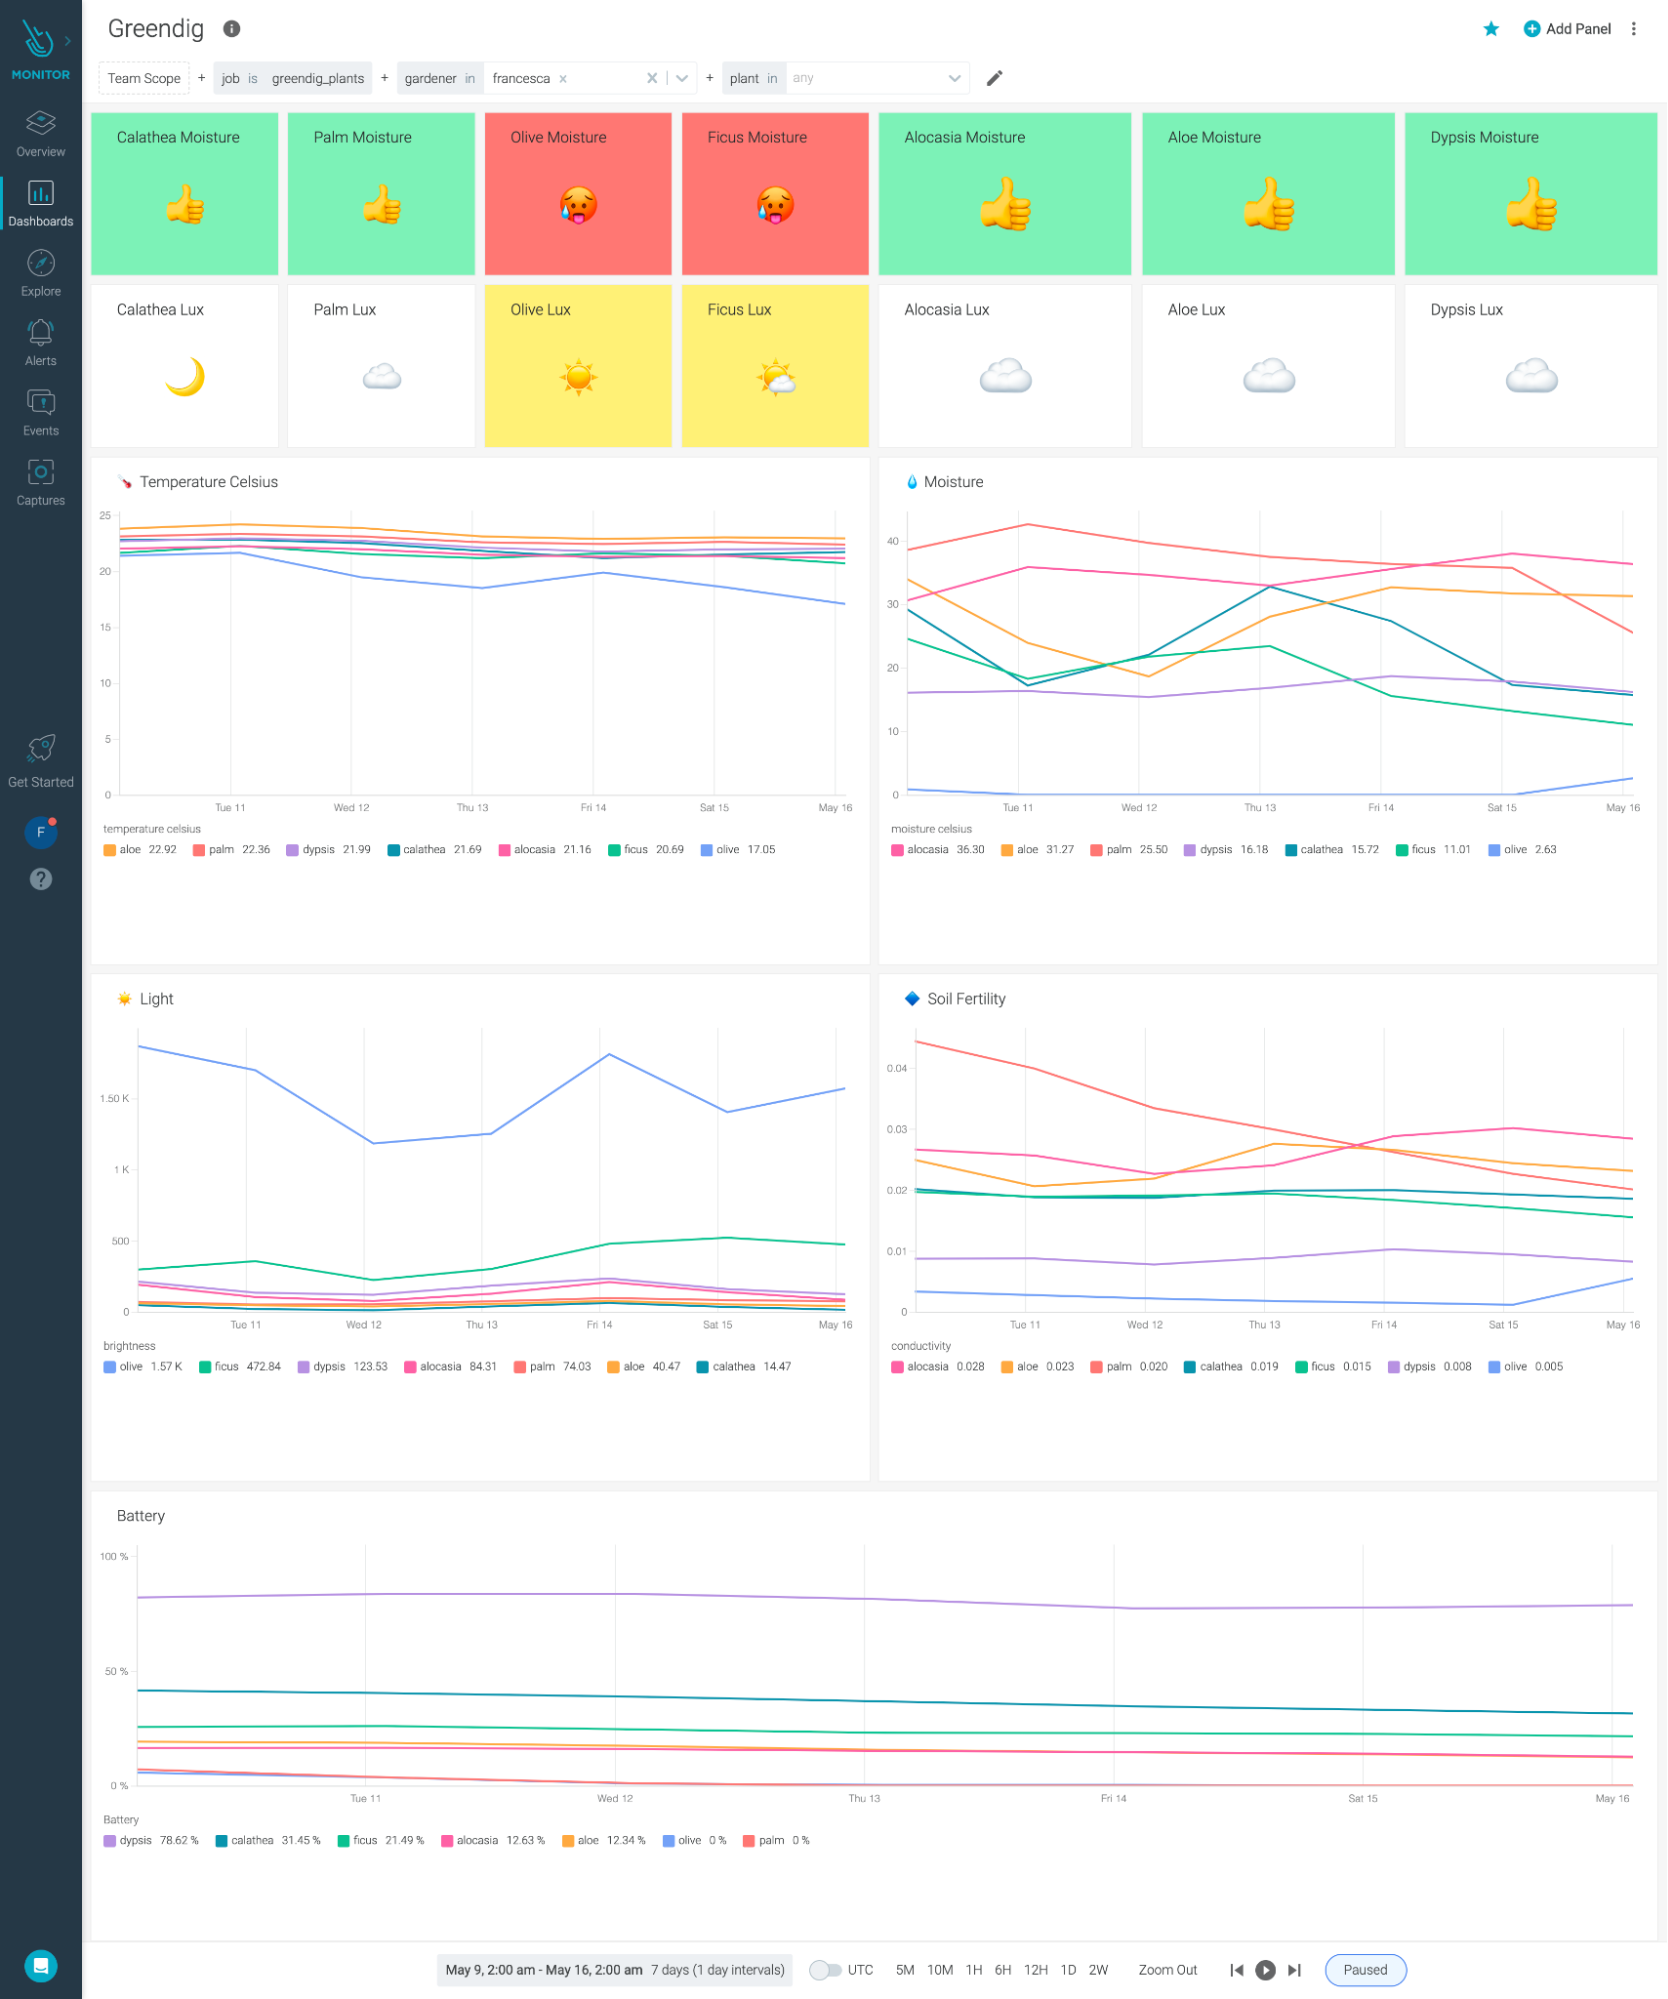
\rAlternatively, you can also create a new Dashboard directly from the Dashboard feature by using the Sysdig interface.\r
\r
\r
Here's an example of a Dashboard you could create:
\r
\r\r\r
\r
\r
\r
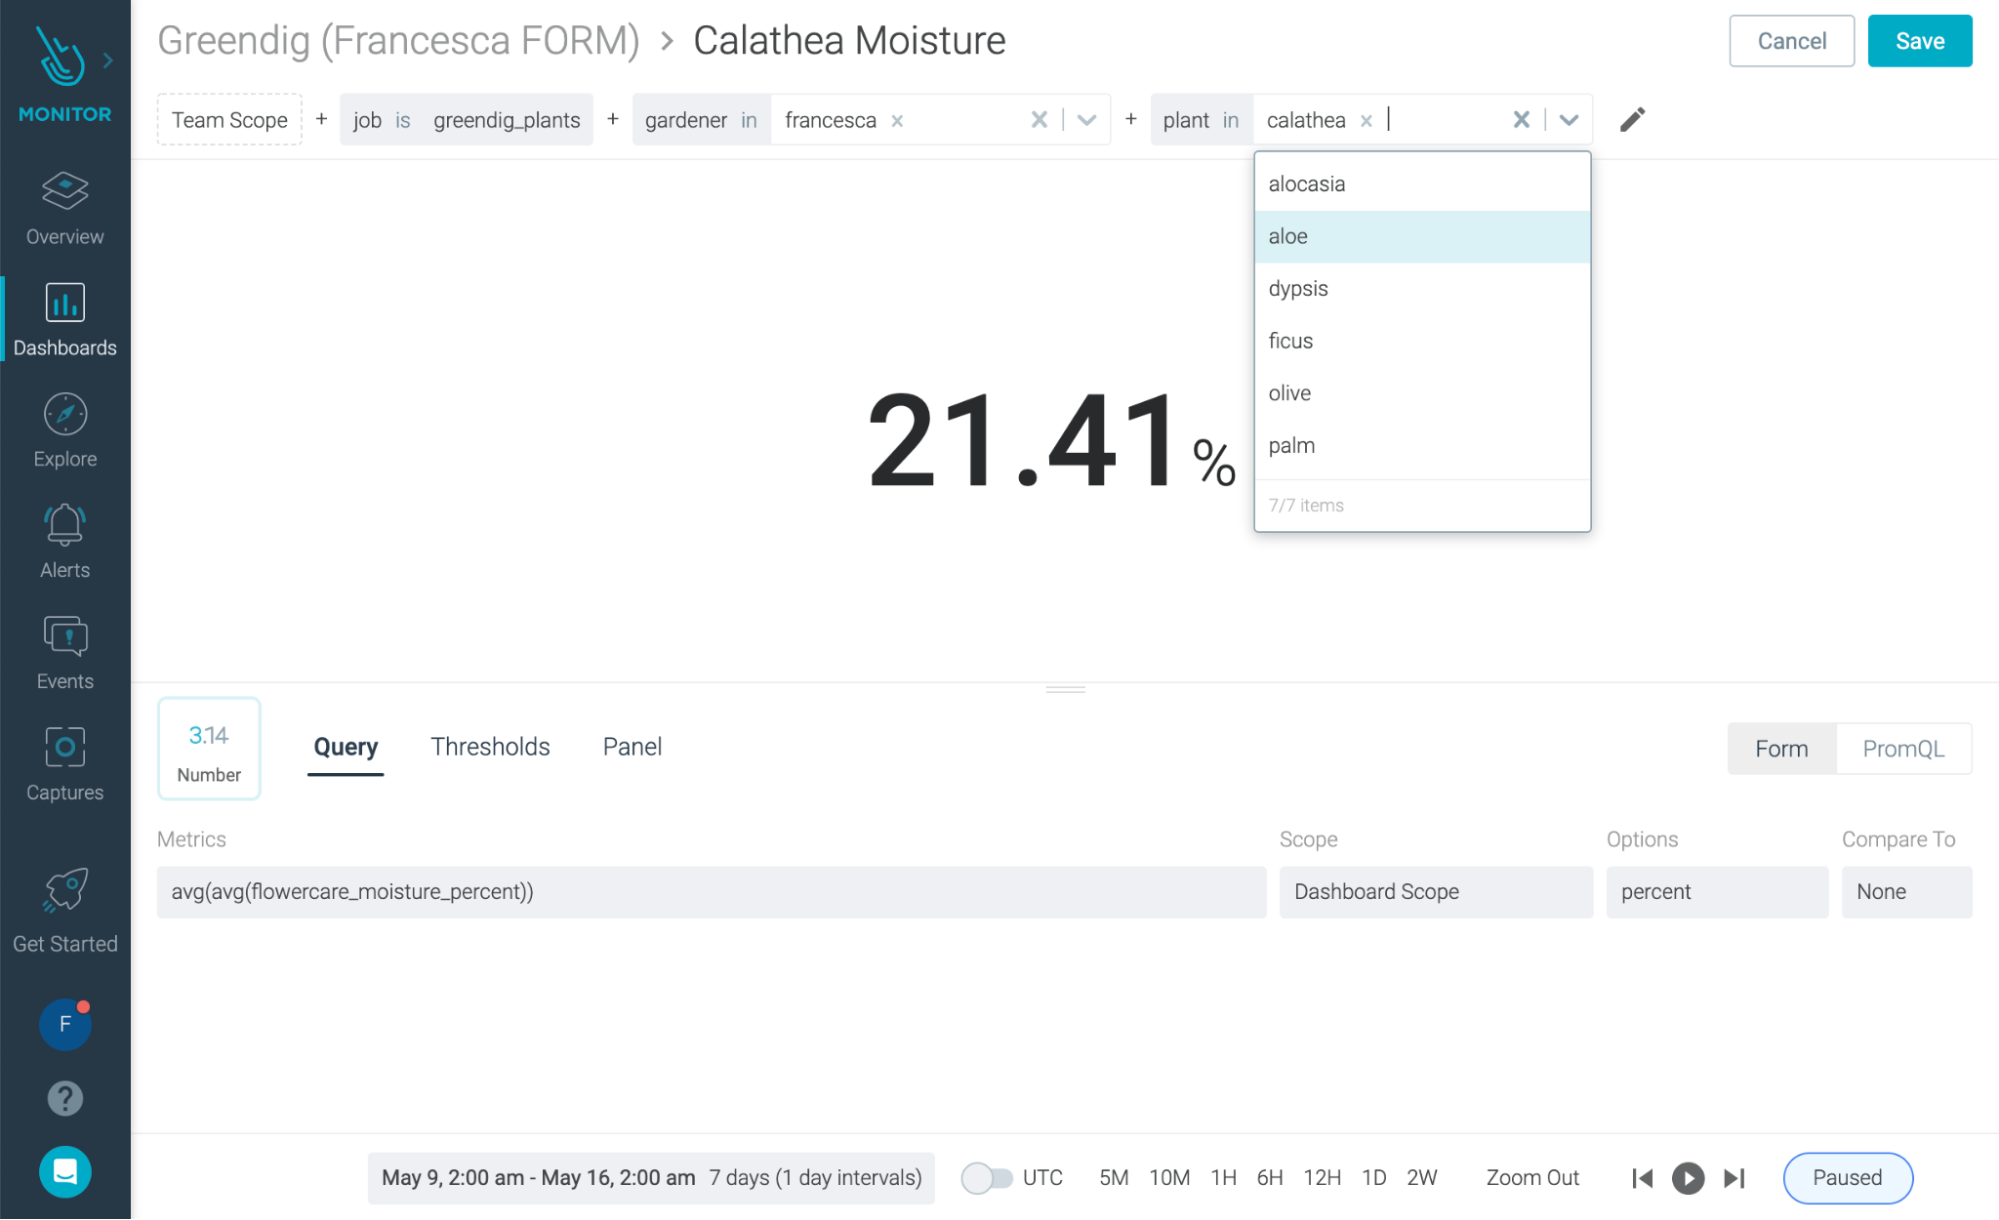
\rLet's set up a panel to check the moisture levels for a specific plant. Here's how you do it:\r
\r
\rCreate a new Number Panel and first configure the query, using the metric\r
\r
\rflowercare_moisture_percent\r
\r
\r… and then scope it to a specific plant:\r
\r
\r
\r
\r
\r
\rAs you can see, the query will inherit the Dashboard Scope and display the value for that plant.\r
\r
\rIf you are setting a Dashboard shared with friends or family and you want to filter it to only see your plants, you can use the 'gardener' filter, which is a custom label you configured in the prometheus.yml.\r
\r
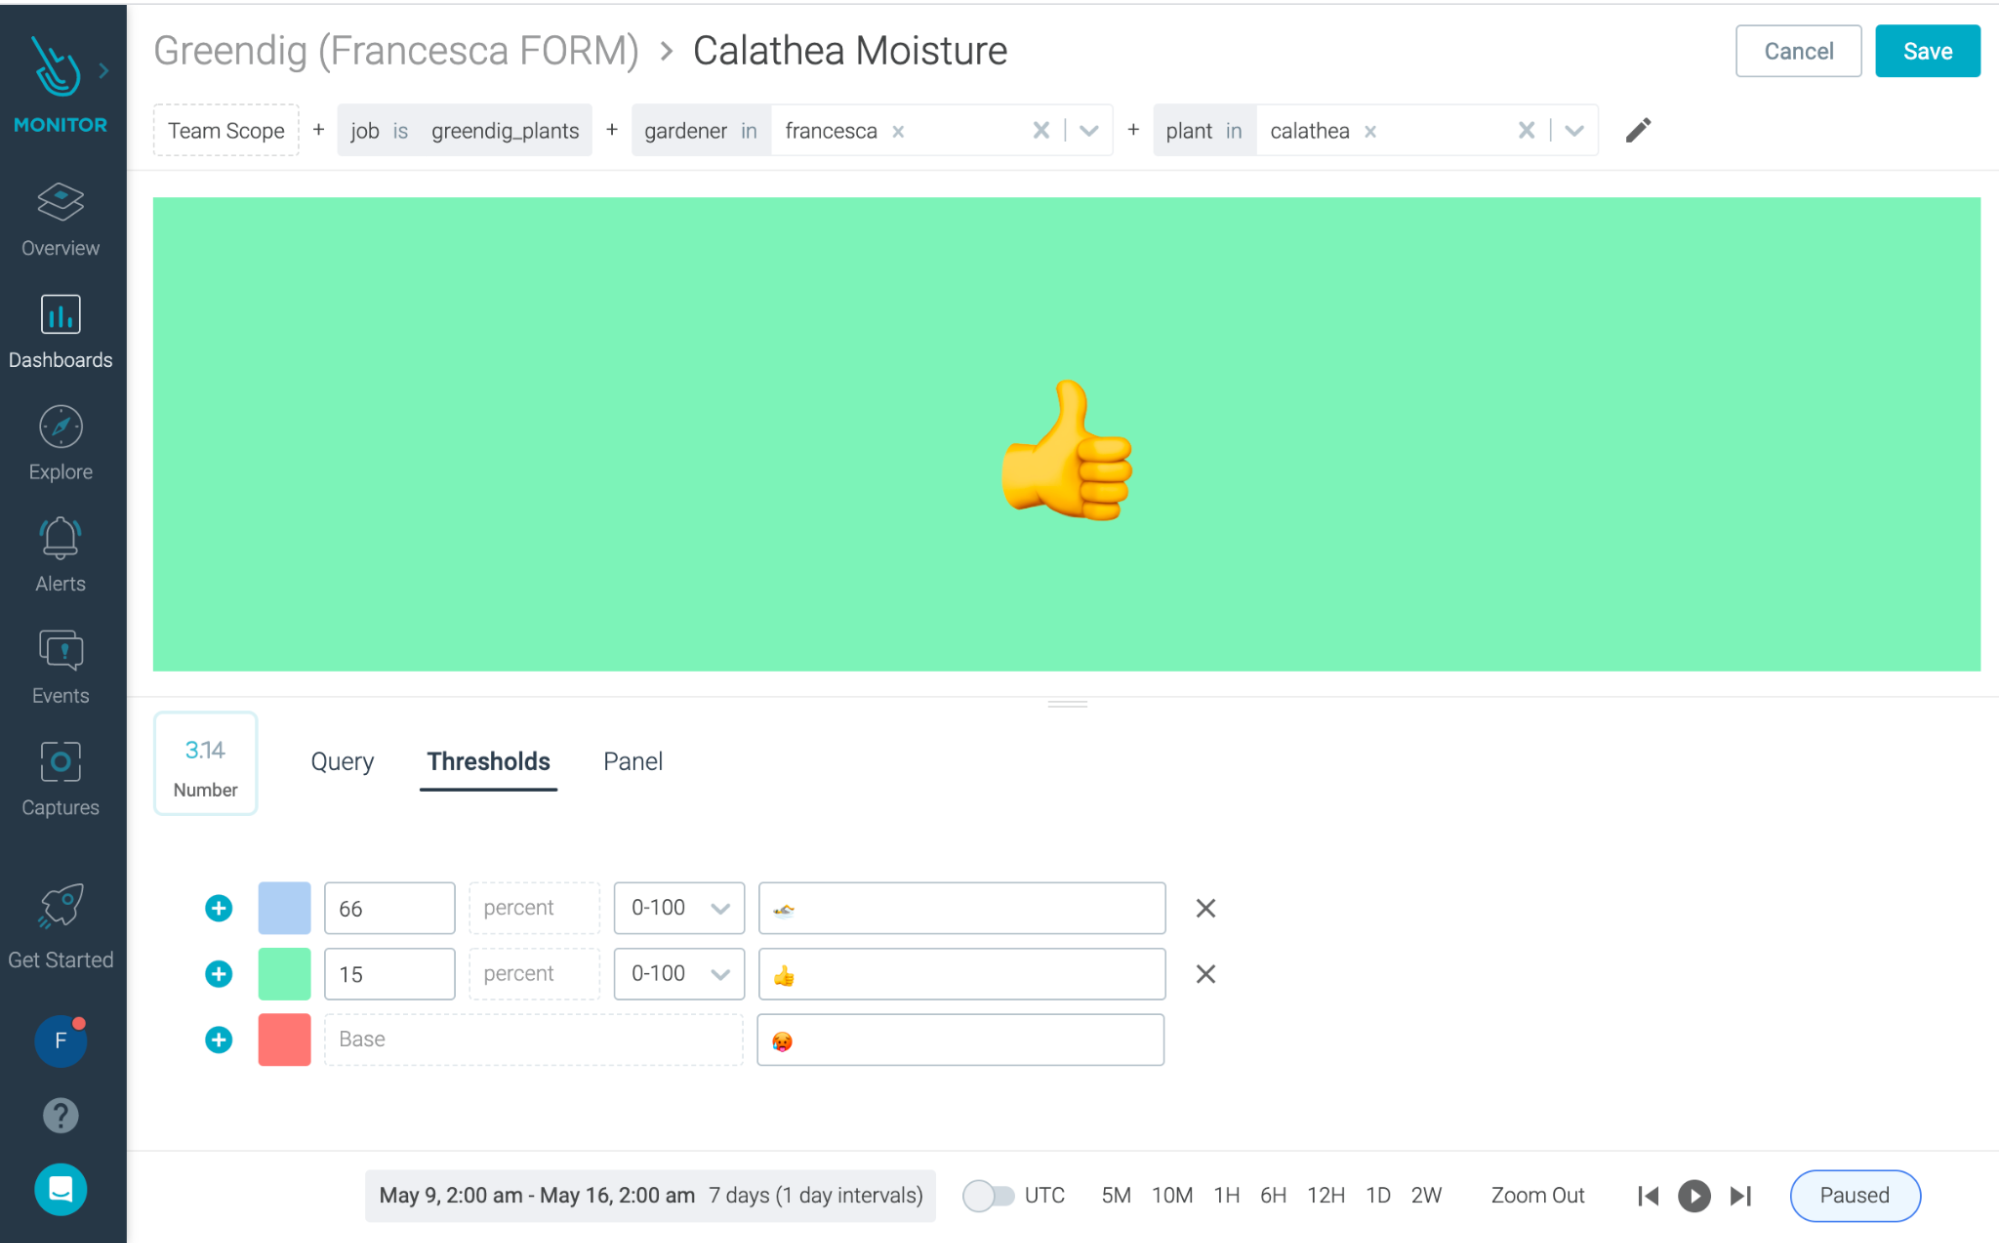
\rAs a last step, you must set the Thresholds to have visual guidance for when you need to water our plant:
\r
\r
\r
\r
\rThese values are the ones you'll find in the app, which work well as a guidance.
In this case, our moisture levels are OK, and the panel will display the appropriate color (and emoji!).\r
\r\r\r
Give a voice to your plants
\r
\rLast but not least, you can be notified when your plants need attention by configuring alerts. You can configure your alerts using PromQL or the Sysdig UI:\r
\r
\r
\r
\r
\r
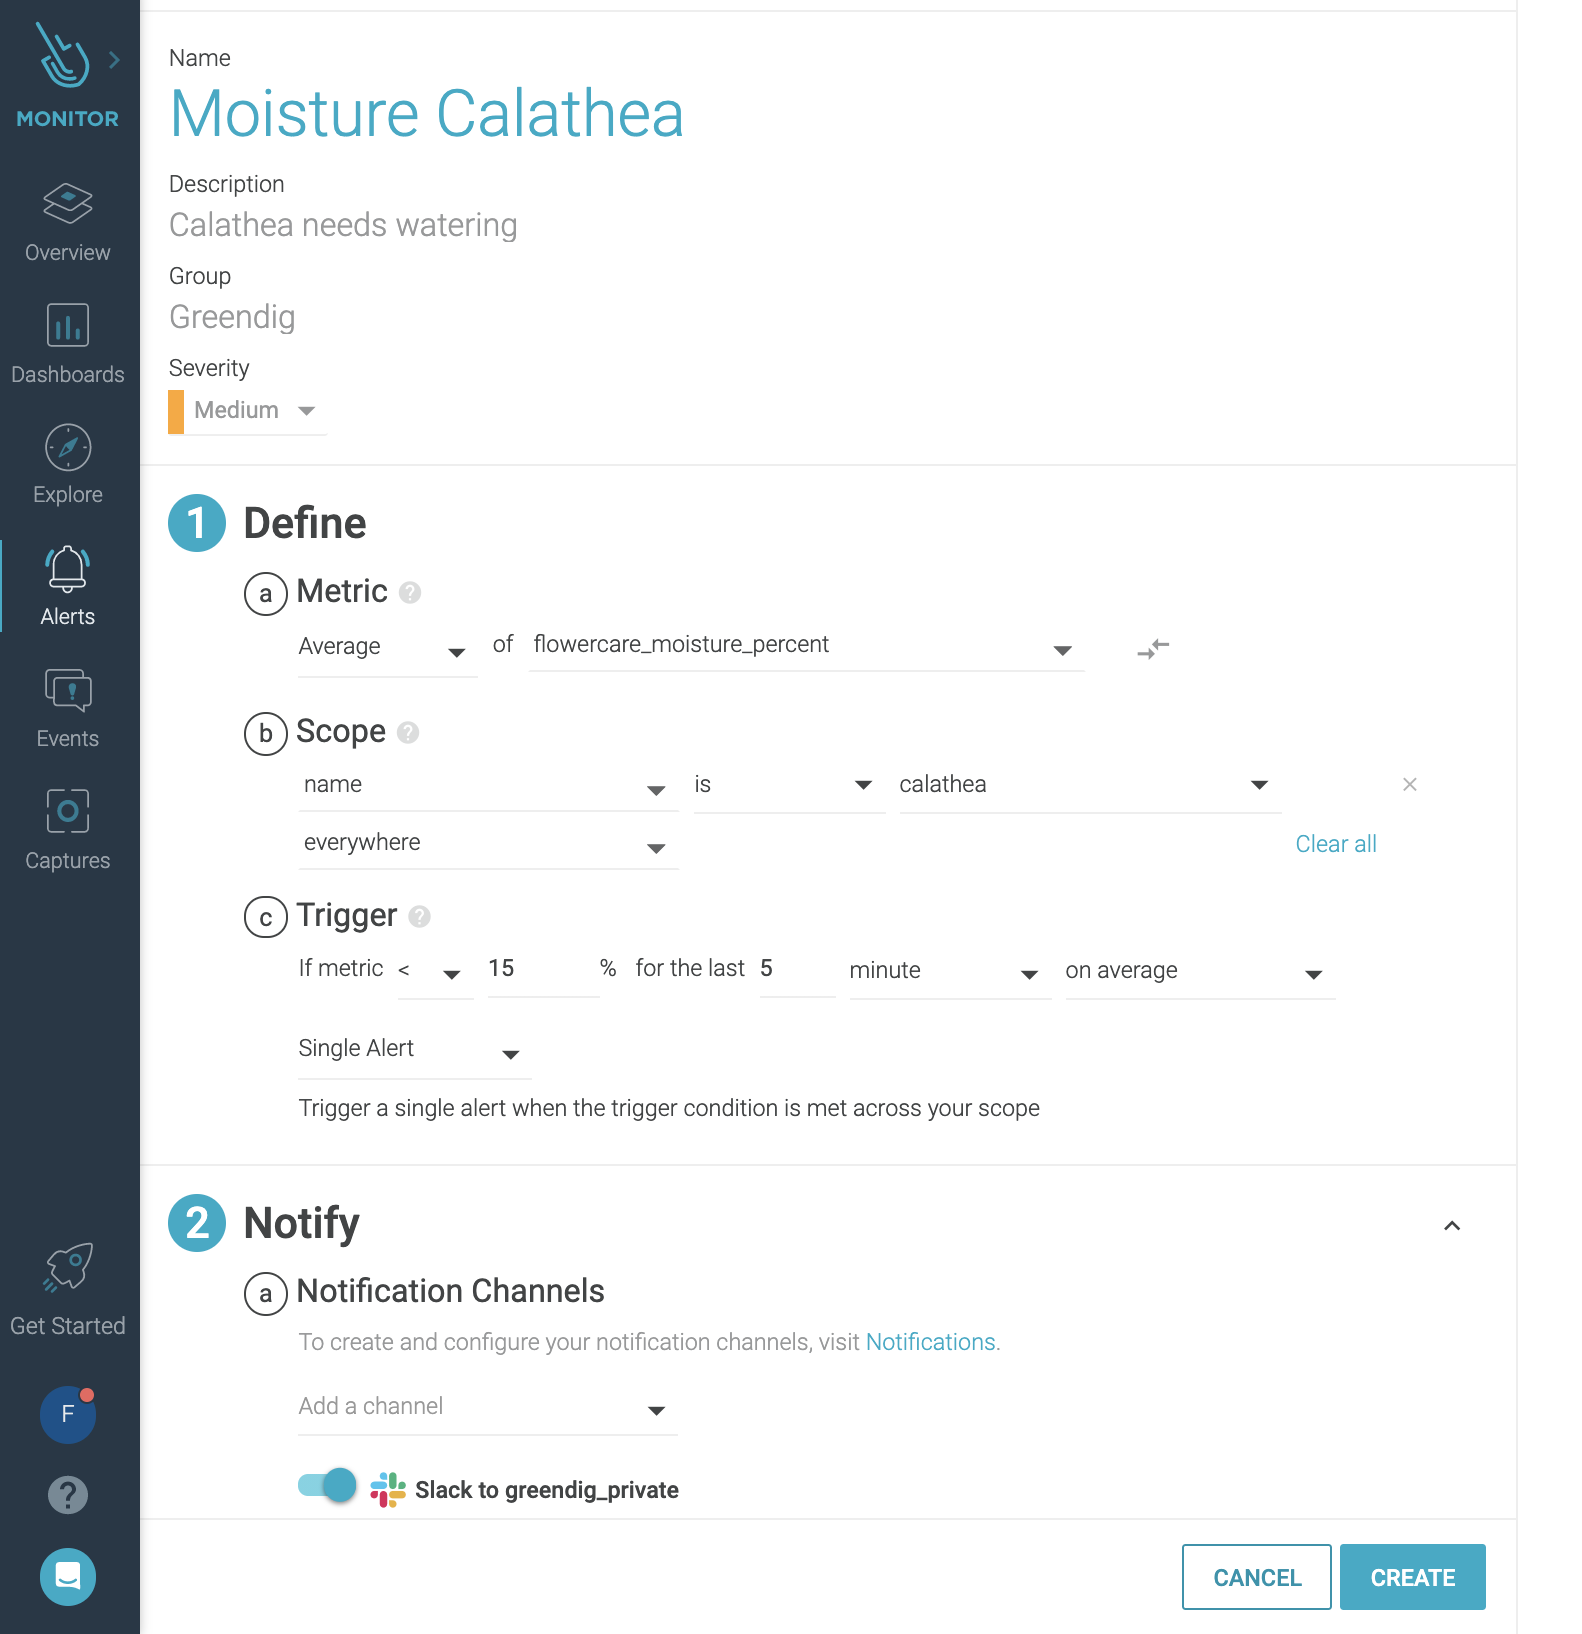
\rAgain, all you need to do is set the metric you want to be notified for (in this case, moisture), eventually, scope it to a specific plant, and configure the trigger.\r
\r
\rFinally, configure how you want to be notified (there are multiple channels available such as email, Slack, etc.).\r
\r
\rVoilà! With Dashboards and Alerts, now you're all set and you'll be able to monitor your plants as they grow strong and happy.\r
\r