


Falco Feeds extends the power of Falco by giving open source-focused companies access to expert-written rules that are continuously updated as new threats are discovered.

At Sysdig we've recently undergone a pretty interesting shift in our core instrumentation technology, adapting our agent to take advantage of eBPF – a core part of the Linux kernel. Sysdig now supports eBPF as an alternative to our Sysdig kernel module-based architecture. Today we are excited to share more details about our integration and the inner workings of eBPF. To celebrate this exciting technology we're publishing a series of articles entirely dedicated to eBPF.
In this blog we'll start with a high level overview of eBPF, followed by a description of the new eBPF-based Sysdig architecture and how it fits in the eBPF ecosystem of tracing and security tools. In our next blog, we'll do a deep dive into the eBPF technology and show how to program eBPF from a low level point of view.
An introduction to eBPF
To start, what is eBPF? Extended Berkeley Packet Filter (eBPF) is a modern and powerful technology used in the Linux kernel for a wide variety of applications, including networking and tracing. At its core, eBPF allows a user (in some cases privileged) to inject near general-purpose code in the kernel. Such code will then be executed at some point in time, usually after certain events of interest happen in the kernel. These events typically relate (but aren't limited) to networking and tracing.
We won't spend too much time describing eBPF itself. It is a fairly popular technology and as such there is already a wealth of information and documentation that is easily found. Here are a few examples that are very good starting points:
Here we'll just focus on providing you with enough details on the eBPF architecture to make the narration smooth. We encourage you to deep dive into the excellent material available online for a more thorough understanding.
eBPF purpose
As mentioned above, the ultimate goal of eBPF is to allow the execution of user code in the kernel. This in theory sounds pretty similar to what the kernel traditionally offers to users for extending its features, that is, loadable kernel modules. Loadable kernel modules consist of compiled general purpose C code loaded at run time inside the kernel via the insmod/modprobe commands. The code of a kernel module usually hooks into various kernel subsystems so that it gets automatically called upon the occurrence of certain events. This has been useful for developers who want to implement support for new hardware devices or tracing functions, for example.
This analogy with eBPF couldn't be farther from the truth! A big advantage of eBPF is that, unlike a kernel module, it will only run code that has been deemed completely safe to run. Specifically, this means that it will never lead to a kernel crash or kernel instability. This is one of the biggest selling points for eBPF. It's also something currently difficult to achieve with other technologies without giving up some serious flexibility.
Writing eBPF programs
In order to achieve its safety guarantee, eBPF is essentially implemented as a process virtual machine in the kernel. This virtual machine runs safe programs on behalf of the user. eBPF exposes to the user a virtual processor, with a custom set of RISC-like instructions that are relatively simple to understand and deal with. It also provides a set of virtual CPU registers, and a stack memory area. As a result, developers can design and write programs in eBPF bytecode to run in this virtual environment and pass the programs to the virtual machine. The eBPF framework will start executing these programs only after verifying that they are safe from an execution point of view. Verification checks include making sure that a given eBPF program cannot enter in a infinite loop, cannot access invalid memory, and other key invariants.
It's very important to note that a developer is not necessarily required to create eBPF bytecode from scratch when writing a new program. The eBPF developers actually implemented an eBPF back end for LLVM (Low-Level Virtual Machine), meaning that Clang can be used to compile a subset of standard C code in an eBPF object file, which is then loaded inside the kernel for verification and further use. While the C to eBPF translation is not without significant caveats, it makes it relatively easy to write new instrumentation code in a familiar programming language such as C. It also massively expands the use cases of eBPF.
If this all sounds too abstract, don't worry, in the next part of the series we'll dig much deeper into the fundamentals of writing an eBPF program. You'll get a front row seat into how all the components mentioned above interact and work in practice, including how the program safety verification is done.
eBPF architecture
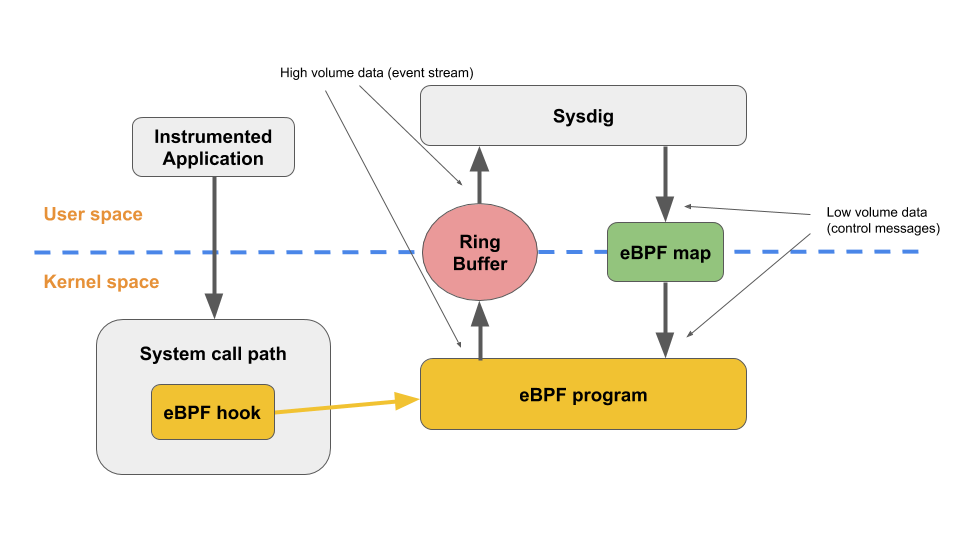
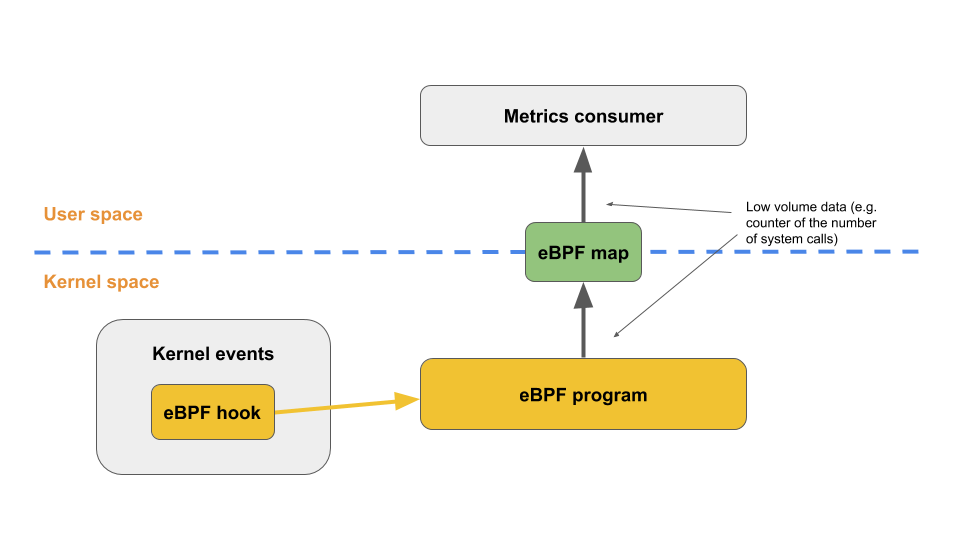
What makes eBPF very interesting is that these programs can be run at various points of execution in the kernel by attaching them to static tracepoints, dynamic Kernel and User probes, and many other hooking points. When an attached eBPF program executes, it receives as input some relevant data coming from the kernel itself. For example, if attached to a system call execution via a system call tracepoint, it receives the system call arguments passed by the user space process invoking the system call to the kernel. The program can use this input to actively mutate the state of the system. This is typical for networking use cases to filter a network packet, for example. Or, it can passively compute a set of metrics – typical for tracing use cases. In the latter case, these metrics can then be sent to user space using data structures called "eBPF maps". eBPF maps are more or less generic key/value data structures which are shared between user space and kernel and allow low-throughput data flow.
In the vast majority of eBPF tracing use cases, eBPF programs get attached to a very busy (in terms of frequency) execution point in the kernel (e.g. transmission of a network packet or system call execution) to calculate numeric statistics like the number of network packets transmitted or number of executed system calls by type. These are placed in a map so that user applications driving the tracing process can fetch them at their own pace.
This is what the typical architecture of an eBPF instrumentation pipeline looks like:
In order to guarantee good performance on the kernel side, the RISC instruction set of an eBPF program is simple enough that it can be relatively easily translated into native machine code via a JIT step embedded inside the kernel. This means that right after the verification of the safety of the program, the runtime will not actually suffer the performance overhead of having to execute the eBPF bytecode via the virtual machine. It will just execute straight native machine code, significantly improving the performance.
"Sysdig and Falco are now powered by #eBPF for #Kubernetes #monitoring and #security"
Sysdig, Falco and eBPF
Now that we've briefly described what eBPF is and how it works, it's time to see how it fits into the Sysdig architecture, and what were the motivations behind this recent eBPF adoption initiative.
Sysdig instrumentation history
Open source sysdig, which hopefully most readers of this article will be already familiar with, is a high-performance system call tracer. It features very extensive user space support for stateful filters, containers and Lua scripting. People in the community love it. It's very easy to use and rather powerful. Sysdig put a lot of effort into making it container friendly, which is something quite original in the troubleshooting ecosystem.
We started developing the sysdig open source tool in 2013 at a time when eBPF was not yet released. Back then, all the available native instrumentation technologies in the kernel were either too slow (e.g. ptrace/auditd) or too limited in features (e.g. Kprobe-based event tracers used by perf, which didn't allow the ability to dereference arbitrarily complex structures and severely limited the ability to introduce custom logic in the instrumentation phase). For this reason, our first implementation consisted of system call instrumentation via a device driver implemented as an external kernel module. The Sysdig kernel module intercepts system calls using static tracepoints (raw syscalls/sysenter and rawsyscalls/sysexit specifically). It then pushes data to user space via a very simple and fast per-cpU ring buffer that we wrote from scratch.
Most of the Sysdig intelligence is then implemented in user space. Each system call goes through a state machine that attaches a context (e.g. process metadata, container and orchestrator metadata, file/connection metadata, ..) to each individual event. This context can then be used for filtering and scripting in a semantically rich way. For example, just by intercepting an isolated write(), Sysdig is able to tell which file/network connection, process and Docker container that write() refers to (compare that to strace).
We can see in the diagram below where the kernel instrumentation fits in the overall Sysdig architecture:
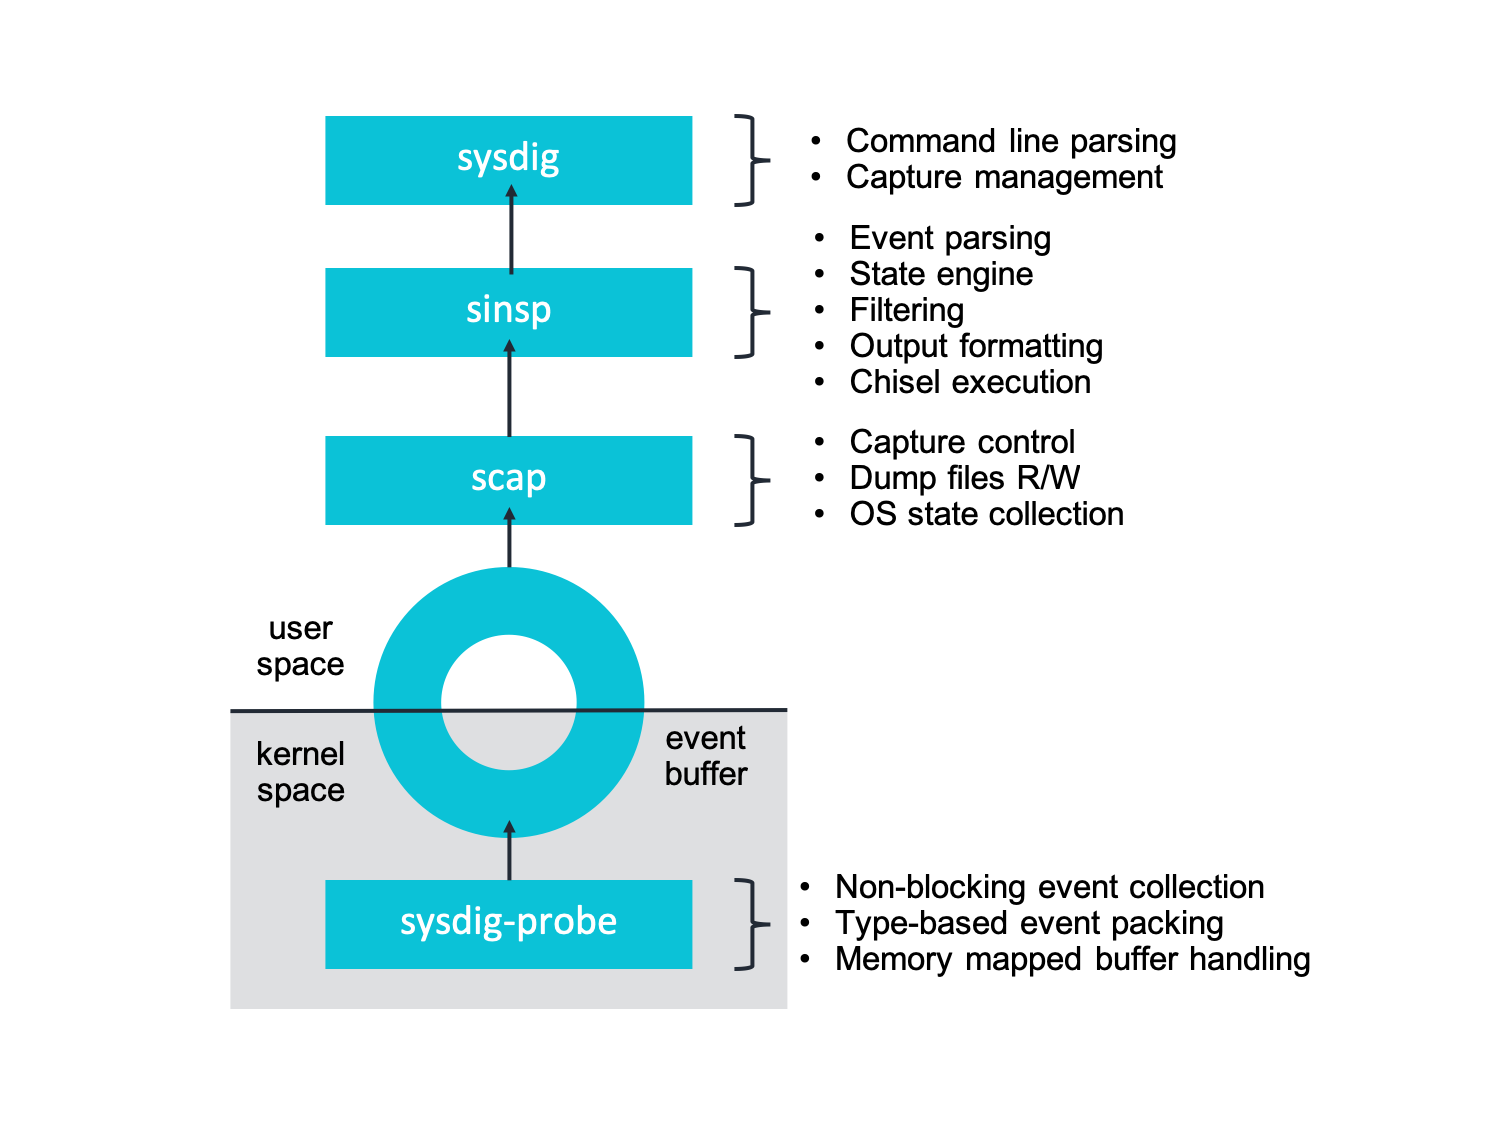
If you want to learn more, you can read further details about our kernel instrumentation on our blog.
Kernel module instrumentation questions
We certainly can't say our kernel module implementation choice was wrong. It is widely used in production 24/7 by thousands of machines and users. In fact, it's the base for other tools and solutions in the Sysdig ecosystem such as the popular CNCF security tool project, Falco, as well as Sysdig Monitor and Sysdig Secure.
However, six years is a long time. During this period, as containers became more mainstream and more operations teams and service providers moved towards cloud native architectures, we received a lot of questions and feedback from users:
- Stability: Once loaded, a kernel module runs unrestricted and as part of the kernel itself. Could a bug potentially cause a system failure?
- Security: For the same reason, since a kernel module runs in privileged processor mode with direct access to all the critical data structures in the kernel – could a security bug potentially be exploited by a malicious user to cause a denial of service or a privilege escalation?
- Compatibility: In an attempt to increase security, some modern and container-oriented Linux distributions prevent loading kernel modules without a proper digital signature. Some disallow kernel modules completely. How will Sysdig be able to effectively support deployment on immutable infrastructure like Google Cloud Platform's COS and Project Atomic Host?
Towards eBPF instrumentation
The above questions started becoming important enough that we decided to take another look at the instrumentation technologies available today. After doing a deep dive into eBPF with some experiments, we felt that eBPF technology was a good fit. We chose to work towards porting our system call instrumentation to a series of eBPF programs. At the same time, our goal was to keep our higher level abstractions as untouched as possible (scap and above in the previous diagram).
Our eBPF work started in 2017 around Linux kernel version 4.11. Initially, we faced some challenges due to the limitations of the eBPF virtual machine at that time. We decided to help improve it and were able to upstream most of our work back into Linux. The patches we implemented include the ability to natively deal with strings in eBPF programs, the ability to dereference arbitrary memory whose size is not known at compile time from eBPF programs (both essential to properly deal with system call arguments), and more. In the next part of the series, we'll do some hands-on work on eBPF programs and the scope of those patches will be further explained and become naturally clear.
The final implementation turned out to be a substantial collection of eBPF programs that make heavy use of the eBPF tracing support in the kernel. Sysdig now fits nicely in the eBPF ecosystem as a complement to other tools. It holds the position of a container-aware high performance system call tracer, useful for general purpose troubleshooting.
Another benefit that automatically comes from adopting eBPF is the possibility for Sysdig to further leverage other nice eBPF tracing features. For example, it's relatively easy to attach eBPF programs to particular execution points in a user space application using User probes. This enables some very interesting troubleshooting/security auditing use cases. We already have some in the development pipeline that we can't wait to share! In addition, we're able to use native helper capabilities in eBPF programs to capture stack traces of running processes to augment the typical system call event stream in Sysdig. This gives users even more troubleshooting information.
Sysdig eBPF architecture
The architecture of Sysdig with eBPF looks like this:
The core of the implementation is a collection of custom eBPF programs responsible for the instrumentation. These programs, as described earlier, are written in a subset of the C programming language. They are compiled using recent versions of Clang and LLVM, which translate the high level C code into the eBPF bytecode. There is one eBPF program for every different execution point where Sysdig instruments the kernel. Currently, Sysdig attaches eBPF programs to the following static tracepoints:
- System call entry path
- System call exit path
- Process context switch
- Process termination
- Minor and major page faults
- Process signal delivery
In the future, these execution points can and will be expanded, especially for security auditing use cases.
As mentioned earlier, each program takes in input the execution point-specific data (e.g. for system calls, arguments passed by the calling process) and starts processing them. The processing depends on the type of system call. For simple system calls, the arguments are just copied verbatim into an eBPF map used for temporary storage until the entire event frame is formed. For other more complicated calls, the eBPF programs include the logic to translate or augment the arguments. This enables the Sysdig application in user space to fully leverage the data. Some of this additional data includes:
- Data associated to a network connection (e.g. TCP/UDP IPv4/IPv6 tuple, UNIX socket names, …).
- Highly granular metrics about the process (memory counters, page faults, socket queue length, …).
- Container-specific data, such as the cgroups the process issuing the system call belongs to, as well as the namespaces that process lives in.
As we'll see in the next part of the series, some of this information is not trivial to get from eBPF code due to the restrictive nature of what an eBPF program can do.
Once an eBPF program captures all the needed data for a specific system call, it uses a special native BPF function to push the data to a set of per-CPU ring buffers that the Sysdig user space application can read at a very high throughput. This is where the usage of eBPF in Sysdig differs from the typical paradigm of using eBPF maps to share "small data" produced in kernel space with user space. This places the load of heavy aggregation on the eBPF side.
In the Sysdig architecture, eBPF maps are minimally used for sharing purposes with user space. All of the data flows through the scalable ring buffer, which has been tuned for our specific use case. This allows Sysdig to export a very high volume of data from kernel to user space with minimal overhead. We then are able to reconstruct the state of the system in the Sysdig process memory, which is what ultimately powers the powerful filtering and chisel machine.
From the performance point of view, the results are good! Below you can see how the instrumentation overhead of the eBPF instrumentation of Sysdig is only marginally greater than our "classic" kernel module instrumentation:
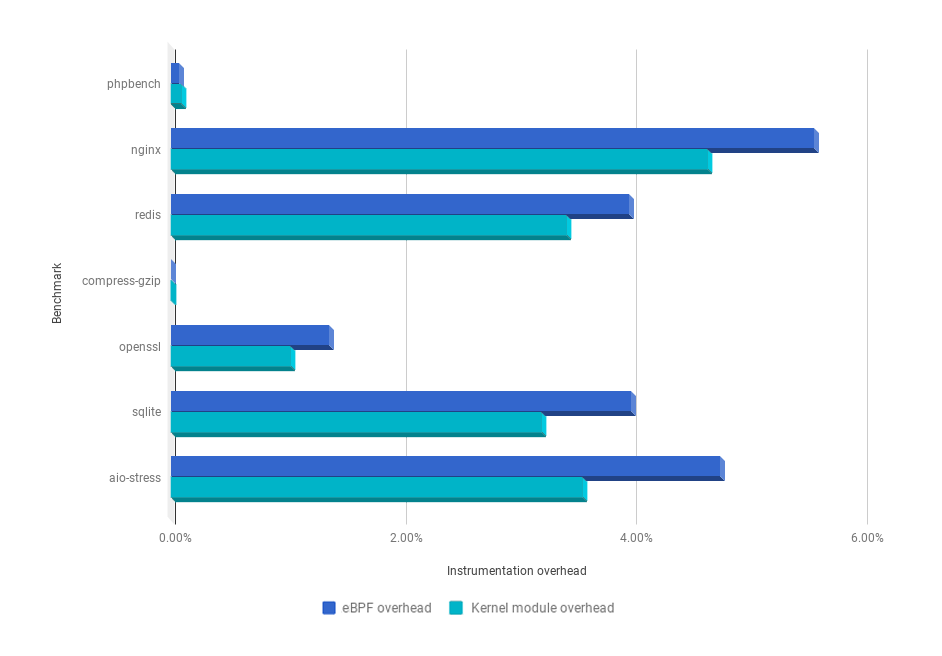
These numbers are pretty minimal when compared to other system call tracers such as strace. If the overhead is still not tolerable, it's absolutely possible to tweak Sysdig to consume even less by doing more aggressive filtering directly on the kernel side.
Usage
The usage of Sysdig with eBPF instrumentation is, by design, uneventful and almost transparent. The entire goal of the project was to enable users to swap the underlying instrumentation source without altering the user interface in any way. This means that users running on a recent Linux kernel (4.14+) with eBPF support can just run the standard Sysdig container specifying the SYSDIG_BPF_PROBE environment variable on the command line and the instrumentation will automatically switch to eBPF, as shown from the following example:
More details, including exact kernel version requirements, useful for developers and advanced users wanting to understand what's going on under the hood, are available on our eBPF documentation page.
The same exact workflow can be used for Falco and the Sysdig Monitor and Sysdig Secure agent. Just start the respective container passing in the SYSDIG_BPF_PROBE environment variable. You then have a fully featured instance of the specific Sysdig product running purely on the eBPF instrumentation as opposed to the kernel module!
eBPF ecosystem
Considering the popularity of eBPF, it's worth comparing Sysdig with the rest of the tools in the eBPF ecosystem. A full comparison is not possible since new eBPF-based tools and frameworks are being introduced at a very fast pace. We can at least compare it to two of the biggest and most popular eBPF projects when it comes to tracing. These are:
bcc is essentially a framework for writing eBPF programs. It abstracts away a good chunk of the complexity of dealing with eBPF itself. In particular, bcc simplifies compiling an eBPF program from C using LLVM as well as the actual mechanics of loading an eBPF program into the kernel and attaching it to the interested subsystem. On top of that, bcc also provides the ability to write eBPF programs in Python and Lua as opposed to C. Even more, bcc provides nice object-oriented bindings when working with maps.
For this reason, bcc is a good choice when writing moderately complex eBPF programs. By default, the framework ships dozens of small eBPF programs that can be used for one-off troubleshooting use cases. This is a comprehensive diagram of such tools:
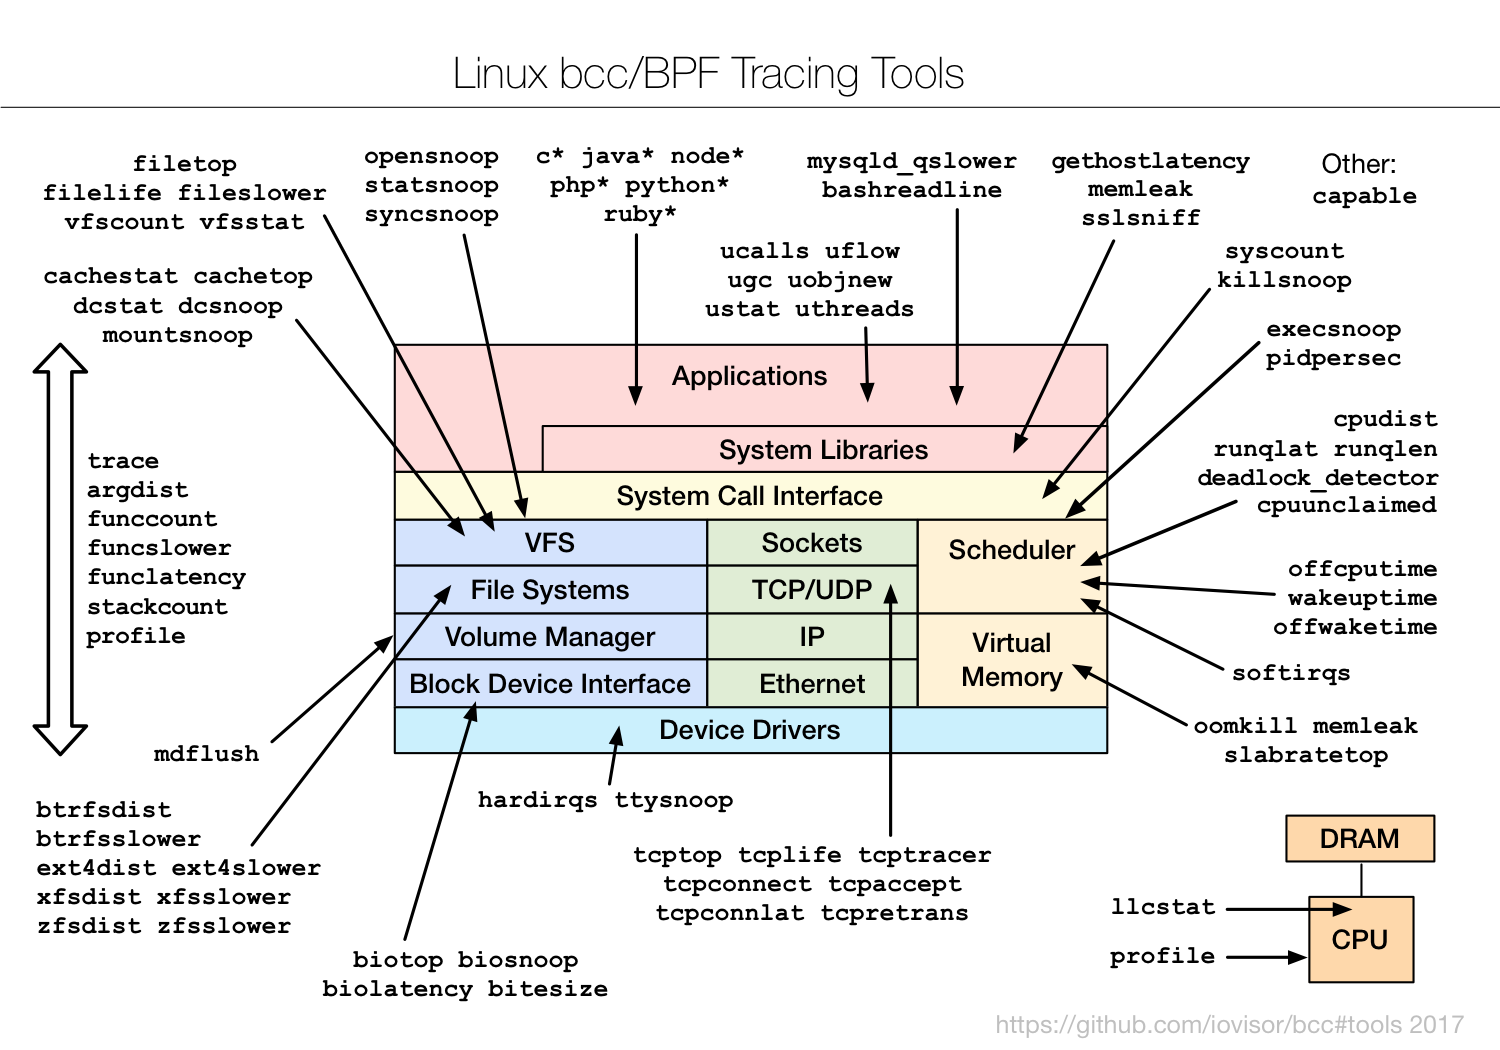
By contrast, Sysdig specializes in the system call interface (yellow box). Our eBPF support augments many of the system calls with additional metadata including container information. What's more, it offers a nice set of features such as the ability to save data into rich trace files, powerful stateful filters, and easy chisel scripting.
One of the problems with bcc is that writing eBPF programs can still be significantly complicated despite the Python and Lua bindings. The user needs to keep in mind a lot of assumptions about the way eBPF programs work – especially their limits, as we'll see later. A newer tool, bpftrace, was created to simplify this situation. bpftrace sits on top of bcc. Instead of requiring users to write their own programs against the bcc API, it offers a more expressive higher level syntax. The syntax is very similar to the one of the popular tracing framework DTrace. This makes it effective to do advanced tracing via relatively simple one-liners.
We believe all of these tools fit well in a system troubleshooting toolbox. We have seen users typically start troubleshooting with a general purpose system call tracer tool such as Sysdig because in many scenarios it gives enough data and features to successfully resolve a problem. If the issue needs deeper investigation, you can then use a combination of bpftrace one-liners and bcc scripts – or write new ones to troubleshoot a very specific kernel subsystem or user space behavior.
As of the time of this posting, we're not aware of any other eBPF-based system call tracer with as many features as Sysdig. We're thrilled to complete and share this work with the community.
Outside of the specific troubleshooting use cases, Falco, our donated project in the CNCF sandbox, now can use eBPF. Falco is the only major security and behavioral activity monitoring tool for containers currently powered by eBPF in the Linux, container, and Kubernetes ecosystem.
From a commercial-offering point of view, Sysdig is one of the first few companies shipping eBPF tracing capabilities in full-featured container monitoring and container security solutions for microservices. Customers can now adopt Sysdig Monitor and Sysdig Secure fully powered by eBPF.
Conclusions
This concludes the first part of this eBPF series. In it we've taken a high level look at eBPF and the new Sysdig architecture. As mentioned earlier, this barely scratches the surface of what there is to know about this fascinating technology.
In the second part of this series, we will go deeper into what it means to write eBPF programs and illustrate some of the bumps (and successes) along the way.