
Falco Feeds extends the power of Falco by giving open source-focused companies access to expert-written rules that are continuously updated as new threats are discovered.

We at Sysdig were happy to see IBM's launch of their new container service. A very stable and well managed cluster environment for your apps and containers powered by IBM is a big step forward for both Kubernetes and the Cloud. And, in our humble opinion, pairing Bluemix up with a cornerstone container intelligence tool like Sysdig is a match made in Devops heaven.This blog was easy to write as it took 3 steps to get up and running with Bluemix's excellent deployment and management cli tools along with the Sysdig Monitor daemonset deployment.
- Deploy your Cluster. Great tutorial here.
- Deploy Sysdig: Sign up for a free trial on our website, then deploy our daemonset.
- Prosper!
For context, Sysdig is the container monitoring company. We're based on the open source Linux troubleshooting project by the same name. The open source project allows you to see every single system call down to process, arguments, payload, and connection on a single host. The commercial offering turns all this data into thousands of metrics for every container and host, aggregates it all, and gives you dashboarding, alerting, and an htop-like exploration environment.Before we dive into the how of using Bluemix and Sysdig, let's talk about the particular challenges of monitoring containers. IBM #Bluemix and #Sysdig, a match made in DevOps heaven. Get full container visibility in 3 straightforward steps. Click to tweet
Containers radically change monitoring
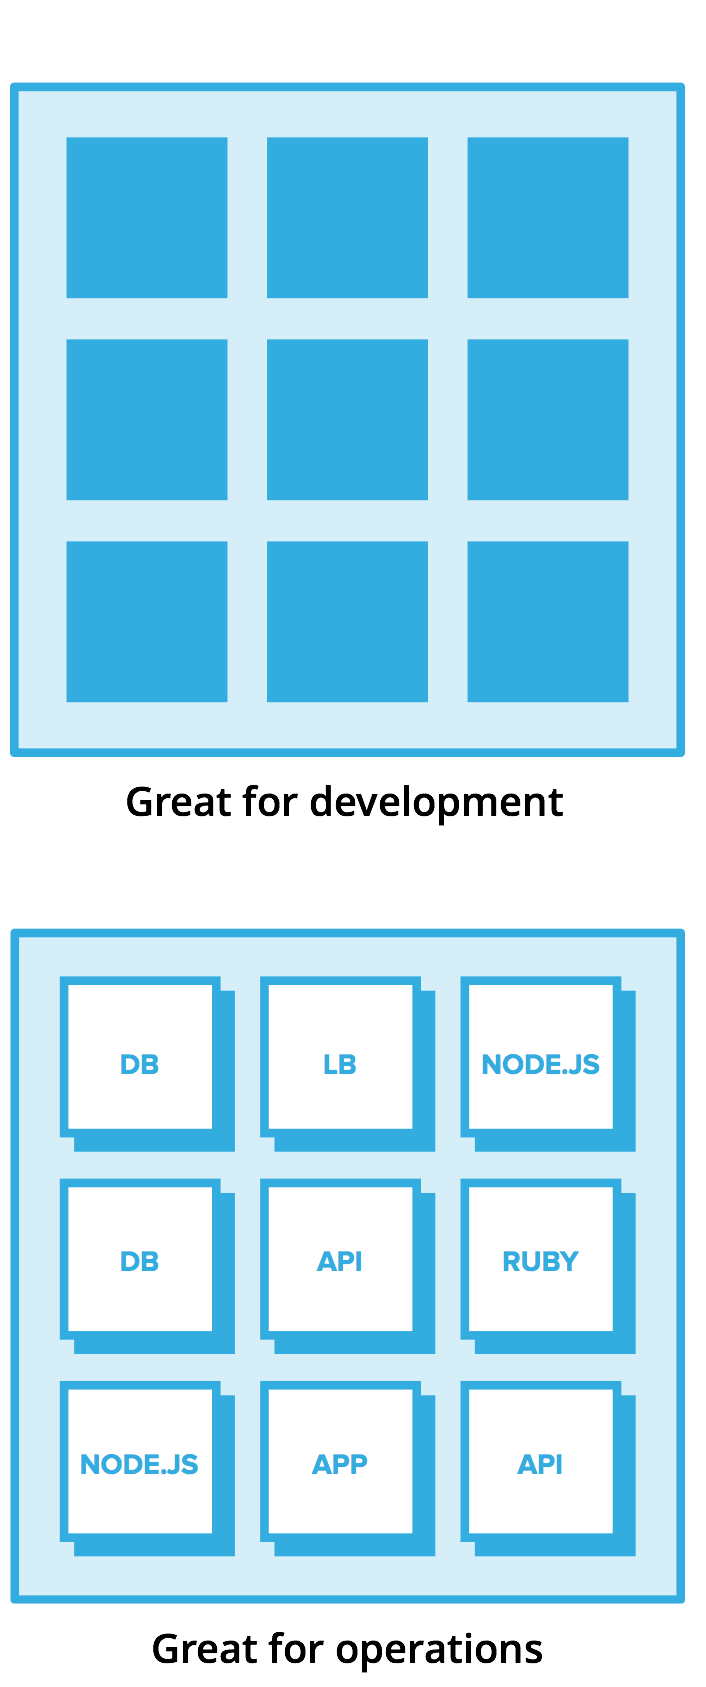
Containers are pretty powerful. They are :
- Simple – typically an individual process
- Small – 1/10th of the size of a VM means they're portable
- Isolated – They have few dependencies
- Dynamic – Rapid startup times means they can be scaled, killed, and moved quickly
Keeping containers simple is core to their value proposition and what makes them a great building block for microservices. But this simplicity comes at a cost. From an ops perspective, you need deep visibility inside containers rather than just knowing that some containers exist.Your containers are also likey managed by an orchestration system (think Bluemix backed by Kubernetes), and your developers may be pushing new applications at any time, without informing the ops team.Alright, so now we know we're dealing with these small black boxes that appear, die, and are moved at the whims of your orchestration system. Your developers have the freedom to add and modify their applications freely. And your job is to make sure that your company's apps are running properly, not to mention have the data to solve issues when they might arise.Now let's solve these monitoring challenges using Bluemix and Sysdig!
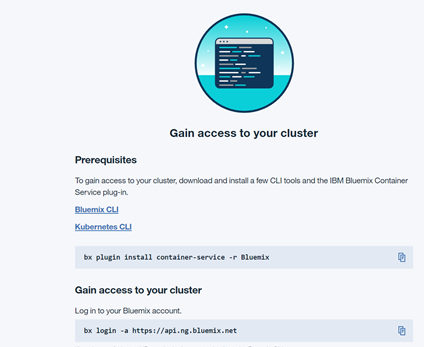
Prerequisites
To gain access to your cluster, download and install a few CLI tools and the IBM Bluemix Container Service plug-in.Bluemix CLIKubernetes CLI
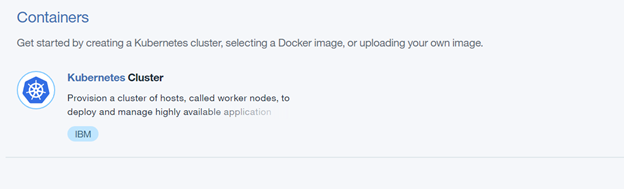
- Deploy your IBM Bluemix Container Service via the excellent UI Bluemix provides
- We install the Bluemix cli plugin. In this example i am using the windows CLI. Install instructions here.
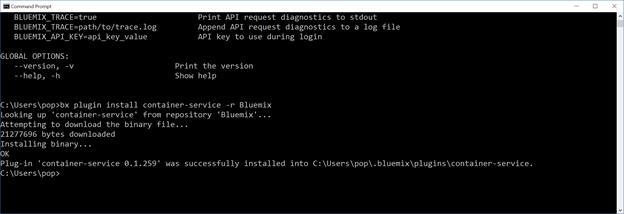
- We access our cluster, here are directions on how to connect:
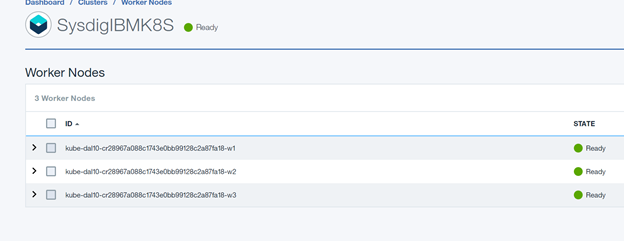
After about 5-10 minutes we have a fully functional Bluemix Kubernetes Cluster:
Sysdig Installation with DaemonSet (Look Ma no hands!)
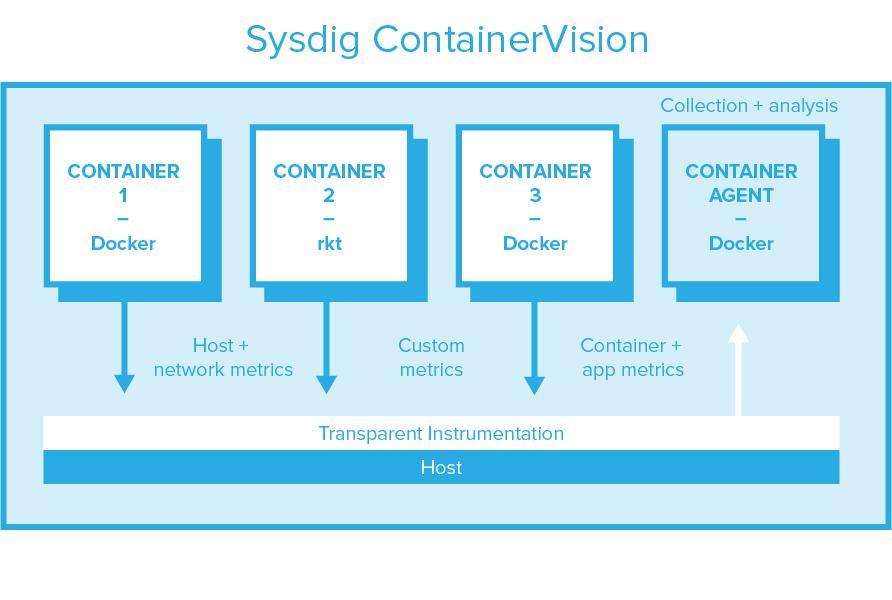
Before deploying Sysdig, it's worth a moment to describe our instrumentation approach because it's so different from other container monitoring approaches out there. We have developed a transparent, per-host instrumentation model that doesn't require developers to modify code, doesn't involve adding a container per pod, and certainly doesn't involve adding a process to every single container!This transparent instrumentation – we call it ContainerVision – captures all application, container, statsd, and host metrics with a single instrumentation point, leveraging the tracepoints facility in the kernel, and sends it to a container per host for processing & transfer. This eliminates the need to turn everything into a statsd metric, which is something we've seen many people resort to. Unlike per-pod sidecar models, per-host agents drastically reduce resource consumption of monitoring agents, and require no modification to application code. It does, however, require a privileged container and a kernel module.
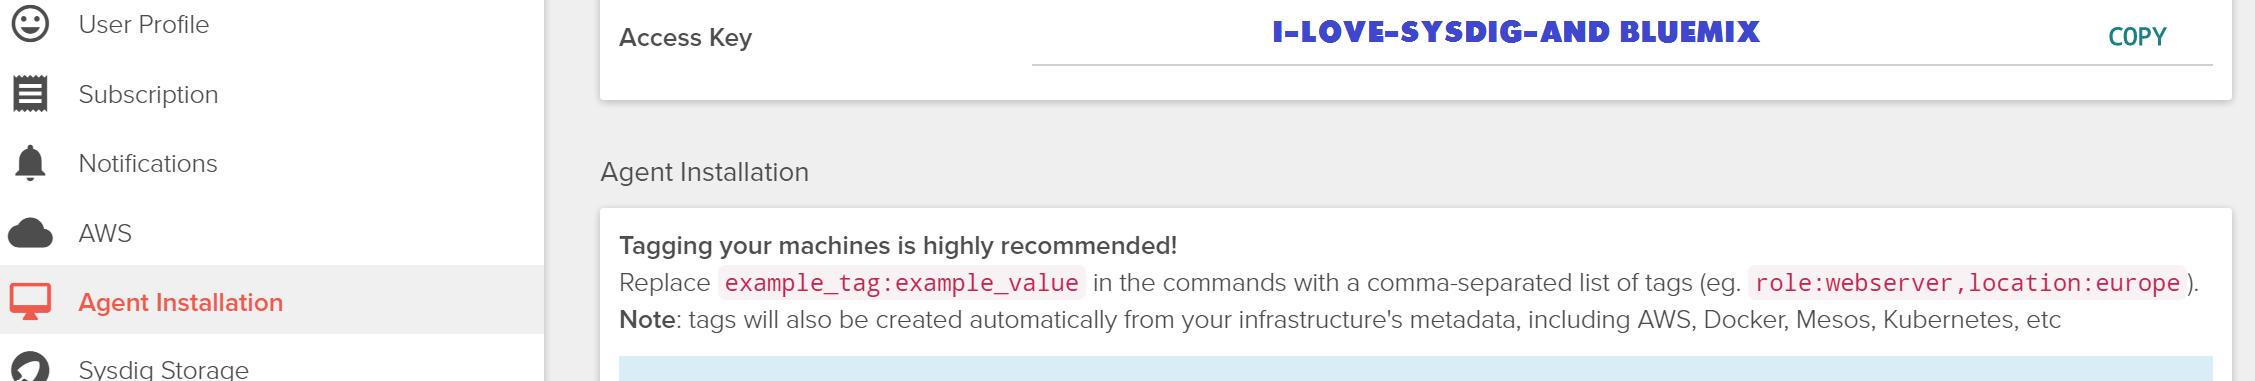
Ok, back to Bluemix. Schedule the Sysdig agent container as a DaemonSet by creating a resource manifest (YAML) file following this example provided on github. Any parameters commented out with '#' are optional or are needed only in on-premises installations (We have cloud and on-premise software offerings.). You must at least enter your Sysdig Monitor agent access key as found in the User Profile tab of the Sysdig Monitor app settings (Go to Sysdig -> Settings -> User Profile -> Access Key.):
Deploy the DaemonSet by issuing this command:kubectl create -f 'sysdig.yaml'
Now time to Sysdig!
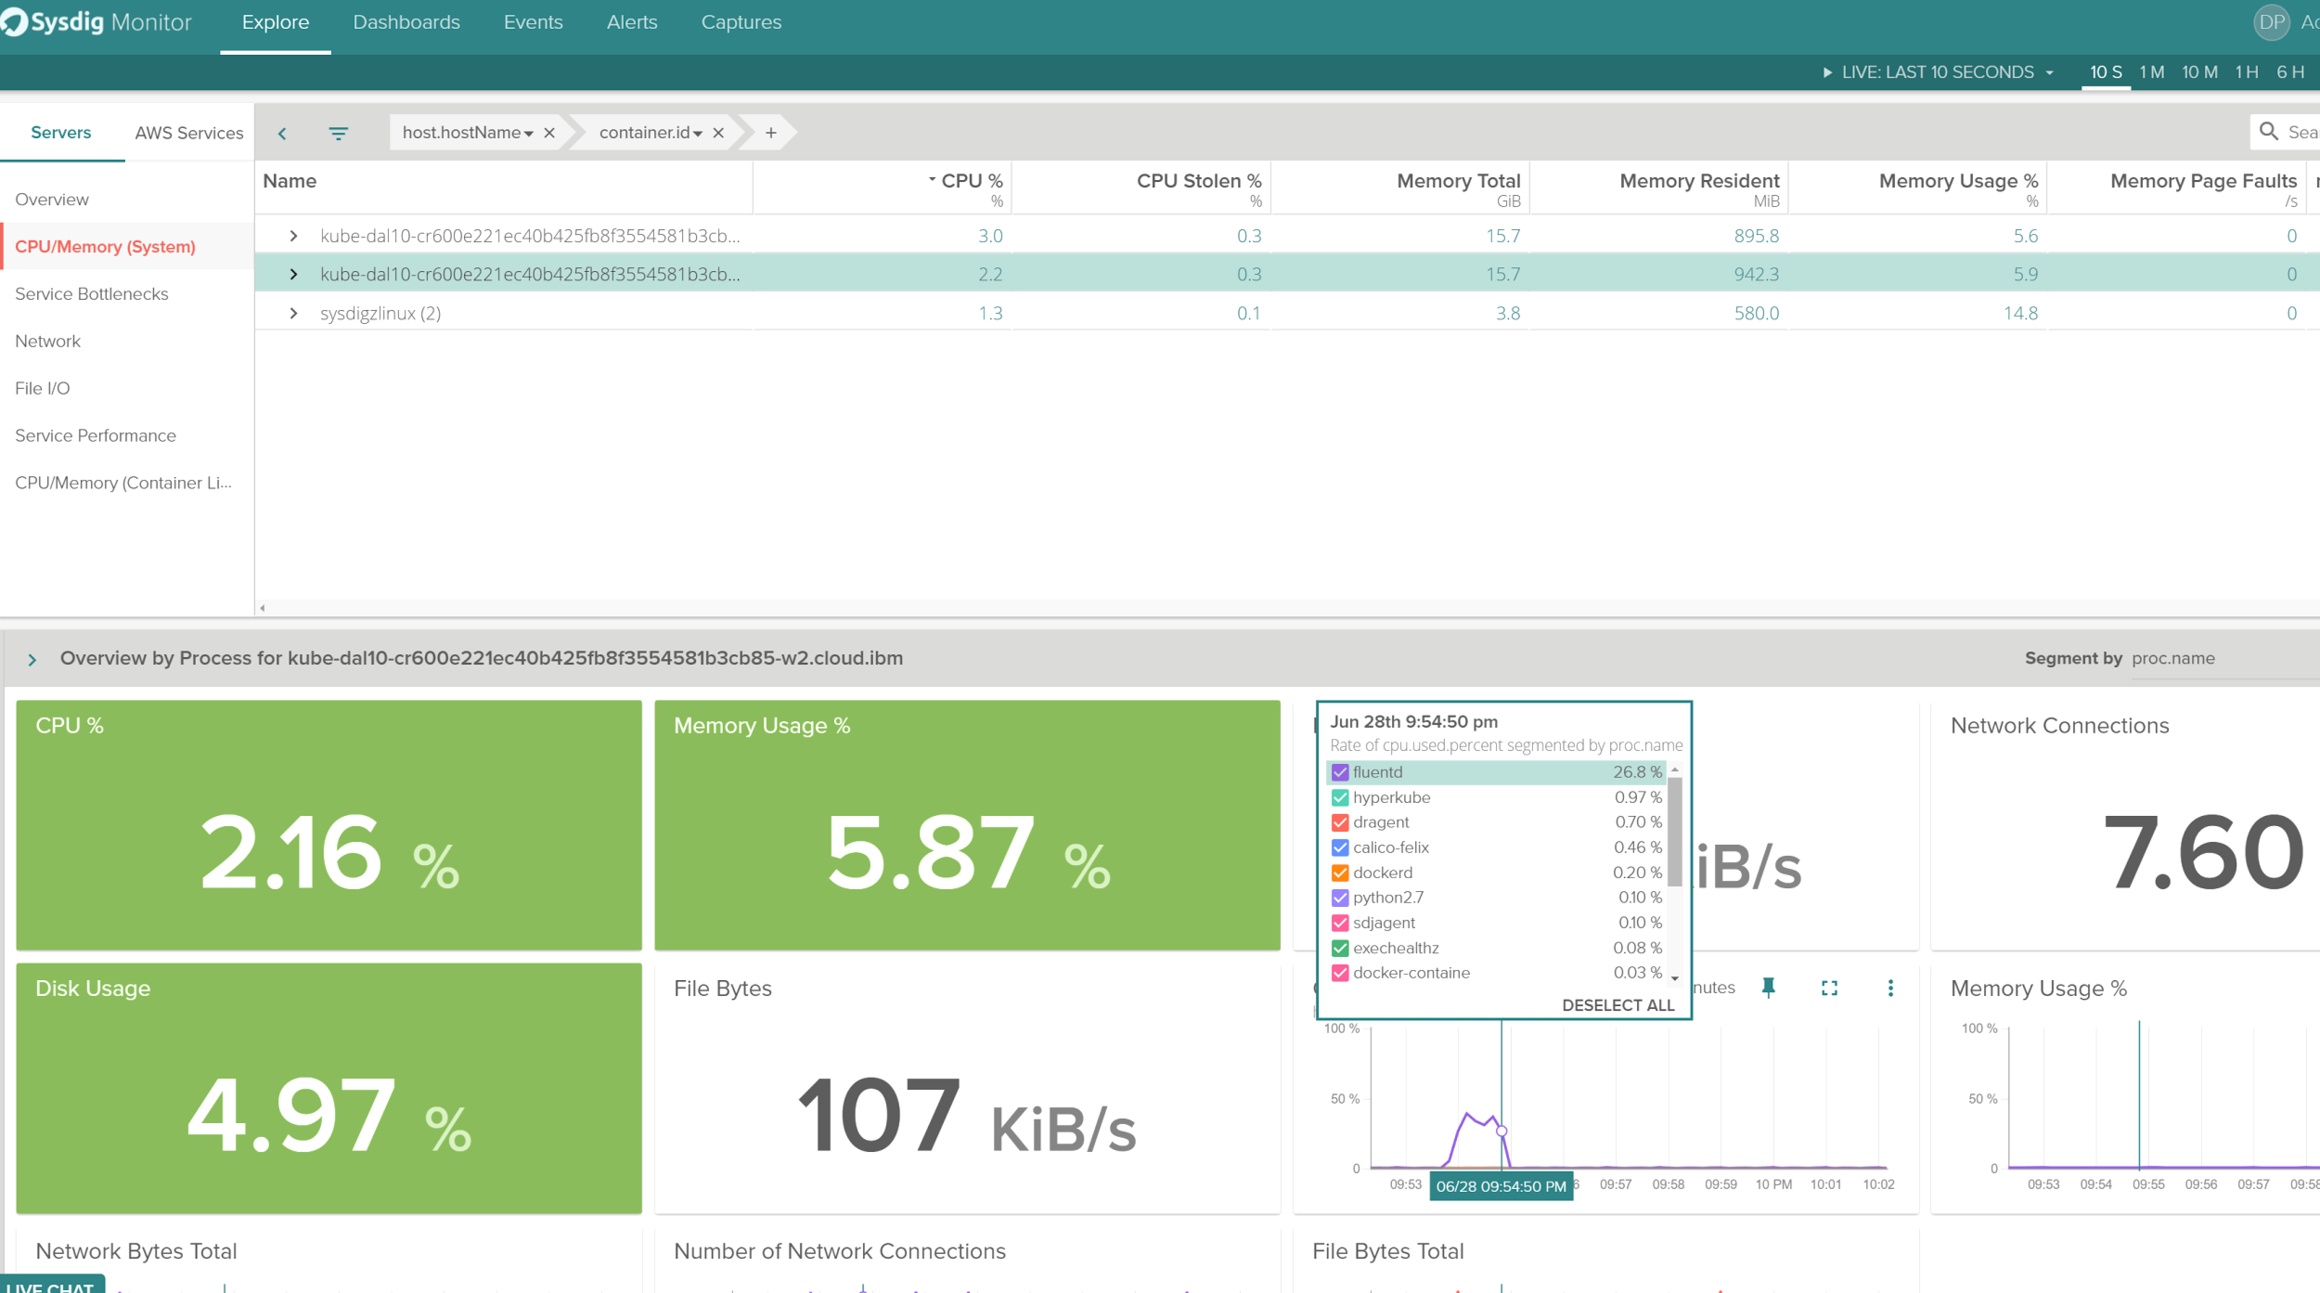
Before we hop into the metrics – just a note – everything you see below is out of the box. No special configurations, no modification to your application code, no configuring plug-ins. While Sysdig can give you even more than what's below, you'll see you start with quite a lot!We now have an overview of my agent host(s) running my Bluemix Cluster. In less than 20 minutes I have full visibility of my cluster!
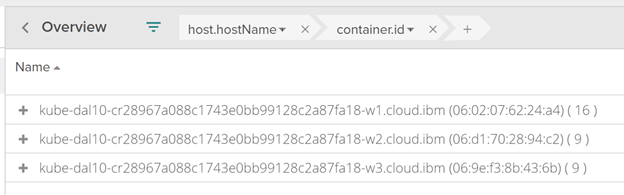
As you can see I am seeing CPU, Memory, and Network details by selecting a node. Then, drilling using Sysdig's Out of the box "Overview by Process", I get down to a default dashboard showing per-process metrics.
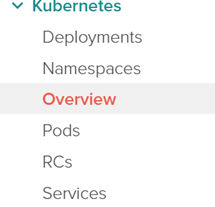
I deployed a simple Guestbook-GO from the Kubernetes example pages to the DEFAULT namespace and now I want to view Kubernetes as a whole vs at a selective host by host basis. We have the bases covered in terms of Out of the box visualization of Deployments, Namespaces, Pods, and Services:
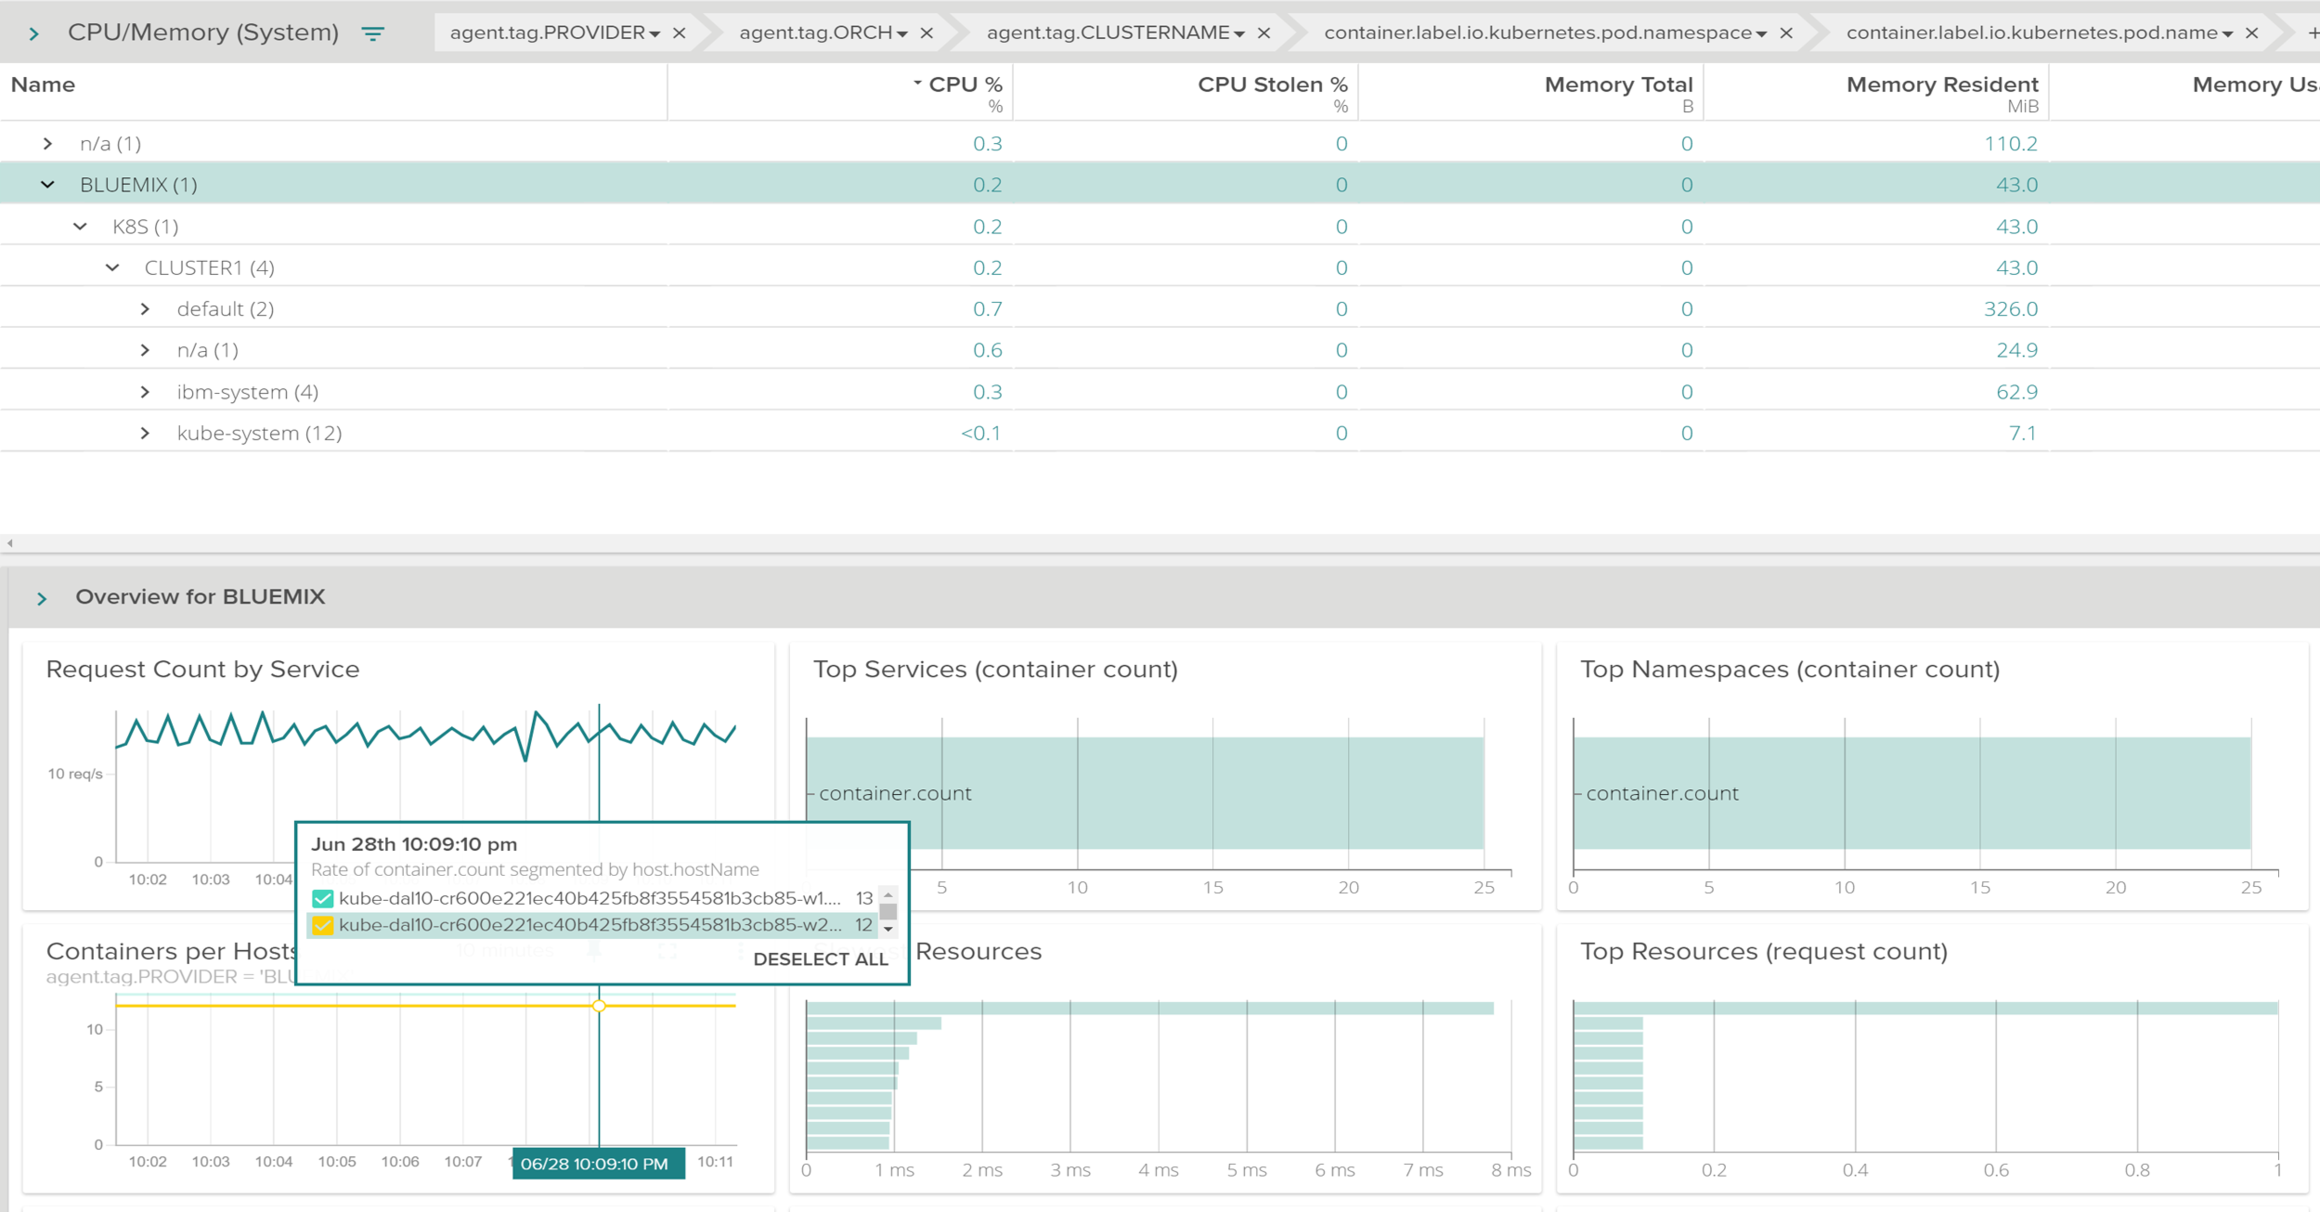
Here's a Kubernetes overview of my cluster
Notice Sysdig is grabbing the metatag data directly from Kubernetes API without any type of direct configuration. I'm seeing our request count per service, Top Services, Top namespaces and host capacity. This helps me grow the environment naturally and improved capacity planning based on REAL metrics.
I can even view how my applications are communicating through our great topology visualizations, here's a network topology view:
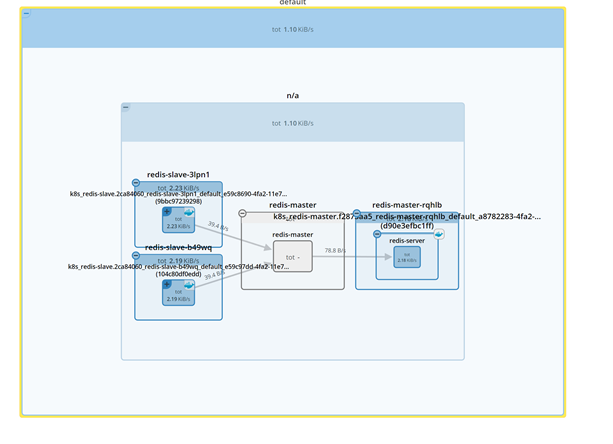
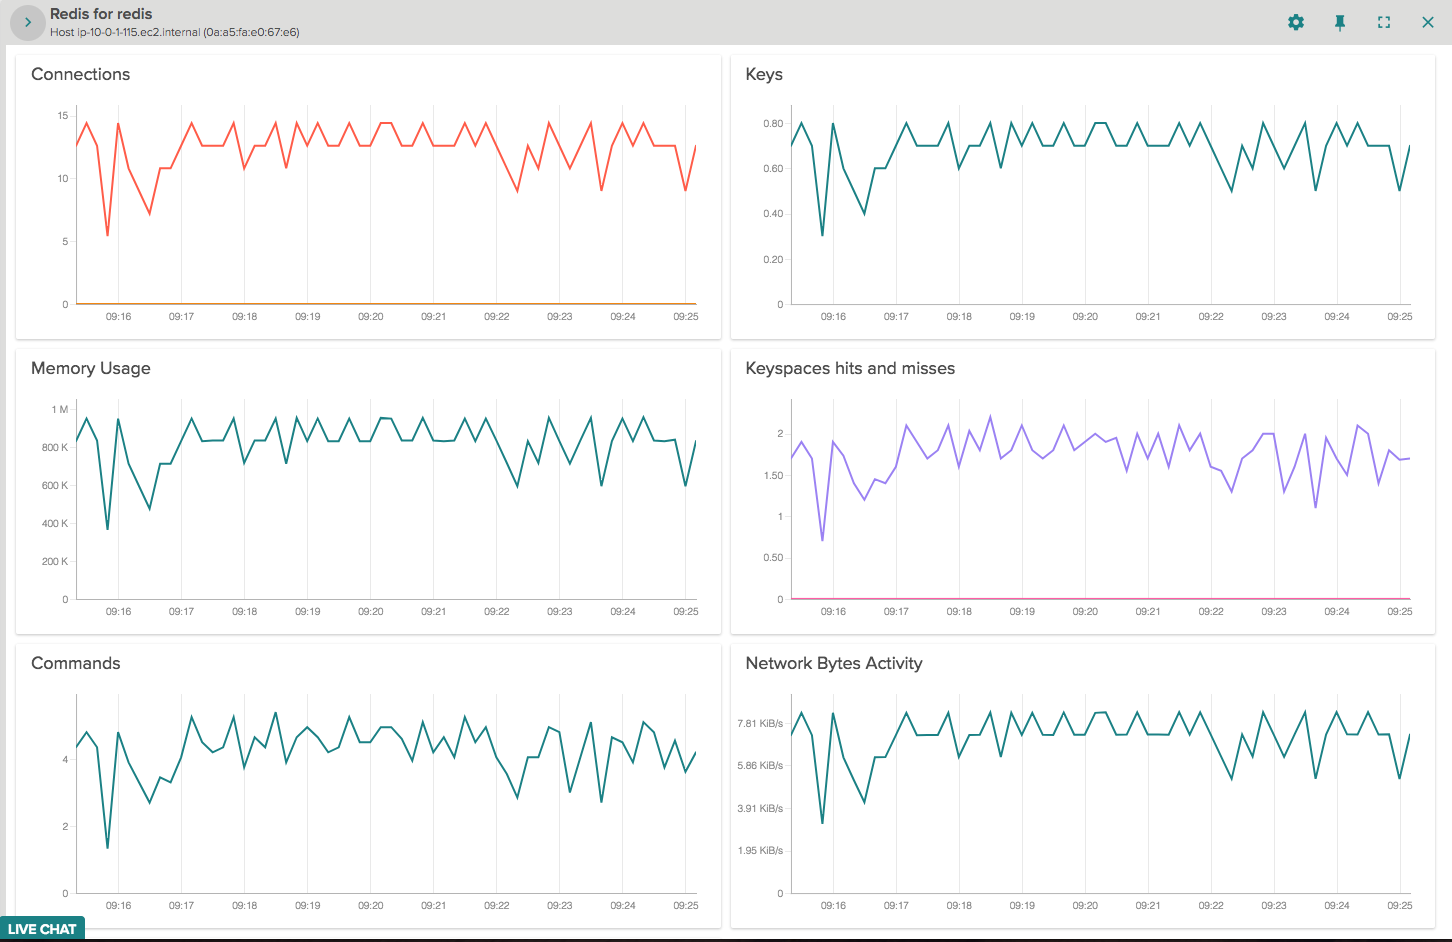
What about application metrics? How do I get to those?
Here's the same redis example from the guestbook, we have a service level view, not just single hosts, and many many more.Similarly, Sysdig can visualize statsd, JMX, and prometheus custom metrics… without even changing the collection endpoint you already have in place. (Yes, that sounds crazy. Read how it works here.)
All of that in 3 steps!
IBM Container Service is a great place for developers hosting applications and running production applications. Sysdig makes it even better with true visibility and intelligence. We even have a 4 part tutorial on monitoring kubernetes with Sysdig here.