


Falco Feeds extends the power of Falco by giving open source-focused companies access to expert-written rules that are continuously updated as new threats are discovered.

Using Container Metadata
Metrics can be consumed in many ways: alerts, charts, tables, lists… whatever action in your systems you can think of someone has probably tried to associate a metric with it. Some metrics are useful for troubleshooting bugs, while other metrics are used to identify potential issues and bottlenecks in your system. Regardless of how you use your metrics, they are much less powerful without container metadata attached. Container metadata is made up of thousands of labels and tags exposed by your infrastructure, containers, microservices, etc and is necessary for performance management of both your physical and logical services.
It's not that useful to know that CPU usage is high if you can't pinpoint the distributed Kubernetes deployment that is consuming resources, or which container is adding to the increased latency of your web application. In this post we'll cover the pieces of metadata required to properly visualize and segment your metrics and how Sysdig ServiceVision can automatically enrich all metrics with container metadata.
Understanding Metrics
Sysdig treats metrics differently than other monitoring systems and we think this will give users huge advantages in terms of out of the box visibility and the scale of your metrics collection. In Sysdig a metric is a name, a value, the container or host it came from, and all the metadata associated with that container/host object.
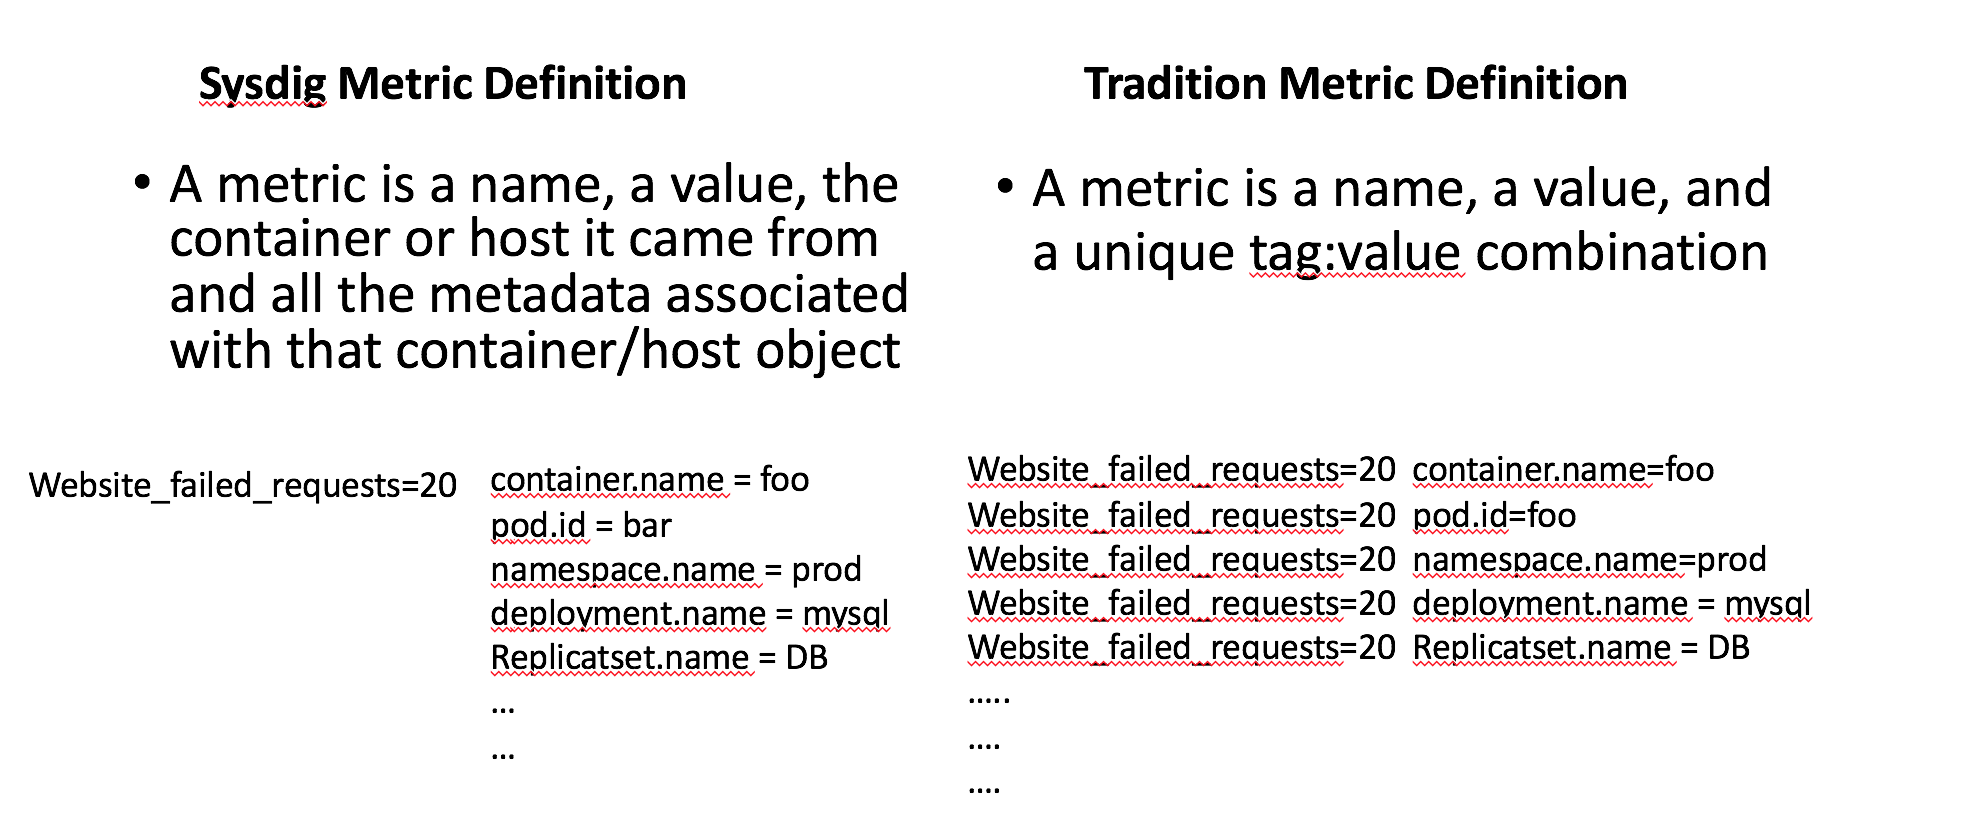
This means that one metric we collect is equivalent to 10s or 100s of metrics in traditional monitoring systems. This metadata schema also gives us the flexibility to do real time aggregations and alerts on metrics reported by 1000s of containers across your infrastructure into logical groupings based on microservice, orchestration, custom labels, etc.
Docker Labels vs. Tags
Understanding Container Labels
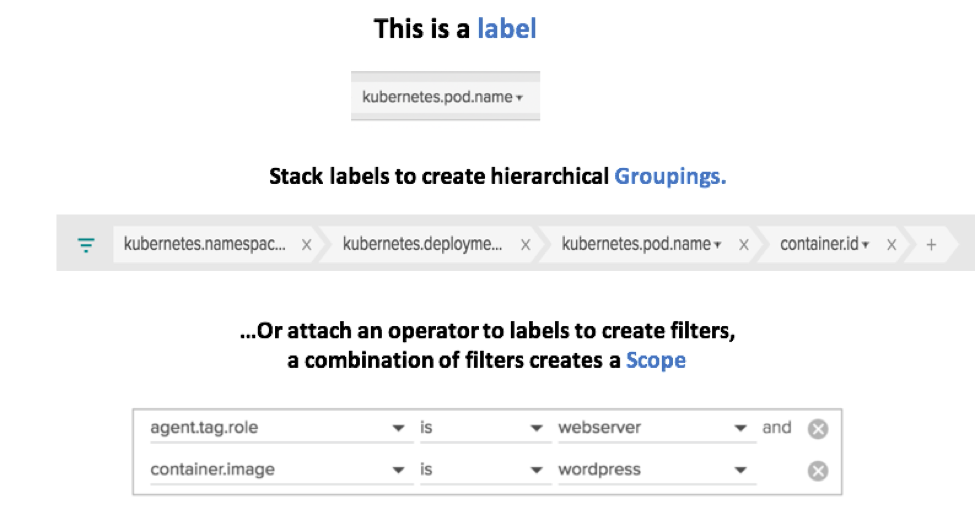
Labels might be new in the world of monitoring to some users, but they are clearly the new golden standard in the orchestrated world. Docker, Kubernetes, and Mesos all extensively label every layer of their orchestration and the containers that make up those services. Sysdig will automatically collect these labels and correlate them with the metrics from your infrastructure as well as labels from cloud providers. Labels are used to identify infrastructure objects and metrics are aggregated or filtered by these labels.

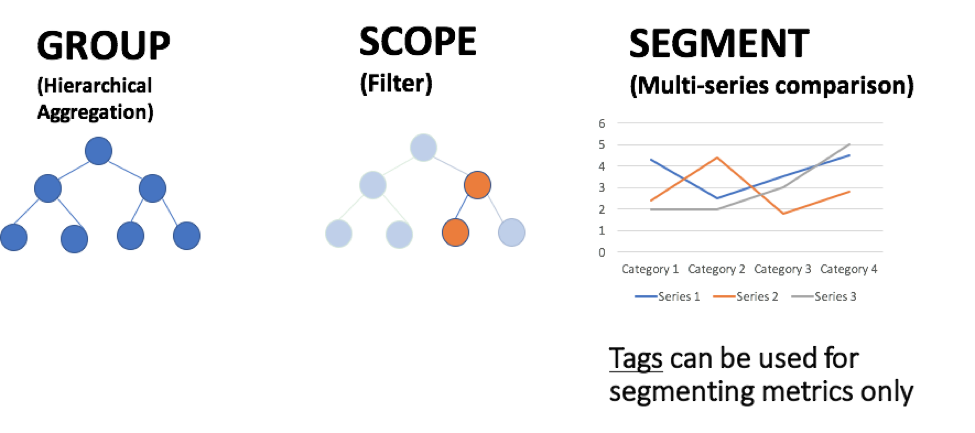
Labels become even more powerful when you layer them on top of each other within Sysdig to group, scope, or segment. Organizing your metrics in this way will allow visibility from the base units of your orchestration (containers or even processes running inside container) all the way to highest abstraction of that orchestration like a cluster.id.
Custom labels can also be applied when installing the Sysdig Monitor agent on the host, with any number of key,value pairs that you'd like. For example: role:webserver,location:europe. These custom labels can be paired with container labels to help you answer questions like: *How is my wordpress image performing across all my webserver nodes? *
Understanding Tags
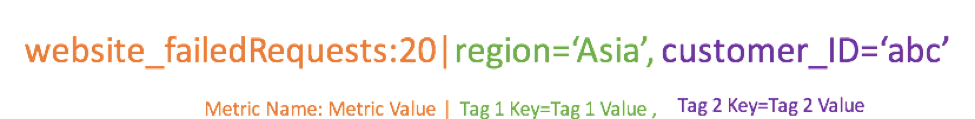
Tags are probably the most familiar metric concept to traditional sysadmins. Simply put Tags are Metric Descriptors.
Tags are very common with custom metrics frameworks such as StatsD. We at Sysdig have tried to make it as easy as possible to get your custom data into our system. The agent will automatically collect metrics from StatsD, JMX, and Prometheus without any extra pollers, or exporters needed to collect metrics. From there we'll automatically parse all tags and labels, and attach those as pieces of metadata for that metric. Like standard metrics above, another important thing to note about the metadata attached to Sysdig custom metrics is how it affects your metrics limits. Most other infrastructure monitoring systems count every metric+tag combination as their own individual metric. Meaning 1 Sysdig metric enriched with metadata can be equivalent to 100s of metrics in other tools.
How to Use Labels & Tags in Sysdig
Visualizing Kubernetes Infrastructure – Switch quickly between logical and physical hierarchies of your infrastructure using labels from both cloud providers and orchestration.
Segmenting Java Performance within Kubernetes Pods – See the performance of a service a whole as well as the components that make up the service.
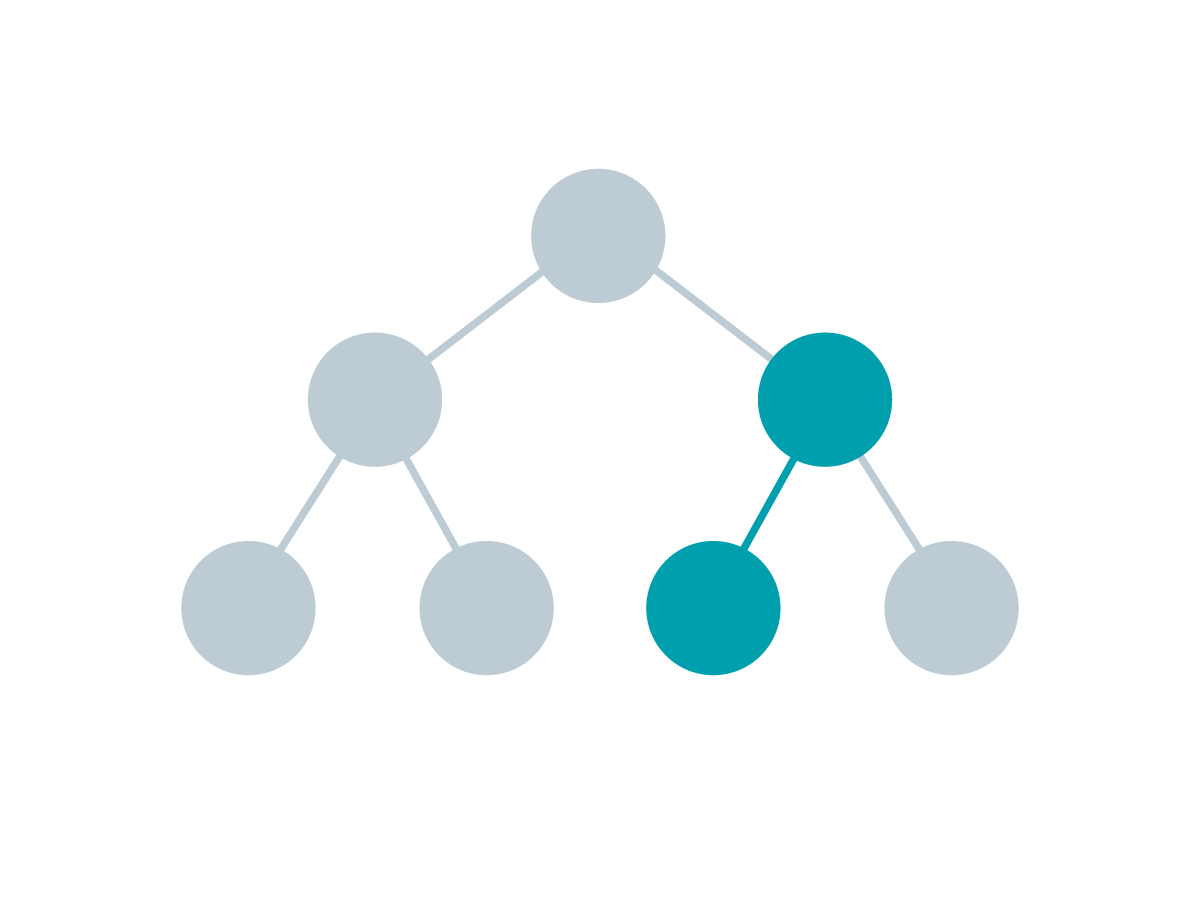
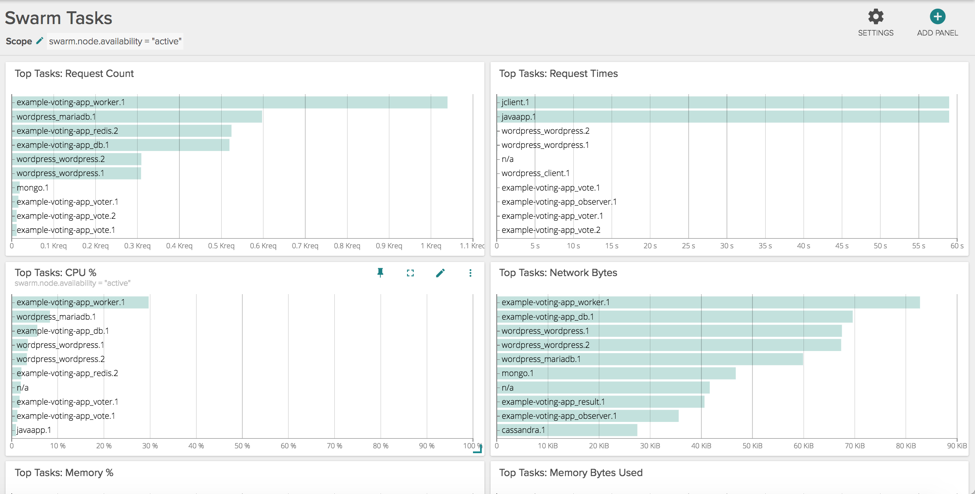
Scoping Swarm Services – Change dashboards on the fly to quickly compare differences between active nodes and nodes being drained.
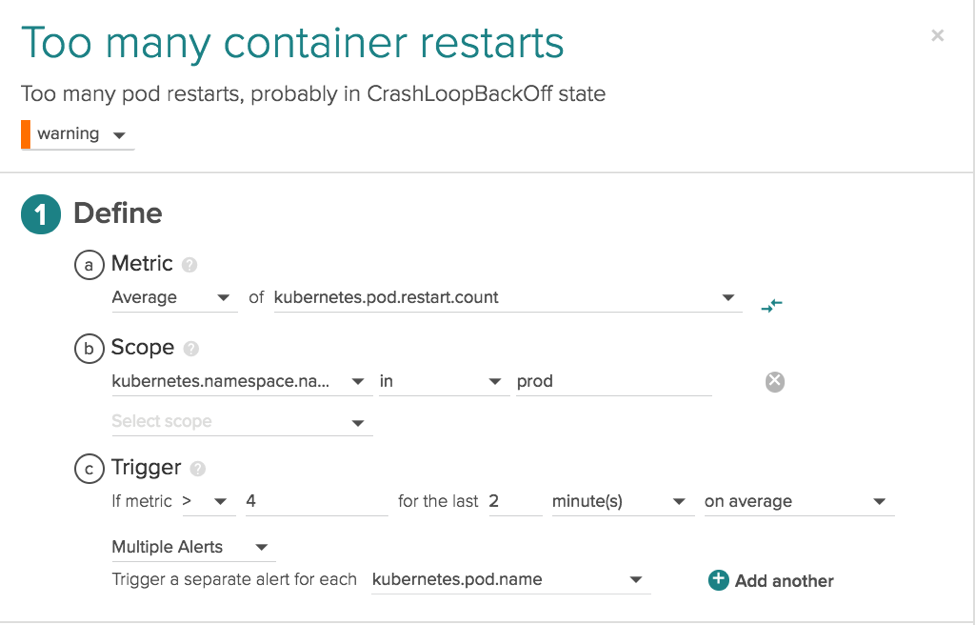
Setting preemptive alerts on the components that make up a microservice – CrashLoopBack events are something that every orchestration user will run into at some point in time. A container or pod will keep restarting over and over leading to a degrading state in your service. We can first use the namespace.name label with the value of prod to limit this to just my production environment and then use the pod.name label to segment this alert and have it apply to every single container in the production environment.
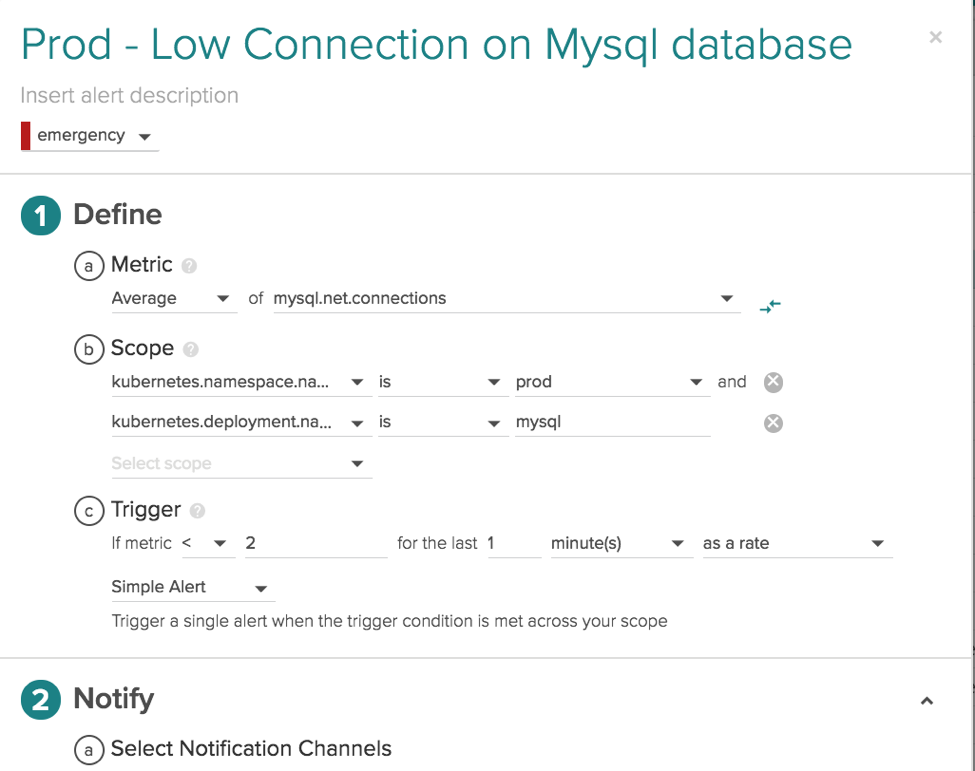
Alerting on Microservices – not just physical infrastructure – Opposite of the alert above we can use labels that come from higher levels of your orchestration to set alerts on a service as a whole. By scoping this alert with labels from the top of the Kubernetes stack namespace.name = prod and deployment.name = mysql we've created an alert that is applied to that service as a whole regardless of how many regions, hosts, or containers that service is running on.
In Review
- Metrics capture a value pertaining to your systems at a specific point in time
- Tags are metrics descriptors and are used to segment metrics ie Region, Customer
- Labels are used to identify infrastructure objects – containers, images, services, tasks
- A monitoring system should apply as many Labels and Tags as possible to the metrics that are being collected
- Group and filter with multiple labels to get full cluster visibility from the base units of your service to the highest abstraction
In containerized environments where orchestration is breaking up your services into smaller and smaller pieces distributed over 10s to 1000s of instances, metadata is even more important. Sysdig is the only monitoring solution that will proactively enrich all metrics out of the box with your tags and label so developers can spend more time doing what they do best, develop new awesome services. Sign-up to install Sysdig Monitor and leverage all the metadata Sysdig collects to get a real view of how your infrastructure and services are performing.