And multiple client implementations that will allow us to instrument our applications as well.
| Node.js / Javascript | msiebuhr/node-statsd-client |
| Python | jsocol/pystatsd |
| PHP | domnikl/statsd-php |
| Ruby | reinh/statsd |
| Golang | cactus/go-statsd-client |
| Perl | sanbeg/Etsy-Statsd |
| C | romanbsd/statsd-c-client |
| C++ | vthiery/cpp-statsd-client |
How StatsD protocol works
Your application code needs to be instrumented with any of the client implementations we mentioned above, we will show a full code example later on, but this basically boils down to:- Importing the StatsD client library: import statsd
- Declaring the StatsD variables that we want to report, specifying their metric type: counter = client.get_counter(“counter”)
- Periodically emitting a metric value update: average.send(‘avg’, 5)
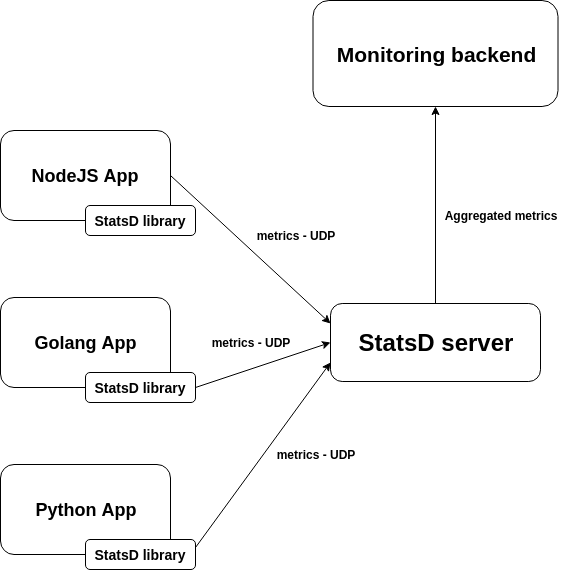 This architecture allows the StasD server to be written in any language. It also allows decoupling the behaviour of your application from the monitoring server, making any of these parts easily replaceable or updatable without interfering with the application code that your developers need to maintain.
But it has some drawbacks:
This architecture allows the StasD server to be written in any language. It also allows decoupling the behaviour of your application from the monitoring server, making any of these parts easily replaceable or updatable without interfering with the application code that your developers need to maintain.
But it has some drawbacks:
- You need to inject the minimum network configuration required to find the StatsD server. This means dealing with volatile IPs, network segmentation and routing, firewalls, etc.
- The information about which entity (host, pod, container, process) originally sent the metric is lost unless you format the metrics to explicitly store this data.
This is especially problematic if you want to deploy containers and microservices, where the software entities are volatile by nature and you need to group them by functionality (for example Kubernetes deployments and services) to make sense of the data.
- The StatsD server becomes a single point of failure. If it crashes, all the monitoring process is temporarily down and the UDP packages for that period are lost.
Types of StatsD metrics
All the metrics are sent to a server and need to be sent in a specific format. Similar to competing metrics stacks, this means declaring the variables as one of the supported StatsD metric types. Each metric follows a simple terminology.Gauge
Gauges are instantaneous measurements of a value, like the speedometer in a car. They can increase, decrease or be set to a certain value. They are a good option of you need to instrument, for example, the current load of the system.<metric name>:<value>|g
<metric name>:+<value>|g

<metric name>:-<value>|g
Counters
Counters are like gauges aggregated at the server rather than the client. They will accumulate over a period of time, and then flushed, resetting their value to 0. They can be used, for example, to count how many calls is an endpoint receiving over time:<metric name>:<value>|c[|@<rate>]
myMetric:2|c|@0.1, the server will understand that the current value of myMetric is 20.
Timers
Timers are a measure of milliseconds between the start and end of a given event. This can be used, for example, when you need to measure the request time for a service or how long a user has been waiting for the web page to display.<metric name>:<value>|ms[|@<rate]
Histograms
The histograms are also a measure of time, but they are calculated at the server side. As the data exported by the client is the same, this is just an alias for the Timer type.<metric name>:<value>|h
Meters
Meters are special case of a Counter calculated at the server. They measure the rate of events, for example, the number of requests per second. In addition to the mean rate, meters also track 1-, 5-, and 15-minute moving averages. Meters can be sent in full format:<metric name>:<value>|m
<metric name>
Sets
Sets can be used to count the number of unique occurrences between flushes. When a metric is sent with a specific value, this is counted as an occurrence.<metric name>:<value>|s
unique_users:203|s

unique_users:340|s

unique_users:203|s
unique_users will only have a value of 2, and will ignore the repeated one.
StatsD code examples
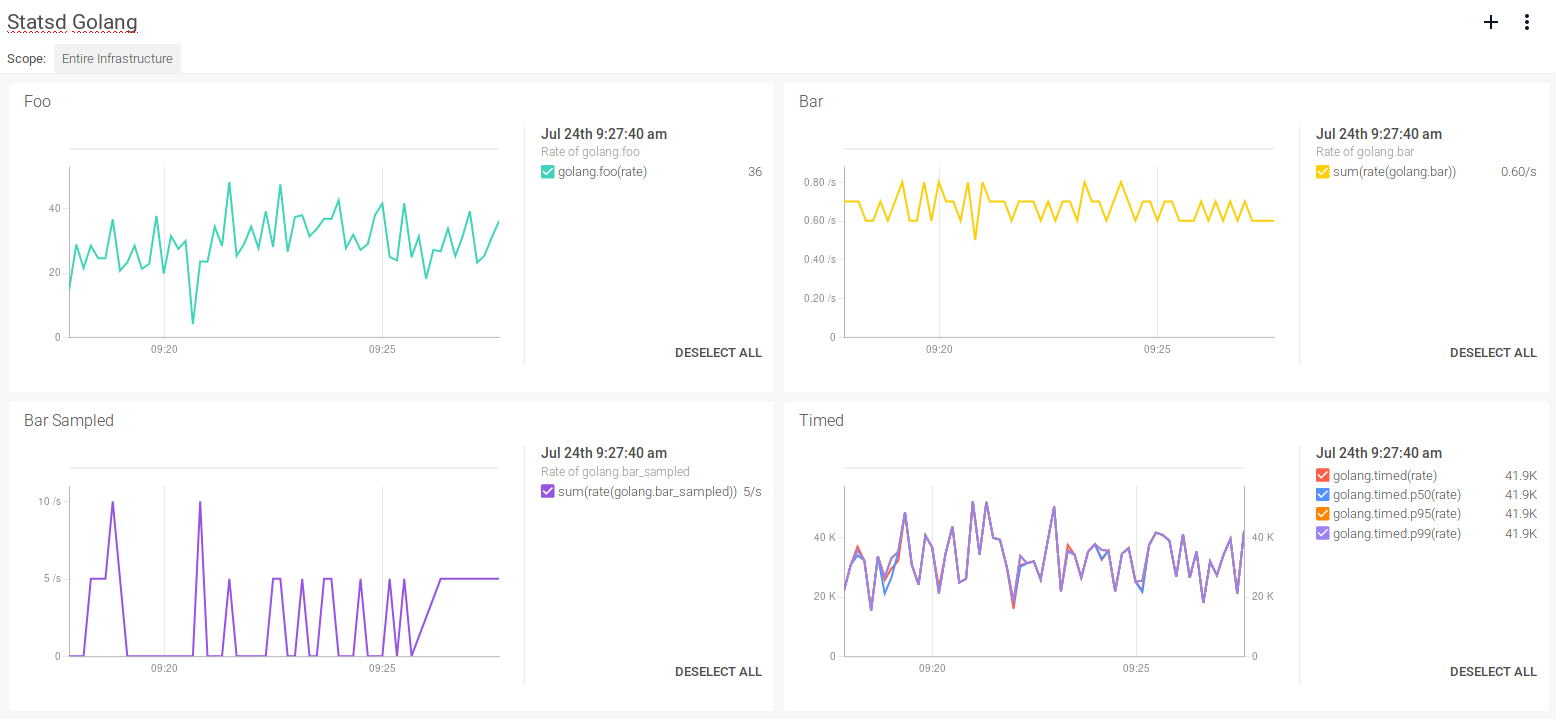
Golang code instrumentation with StatsD
First of all we need to create a client using:client := statsd.NewStatsdClient(url, prefix)
client.CreateSocket()
File: statsd-go.go
------------------

package main

import (
  "github.com/quipo/statsd"
  "math/rand"
  "time"
)

func main() {
  rand.Seed(time.Now().Unix())

  // Create the client
  client := statsd.NewStatsdClient("127.0.0.1:8125", "golang.")
  defer client.Close()
  // Connect to the statsd server
  err := client.CreateSocket()
  if err != nil {
     panic(err)
  }

  for {

     // Gauge
     client.Gauge("foo", rand.Int63n(100))

     // Counter
     client.Incr("bar", 1)

     // Counter with sampling
     client.IncrWithSampling("bar_sampled", 5, 0.1)

     // Timer
     client.Timing("timed", rand.Int63n(100000))

     // Wait for a random time between 500 and 1000 ms before sending the data again.
     time.Sleep(time.Duration(int(time.Millisecond) * (rand.Intn(500) + 500)))
  }

}
127.0.0.1:8125:
client := statsd.NewStatsdClient("127.0.0.1:8125", "golang.")
$ netcat -ul 8125
golang.foo:46|ggolang.bar:1|cgolang.timed:58840|msgolang.foo:6|ggolang.bar:1|cgolang.timed:78230|msgolang.foo:2|ggolang.bar:1|cgolang.timed:9045|msgolang.foo:30|ggolang.bar:1|cgolang.timed:57087|msgolang.foo:45|ggolang.bar:1|cgolang.timed:15685|ms
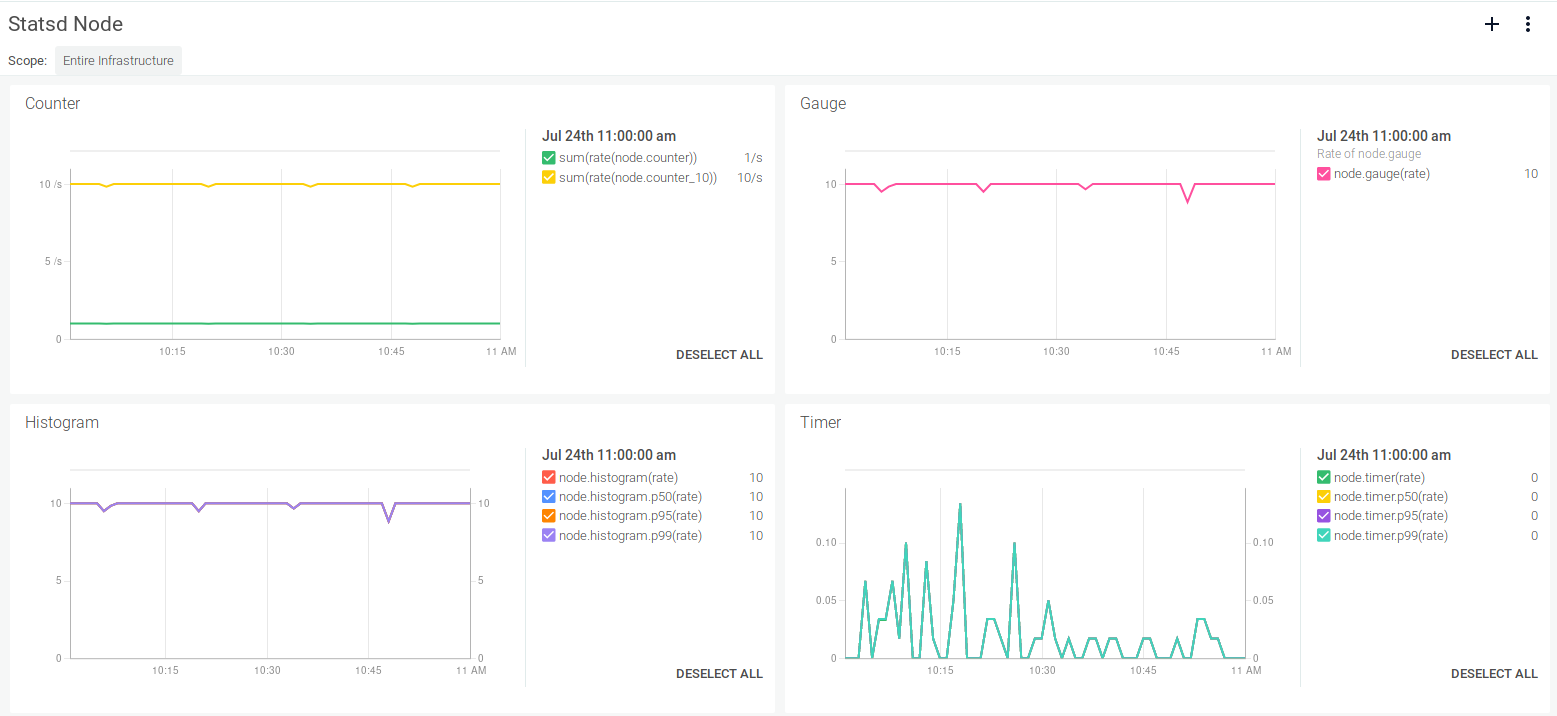
Node.js / Javascript code instrumentation with StatsD
We are going to use the statsd-client from npm, so first we need to install it with:$ npm install --save statsd-client
File: statsd-js.js
------------------

const SDC = require('statsd-client');
const sdc = new SDC({host: '127.0.0.1'});

setInterval(() => {
   const timer = new Date();

   // Increment counter by one.
   sdc.increment('node.counter');

   // Increment counter by 10
   sdc.increment('node.counter_10', 10);

   // Set gauge to 10
   sdc.gauge('node.gauge', 10);

   // Calculates time diff of time between the variable and
   // when the function was called
   sdc.timing('node.timer', timer);

   // Set will count just 2 elements since '50' is repeated
   sdc.set('node.set', 50);
   sdc.set('node.set', 100);
   sdc.set('node.set', 50);

   // Histogram with tags
   sdc.histogram('node.histogram', 10, {foo: 'bar'});
}, 1000);
$ netcat -ul 8125
node.counter:1|c
node.counter_10:10|c
node.gauge:10|g
node.timer:1|ms
node.set:50|s
node.set:100|s
node.set:50|s
node.histogram:10|h|#foo:barnode.counter:1|c
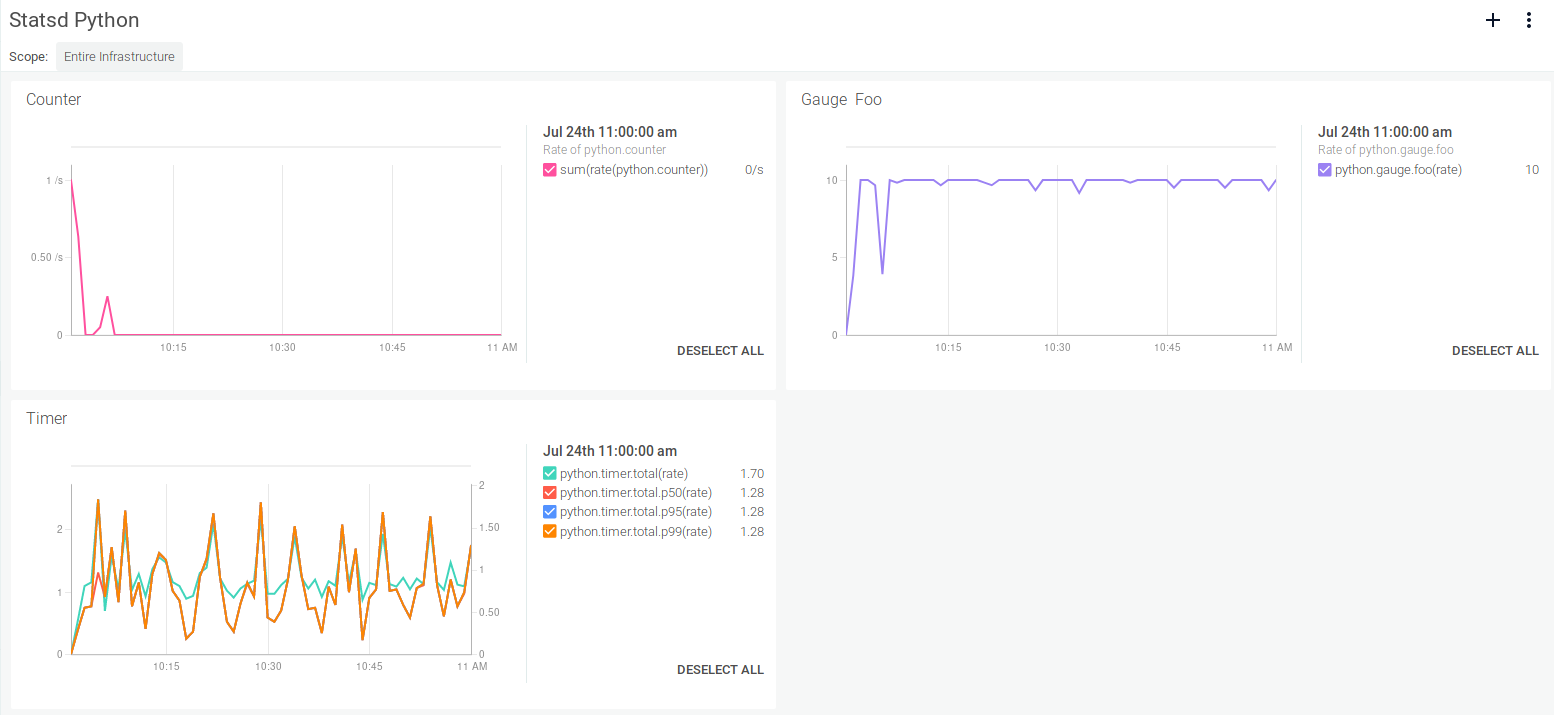
Python code instrumentation with StatsD
In this example we will use the python-statsd library. To install it we just execute: $ pip install python-statsd
File: statsd-python.py
----------------------

import statsd
import time

if __name__ == '__main__':
   # Create a new connection for the client
   connection = statsd.Connection(
       host='127.0.0.1',
       port=8125,
       sample_rate=1,
   )

   # Create the client
   client = statsd.Client("python", connection)

   # Create counter
   counter = client.get_counter("counter")

   # Create gauge
   gauge = client.get_gauge("gauge")

   # Create average
   average = client.get_average("average")


   while True:
       # Create a timer
       timer = client.get_timer("timer")

       # Will send the elapsed time once all the block has been executed
       with timer:
           counter += 1  # Increment by one the counter

           gauge.set('foo', 10) # Send a gauge of 10

           average.send('avg', 5)

       time.sleep(1)
$ netcat -ul 8125
python.counter:1|cpython.gauge.foo:10|gpython.average.avg:5|apython.timer.total:0.07200241|mspython.counter:1|cpython.gauge.foo:10|gpython.average.avg:5|apython.timer.total:0.29730797|mspython.counter:1|cpython.gauge.foo:10|gpython.average.avg:5|apython.timer.total:0.30040741|mspython.counter:1|cpython.gauge.foo:10|gpython.average.avg:5|apython.timer.total:0.29134750|ms
StatsD code in Java – Deprecated client
Since the java-statsd-client project seems stalled (last commit was more than 4 years ago), it is discouraged to instrument a Java application with StatsD. But don’t worry, you can always instrument your code using Java’s official JMX or implement the Prometheus stack, a project incubated under the Cloud Native Computing Foundation umbrella.StatsD instrumentation and Docker containers with Sysdig Monitor
Sysdig Monitor allows you to automatically collect and aggregate custom metrics, including StatsD, but also Prometheus, JMX and expvars. As we mentioned before, the “classical” StatsD architecture presents some limitations, especially when deployed over containerized (Docker, Kubernetes, OpenShift, etc) workflows:- Origin of the metrics (container, pod, deployment, service) is lost if you don’t explicitly append it to the metric
- Entities are ephemeral appearing, disappearing being scaled up and down, manual tagging and labelling is just not feasible anymore
- Network configuration and visibility requires injecting extra parameters in your containers at boot time
- Adding a separate process, inside the same container or as a sidecar container, to aggregate and push the StatsD metrics is doable but goes against the inherent simplicity of containers
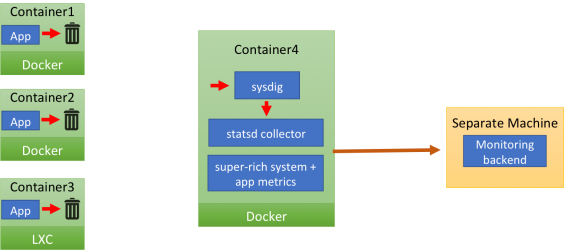 The careful reader has surely noticed that there are no arrows connecting the app containers and the monitor container. That’s because the applications inside the containers send their StatsD messages to localhost.
This means: no need to hardcode a collector IP address. However there’s no StatsD collector on localhost, so the UDP payload just gets dropped (the image depicts it as the message going to a trash can).
The same message “magically” appears in the monitoring container (container4). Once there, it’s is received by the Sysdig agent, which feeds it to the local StatsD collector, after enriching it with a set of tags (container name, image name, etc) that will enable segmentation later on.
The StatsD messages are merged with Sysdig Monitor’s system, network and application metrics and then they are compressed and shipped to the Sysdig Monitor backend.
You’re probably wondering: “How do StatsD messages go from the application container to the Sysdig Monitor one”? Let’s add some detail to the previous image:
The careful reader has surely noticed that there are no arrows connecting the app containers and the monitor container. That’s because the applications inside the containers send their StatsD messages to localhost.
This means: no need to hardcode a collector IP address. However there’s no StatsD collector on localhost, so the UDP payload just gets dropped (the image depicts it as the message going to a trash can).
The same message “magically” appears in the monitoring container (container4). Once there, it’s is received by the Sysdig agent, which feeds it to the local StatsD collector, after enriching it with a set of tags (container name, image name, etc) that will enable segmentation later on.
The StatsD messages are merged with Sysdig Monitor’s system, network and application metrics and then they are compressed and shipped to the Sysdig Monitor backend.
You’re probably wondering: “How do StatsD messages go from the application container to the Sysdig Monitor one”? Let’s add some detail to the previous image:
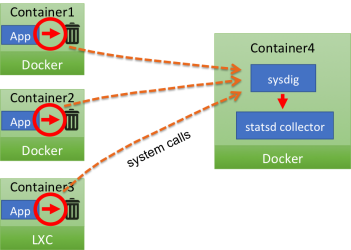 What is actually happening here is that all network transmission made from inside the application containers, including StatsD messages, including the ones sent to a non existent destination, generate a system call. The Sysdig agent can capture these system calls from a separate container, where the StatsD collector is listening. In practice, the agent acts as a transparent proxy between the application and the StatsD collector, even if they are in different containers. Sysdig also knows which container the system call is coming from, and uses that information to transparently tag the StatsD message.
We believe this approach has multiple noticeable advantages, more so if you are using containers:
What is actually happening here is that all network transmission made from inside the application containers, including StatsD messages, including the ones sent to a non existent destination, generate a system call. The Sysdig agent can capture these system calls from a separate container, where the StatsD collector is listening. In practice, the agent acts as a transparent proxy between the application and the StatsD collector, even if they are in different containers. Sysdig also knows which container the system call is coming from, and uses that information to transparently tag the StatsD message.
We believe this approach has multiple noticeable advantages, more so if you are using containers:
- Getting rid of all the network configuration, routing and maintenance
- Super simple “push to localhost” approach
- Out of the box host / container / orchestrator (Docker, Kubernetes, OpenShift) tagging
- Provides a monitoring backend including long term storage, dynamic aggregation based on labels and flexible dashboarding and visualization