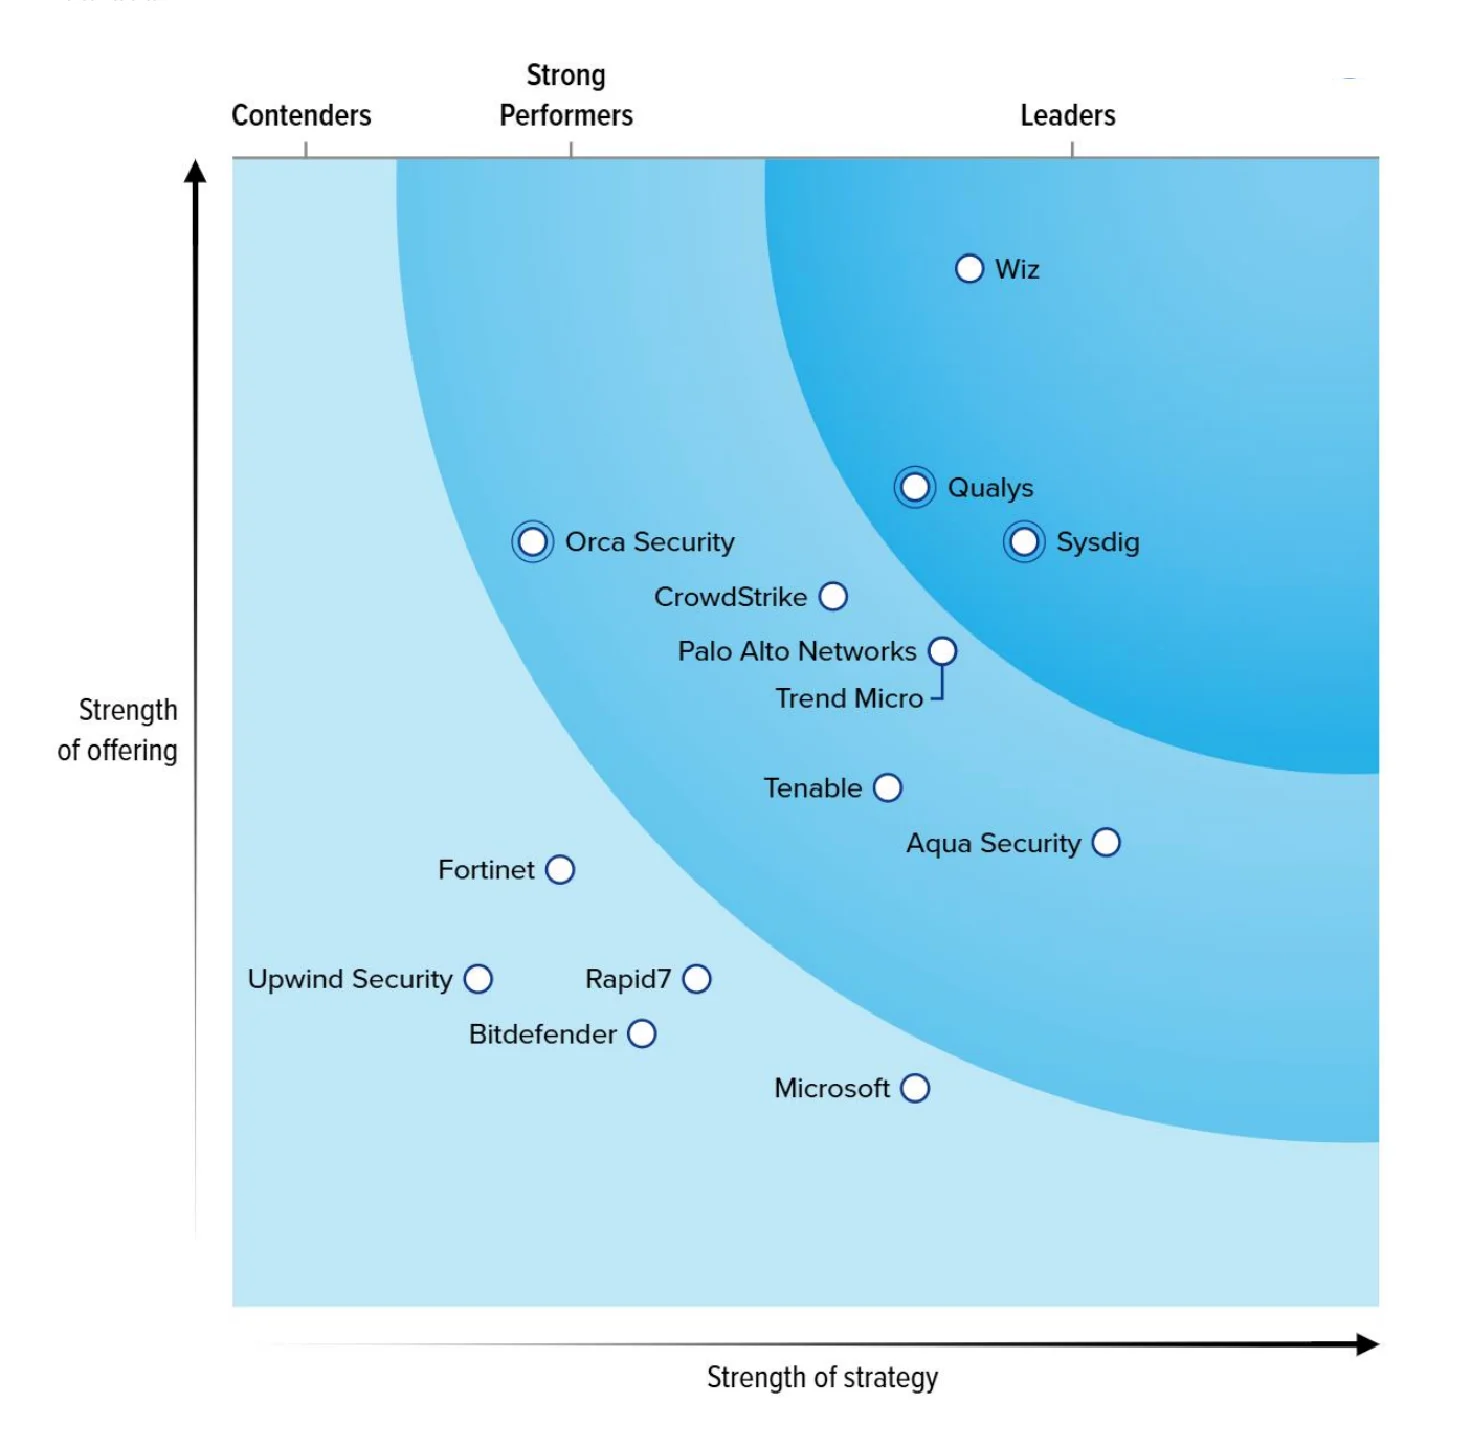
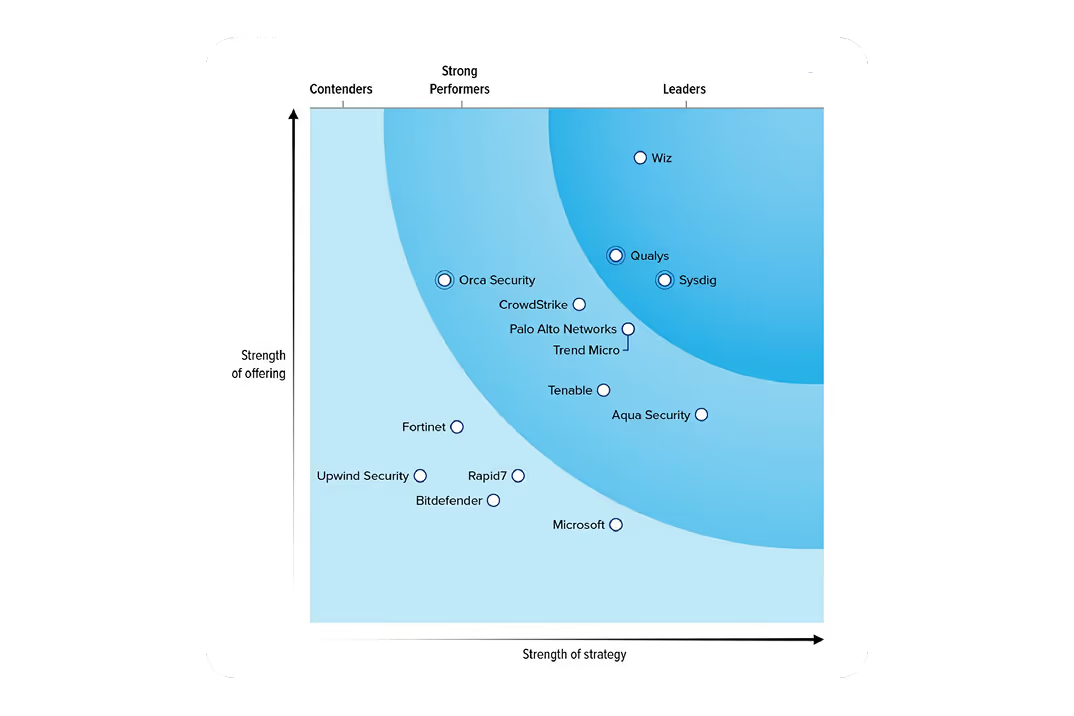
Monitoring Kubernetes (part 4): Docker + Kubernetes at WayBlazer – A use case

By Apurva Dave - MARCH 24, 2017

SHARE:

  • This article is part of our series on operating and monitoring Kubernetes in production. Part 1 covered the basics of Kubernetes and monitoring tools; Part 2 covered Kubernetes alerting best practices. Part 3 covers troubleshooting, particularly Kubernetes service discovery, and this final section is a real-world use case of monitoring Kubernetes. *

Moving Docker into production is still as much art as it is science. We caught up with Kevin Kuhl and Kevin Cashman at WayBlazer to talk about monitoring Docker and Kubernetes, selecting the right metrics to focus on, deciding what to run with Kubernetes, and diagnosing the “domino effect” in a Kubernetes failover.

UPDATE: We checked in with Kevin & Kevin at Wayblazer a year after we wrote this, and added a number of new, insightful details around the security of their Kubernetes deployment.

Introducing WayBlazer

WayBlazer is the world’s first cognitive recommendation engine focused on delivering artificial intelligence to the travel industry. Bringing together IBM Watson and proprietary cognitive computing technology, WayBlazer’s AI analyzes cues and triggers from the traveler’s search to yield personalized hotel recommendations, insights, images and local area knowledge in the context of each individual and their trip profile. The combination of personalized content with hotel recommendations boosts online engagement and improves traveler conversion rates.

Based in Austin, Texas, the company is led by seasoned travel and tech entrepreneurs, including the Founder of Travelocity/Founding Chairman of Kayak.com, the former GM of IBM Watson, and the former President of Sabre Hospitality Solutions.

What’s your environment like?

We’re an AWS shop, so as you can imagine we heavily use EC2. We also take advantage of a number of AWS services…they’re good, cost effective, and managed really well. So that makes our lives easier. Not too long ago we started using Kubernetes, and now we run around a dozen Kubernetes minions (sometimes more when we scale) on top of our EC2 nodes. We run about 15-20 containers per node. In addition we have a number of Kubernetes namespaces – prod, test, and project-specific namespaces.

Within that environment we’re running a number of different services. Our frontend is in javascript and our API service is running on node.js. We have java services doing the heavy lifting in the backend, as well as some auxiliary applications running in python.

We use Sysdig Monitor and AWS Cloudwatch to provide monitoring. We depend on many Kubernetes and AWS platform features to secure our applications, but we’ve also started using Sysdig Secure to bolster our run-time defenses.

Do you run everything in Kubernetes?

No, not everything. Our approach is to start by saying, “Should it run in Kubernetes?” but we have a number of areas where the answer is no.  If we don’t run something in Kubernetes either it’s not a functional fit or we didn’t like the performance profile.

The most obvious thing we run inside it are our stateless services. They’re the perfect fit. Stateful services, like our graph database, aren’t a good fit today. Maybe with PetSets we’ll eventually be able to do that, but we don’t right now. Finally, we have a lot of jobs we run once or we run on a schedule. We prefer to run these outside of Kubernetes. Again, it’s something that Kubernetes is building towards but doesn’t meet our needs today.

You’ve got a lot of things to monitor, Docker, AWS, Kubernetes, and your services – both from a security and access perspective but also from an application performance perspective. How do you keep track of it all?

Let’s talk about securing the platform first. From the start we used kubernetes mutual TLS – that enabled us to control access to kube-ctl. From networking perspective, Amazon ELB is secure and protects our applications from being exposed to the world. This was great from the perspective of creating “strong walls” around our activity. However, those tools couldn’t give us positive confirmation that nothing bad was happening inside the walls. I’ll talk about that more in a moment when we go deeper on Sysdig Secure.

From a classic metrics monitoring perspective, way back, we relied solely on AWS Cloudwatch to give us host level metrics. That worked ok before we had Docker and Kubernetes, as we were operating a more static architecture. Also, when things were less dynamic you could derive a lot more information about the application’s performance from your infrastructure metrics. Moving to Kubernetes changed that for us. We needed to have container and service level monitoring.

Kubernetes came packaged with heapster and grafana, so that was the first thing we tried. It was a very heavy investment in our time and effort to get it running and then to manage it. Given we’re an ops team of two, it wasn’t the most strategic way to spend our time. We wanted a monitoring capability that was full-featured, robust, and we could hit the ground running with.

So for us, that ruled out the roll-your-own, glue-some-components together approach. The choices we came down to were commercial products that would fit our needs. We actually still use CloudWatch for basic AWS metrics, and now also use Sysdig for all the higher level stuff. There’s a bit of duplication there in terms of monitoring low level infrastructure, but that’s OK by us.

Does having Kubernetes impact how you monitor Docker? And Secure it?

Yes, but Kubernetes has impacted a lot of things, not just monitoring. If we go back to why we chose Kubernetes, one of the things we liked was that it precisely described what it was doing and had its own language to describe it: namespaces, deployments and so on.  That “language” is opinionated in a way that forced everyone here to get on the same page when it comes to our container technology. That made it easier to communicate with engineers, ops…. basically anyone involved with the creation and operation of our software. Part of DevOps is putting your datain front of engineering, so it was essential to have them consistent.

To get more specific on monitoring, by far the biggest, most obvious thing we realized moving to Kubernetes was that we needed monitoring capabilities that could give us insight into a kubernetes-centric and a service-centric view of our code. Let’s face it, a lot of things can monitor docker containers at the infrastructure level by talking to the stats API, but they don’t know anything about what that container is. Knowing that these 10 containers make up the API server, or this one container is part of this pod, or this ReplicaSet…. That is hugely valuable and has reshaped monitoring for us.

There is a similar line of thinking for security: A security tool that has a service-centric and Kubernetes-centric view – and can see inside a container to see what’s happening internally – is much more powerful than a tool that just sees containers or groups containers by image name.

Alright, so since we’re writing this piece with you, we can all safely assume that WayBlazer chose Sysdig. Why?

Yeah, safe bet. We’re now using the entire Sysdig Container Intelligence Platform – Sysdig Monitor, Sysdig Secure, and the open source troubleshooting tool. Sysdig is a good unifier of 10,000-foot infrastructure view and a Kubernetes-centric view….all in one place. There’s basically nothing else that does this, and you need both of these viewpoints in your monitoring and security systems to run containers in production.

Sysdig reinforced the common language of Kubernetes. It understands the basic constructs of Kubernetes out-of-the box. We didn’t have to teach sysdig anything, we didn’t have to adapt it. Once we deployed it and instrumented our hosts we could get a service-level view of our metrics, command histories, and security policy violations.

All of this comes from one, unified agent. We’ve been running Sysdig Monitor for about 18 months before adding Sysdig Secure, so all we had to do was add an additional conf variable to our Sysdig agent YAML file, and then the Kubernetes Daemonset takes care of the rest.

The next big thing was that Sysdig could see inside containers to get a more application or code-centric view of our applications. Although we keep tabs on  infrastructure metrics, we focus on monitoring our application. Sysdig does that out-of-the-box, even as Kubernetes is scaling Docker containers up and down.

All of these aspects reduce cost and make us more efficient. It means we don’t have to put engineering effort into adapting raw metrics to reflect that Kubernetes metadata, nor do we have to think too hard about instrumenting our systems.

How do you secure your applications once they’re in production?

I already mentioned the security our platforms give us. But I needed something that gave us security for run-time behaviors as well. These could be events happening at the host level, application level, or anywhere else in the system. I liked Sysdig Secure because in addition to implementing service-centric policies to alert or block behaviors, it gives me really deep visibility into everything happening on the system. And that gives me peace of mind that something explicitly didn’t happen.

My biggest run-time security concerns are (1) who is logging into systems and what are they doing there and (2) is anyone modifying files associated with our highest value systems?  Default Sysdig Secure policies already defend and alert against logins, remote shells, unauthorized connections, and a bunch of other stuff, so I only needed to create some specific ones for our custom applications.  We wanted a higher level of priority on those policies, and wanted them tightly defined.

In terms of the visibility I described, the command history in Secure is a perfect example of that. It gives me the ability to see anything executed within the system, scoped to a microservice or host or container… whatever I need to look at, given the situation. The parallel in Sysdig Monitor is the ability look at the metrics back in time, which is also pretty useful. Now, if you take the the two together, they’re is incredibly useful. If I see a spike or event in our monitoring dashboards (memory, response time or the like), I can go back into the command history and get more insight – did someone run something new on that service or container?

Let’s go deeper on monitoring. What are the most important monitoring metrics for you? What is it that you track day in and day out?

The funny part is, we’re talking about docker monitoring, but we don’t really monitor docker much at all. We focus on monitoring our applications, and to some extent we monitor kubernetes to give us environmental information about our applications. We will often use Docker related information for troubleshooting, it’s another layer in our infrastructure stack, and may often present information that helps us solve tricky problems. Here’s some of the key stuff we monitor at the app level:

  • Request times: We keep a close eye on the request and response times for our front end and API. These are the first indicators that will fire if something goes wrong or changes. For example a new build could throw our application off, or a network misconfiguration could have a negative effect on the user.
  • Backend query response time: These could be directly related to a database or to our java backend. Again, this is a good place to look for potential problems brewing, as well as for opportunities to improve our system. If a commonly executed query is running slowly, we can bring that back to the team for investigation and remediation.
  • Heap usage and garbage collection: While we don’t use them regularly, we’ve used this data to debug our data warehouse based on JVM-level data. Again, we’re really looking at these resource metrics from an app level.

Next is Kubernetes. Here’s what we track:

  • Pod restarts and container counts: They tell us if something is changing.
  • Failed launches: These are important events that we can use to correlate with other metrics, whether app or infrastructure.
  • Service request latency: This one is challenging. It involves aggregating the latency information from all our containers from a particular service and presenting that in one, unified view. This is a prime example of having a “kubernetes viewpoint” in your monitoring.
  • Per-container resource utilization: We’ve recently added requests and limits in Kubernetes, which means we can track resource utilization more effectively. Instead of tracking CPU and memory as a function of the host, we track these metrics based on the allocated resources to that particular container. That should give us an earlier warning to resource allocation issues as opposed to just monitoring at the host utilization level.

Yes, we also have typical alerts on high CPU, memory, and disk utilization on critical nodes. You have to have ‘em.

Can you tell your story about monitoring the Kubernetes “domino effect”?

This was something we experienced early on with running Kubernetes in EC2 as we tested our new environment out. Our first warning indicator was an alert around high API latency. At this point latency started to subside – we were ready to act if needed but things seemed to have settled down.

But pretty soon we knew there was a serious problem. We started seeing alerts in amazon for unhealthy instances autoscaling group for kubernetes manages. We immediately went to sysdig and noticed blue line going down. This wasn’t good – but not yet the end of the world. Kubernetes was acting by failing those containers over to another node.


Container Failing

Then saw both disk usage and memory usage go very high at the same time. This was the final death knell. This entire system fell over.

Container Failing

Essentially we had a domino effect – Kubernetes failover worked on the first node, which had purged all of the containers when it ran out of memory. At this time requests and limits for memory usage were not present on some services.

Monitoring Kubernetes Nodes Memory

The trouble was that the other nodes in the cluster already had enough disk usage that they couldn’t reserve enough space to fully migrate that number of containers to other nodes.

Monitoring Kubernetes Nodes Disk Usage

We were quickly able to widen the auto scaling group and heal a couple nodes to get us back on track; but it was painful and not ideal. During our retrospective on this, it was interesting to be able to review the whole thing through Sysdig. We very quickly were able to have a very robust report with the team within a day showing exactly what happened. We generated a full list of action items with specific numbers for thresholds, limits, scaling policies and requirements. It generated several sprints of production hardening work and made our systems much more robust. Lessons learned #monitoring the #Kubernetes domino effect Click to tweet

Can you sum up your Docker Monitoring lessons learned?

Our experience shows that adopting Kubernetes and Docker will have a significant impact on your monitoring approach. Much like Kubernetes can move you to a more service-centric view of your infrastructure, your monitoring strategy will move the same way.

You’re going to need both an infrastructure based view (the standard way of monitoring) and a service centric view (the new way of monitoring) in your monitoring system to run containers in production.

Make sure your monitoring system reinforces the common language of Kubernetes. It must understand the basic constructs of Kubernetes out-of-the box. You shouldn’t have to teach it anything. Once you deploy it and instrument your hosts, you should get a service-level view of your metrics.

The next big thing is that your instrumentation should see inside containers to get a more application or code-centric view of our applications. Although we keep tabs on infrastructure metrics, we focus on monitoring our application, even as Kubernetes is scaling Docker containers up and down.

All of these aspects reduce cost and make us more efficient. It means we don’t have to put engineering effort into adapting raw metrics to reflect that Kubernetes metadata, nor do we have to think too hard about instrumenting our systems.

We hope you enjoyed this Kubernetes monitoring series! If you feel like learning more, this was our presentation on CloudNativeCon / KubeCon “You’re Monitoring Kubernetes Wrong” by our CEO and founder Loris Degioanni:

Subscribe and get the latest updates