Monitoring Kubernetes, both the infrastructure platform and the running workloads, is on everyone’s checklist as we evolve beyond day zero and into production. Traditional monitoring tools and processes aren’t adequate, as they do not provide visibility into dynamic container environments. Given this, what tools can you use to monitor Kubernetes and your applications?
Interested in Kubernetes monitoring?
Check these other articles with advanced topics:
· Best practices for alerting in Kubernetes →
· troubleshooting Kubernetes service discovery via system captures →
· monitoring Kubernetes at WayBlazer (a use case) →

Why is monitoring Kubernetes hard?
Kubernetes has taken the container ecosystem by storm, and with good reason too. Kubernetes acts as the brain for your distributed container deployment. It’s designed to manage service-oriented applications using containers distributed across clusters of hosts. Kubernetes provides mechanisms for application deployment, scheduling, updating, service discovery and scaling. But what about monitoring Kubernetes? While Kubernetes has the potential to dramatically simplify the act of deploying your application in containers – and across clouds – it also adds a new set of complexities for your day-to-day tasks, managing application performance, gaining visibility into services, and your typical monitoring -> alerting -> troubleshooting workflow. Legacy monitoring tools, collecting metrics from static targets, built for monitoring servers that you could name and services that didn’t change overnight, worked well past, but won’t work well today. This is why these tools fail at monitoring Kubernetes:1) Kubernetes increases infrastructure complexity
New layers of infrastructure complexity are appearing in the hopes of simplifying application deployments: dynamic provisioning via IaaS, automated configuration with configuration management tools, and lately, orchestration platforms like Kubernetes, which sit between your bare metal or virtual infrastructure and the services that empower your applications. This is why monitoring the Kubernetes health at the control plane is part of the job.2) Microservices architecture
In addition to increased infrastructure complexity, new applications are being designed for microservices, where the number of components communicating with each other has increased in an order of magnitude. Each service can be distributed across multiple instances, and containers move across your infrastructure as needed. This is why monitoring the Kubernetes orchestration state is key to understanding if Kubernetes is doing its job. Trust but verify that all the instances of your service are up and running.3) Cloud-native explosion and scale requirements
While we adopt cloud native architectures, the changes that they bring carry away an increased amount of smaller components. How does this affect Kubernetes monitoring methodology and tooling? As described on Site Reliability Engineering – How Google Runs Production Systems, “We need monitoring systems that allow us to alert for high-level service objectives, but retain the granularity to inspect individual components as needed.” The number of metrics simply explodes and traditional monitoring systems just cannot keep up. While we used to know how many instances we had of each service component and where they were located, that’s no longer the case. Now, metrics have high cardinality. Kubernetes adds some multidimensional levels, like cluster, node, namespace or service, so the different aggregations or perspectives that need to be controlled can explode; many labels that represent attributes from the logical groups of the microservices, to application version, API endpoint, specific resources or actions, etc. And the containers don’t last forever. In our latest container usage report, we found that 22% of the containers live for 10 seconds or less while 54% of them live less than five minutes. This creates a high level of churn. Labels like the container id or the pod name change all of the time, this is why we stop seeing ones while we need to deal with new ones. Now, take all the combinations of metric name and label together with the actual value and the timestamp. Over a small period of time you have thousands of data points, and even in a small size Kubernetes cluster, this will generate hundreds of thousands of time series. This can be millions for a medium-sized infrastructure. This is why Kubernetes monitoring tools need to be ready to scale to hundreds of thousands of metrics.4) It’s hard to see what’s inside containers
Containers are ephemeral, meaning once the container dies everything inside is gone. You cannot SSH or look at logs, and most of the tools you’re used to using for troubleshooting are not installed. They are great for operations as we can package and isolate applications to deploy them in a consistent way everywhere, but at the same time, this makes them blackboxes which are hard to troubleshoot. This is why monitoring tools that provide granular visibility through system calls tracing allow you to see down to every process, file or network connection that happened inside a container to troubleshoot issues faster. With these considerations in mind, now we can better understand why monitoring Kubernetes is very different from monitoring servers, VMs or even cloud instances.Use cases of Kubernetes monitoring
You might be wondering, why are we doing this after all? A Kubernetes cluster has multiple components and layers, and across each of them we will find different failure points that we need to monitor. These are some typical use cases for Kubernetes monitoring.Monitoring Kubernetes clusters and nodes
By monitoring the cluster, you get an across-the-board view of the overall platform health and capacity. Specific use cases can be among the following:- Cluster resource usage: is the cluster infrastructure underutilized? Or are we over capacity?
- Project and team chargeback: what is each project or team resource usage?
- Node availability and health: are enough nodes available to replicate our applications? Are we going to run out of resources?
Monitoring Kubernetes deployments and pods
Looking at the Kubernetes constructs like namespaces, deployments, ReplicaSets or DaemonSets, we can understand whether our applications have been properly deployed. For example:- Missing and failed pods: Are the pods running for each of our applications? How many pods are dying?
- Running vs. desired instances: How many instances for each service are actually ready? How many do you expect to be ready?
- Pod resource usage against requests and limits: Are CPU and memory requests and limits set? What is the actual usage against those?
Monitoring Kubernetes applications
But at the end of the day, your applications are what matter most. What is it that you want to look at here? This is the part which is similar to what you may be used to:- Application availability: is the application responding?
- Application health and performance: how many requests do we have? What’s the responsiveness or latency? Are we having any errors?
Kubernetes monitoring tools
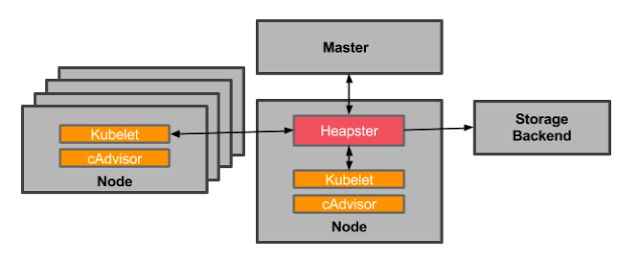
Like most platforms, Kubernetes has a set of rudimentary tools that allow you to monitor your platform, including the Kubernetes constructs that ride on top of physical infrastructure. The term “built-in” may be a little bit of an overstatement. It’s more fair to say that, given the extensible nature of Kubernetes, it’s possible for your inner tinkerer to add additional components to gain visibility into Kubernetes. Let’s run through the typical pieces of a Kubernetes monitoring setup:- cadvisor and heapster
- Kubernetes metrics server
- Kubernetes Dashboard
- Kubernetes kube-state-metrics
- Kubernetes liveness and readiness probes
- Prometheus for Kubernetes monitoring
- Sysdig Monitor for Prometheus monitoring scale
cadvisor and heapster
cadvisor is an open-source container resource usage collector. It’s purposefully built for containers and supports Docker containers natively. cadisor auto-discovers all containers in the given node and collects CPU, memory, filesystem and network usage statistics, although it is somehow limited in a couple of ways:- It only collects basic resource utilization – cadvisor cannot tell you how your applications are actually performing, only if a container has X% CPU utilization (for example).
- cadvisor itself doesn’t offer any long term storage or analysis capabilities.
Kubernetes metrics server
Starting from Kubernetes 1.8, the resource usage metrics coming from the kubelets and cadvisor are available through the Kubernetes metrics server API the same way Kubernetes API is exposed. This service doesn’t allow us to store values over time either, and lacks visualization or analytics. Kubernetes metrics server is used for Kubernetes advanced orchestration like Horizontal Pod Autoscaler for autoscaling.Kubernetes dashboard
The Kubernetes Dashboard provides a simple way to see your environment browsing through your Kubernetes namespaces and workloads. Kubernetes Dashboard gives you a consistent way to visualize some of this basic data, with only basic CPU / memory data available. You can also manage and take action from this dashboard, which has been a security concern on multi-tenant clusters as proper RBAC privileges need to be set up.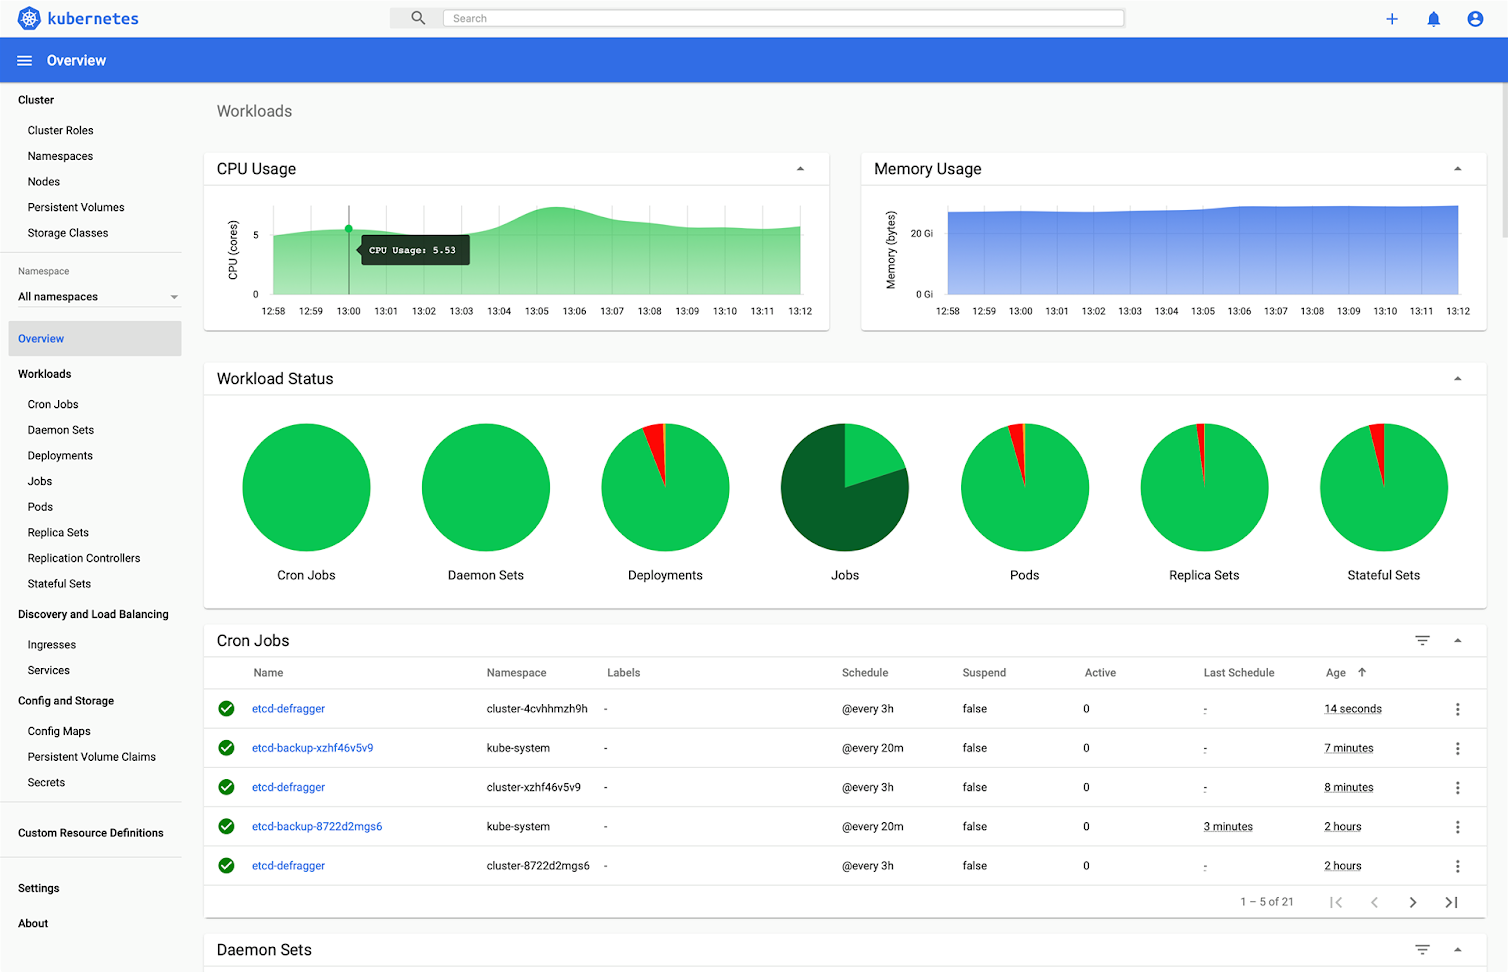
Kubernetes kube-state-metrics
Another component that you definitely want to consider is kube-state-metrics. It’s an add-on service that runs alongside your Kubernetes metrics-server that polls the Kubernetes API and translates characteristics about your Kubernetes constructs into metrics. Some questions kube-state-metrics would answer are:- How many replicas did I schedule? And how many are currently available?
- How many pods are running / stopped / terminated?
- How many times has this pod restarted?
Kubernetes liveness and readiness probes
Kubernetes probes perform the important function of regularly monitoring the health or availability of a pod. Kubernetes monitoring probes allows you to arbitrarily define “Liveness” through a request against an endpoint or running a command. Below is a simple example of a liveness probe based on running a cat command:Prometheus for Kubernetes monitoring
Prometheus is a time series database, open source and, like Kubernetes, is a CNCF project. But Prometheus monitoring is an entire monitoring stack around Prometheus server that collects and stores the metrics. This includes Grafana for dashboarding, and often a number of exporters: small sidecar containers that transform services metrics into Prometheus metrics format.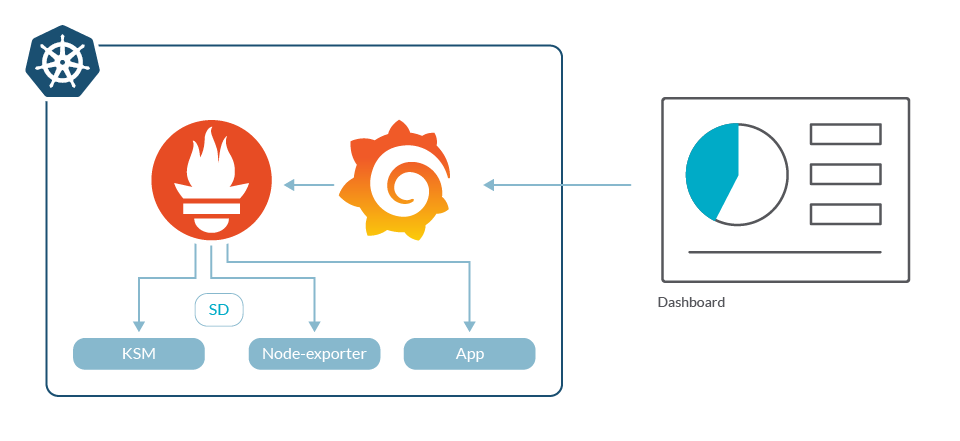
Sysdig Monitor for Prometheus monitoring at scale
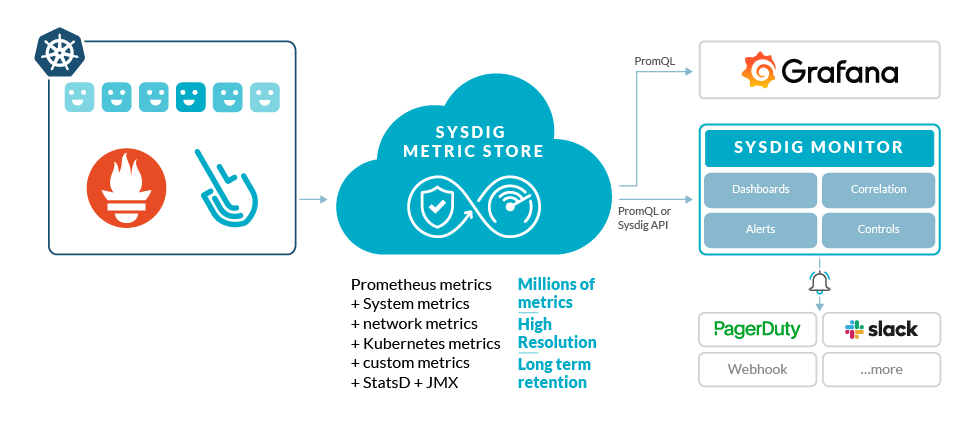 Sysdig Monitor and Sysdig backend are able to store and query Prometheus native metrics and labels. Additionally, users can use Sysdig in the same way that they use Prometheus. You can leverage Prometheus Query Language queries for dashboards and alerts, or the Prometheus API for scripted queries, as part of a DevOps workflow. This way, your investments in the Prometheus ecosystem can be preserved and extended while improving scale and security. Users can take advantage of the troubleshooting, correlation and support that we provide as part of Sysdig Monitor for a complete Prometheus monitoring solution.


