


Falco Feeds extends the power of Falco by giving open source-focused companies access to expert-written rules that are continuously updated as new threats are discovered.

07:00: Starting the day
I open my laptop and look over my cases while I slurp down my first cup of coffee. Most of my backlog is waiting on customer updates, or bug fixes. Two of my cases have been marked for closure. Not a bad start for a Monday!
A pod CrashLoopBackoff issue was resolved by bumping up memory requests, and the missing metrics issue was solved after applying some Prometheus annotations to the customer's nginx pods. I notate and close both cases.
No sooner do I hear the beep of the badge scanner. People are trickling in, and the office will soon be buzzing with chattering colleagues helping their customers, sales engineers chatting with new prospects, and the constant ringing of the gong when new deals are landed.
09:35: An alert in the system
A case hits the queue that strikes me as interesting. The customer reports that they receive alerts for slow SQL queries. The alerts aren't being triggered for all queries, but rather only a small subset.
From the customer's perspective, these queries are completed in microseconds. However, Sysdig is reporting them as taking longer than 3 seconds to complete.
I check the configuration of their alert:
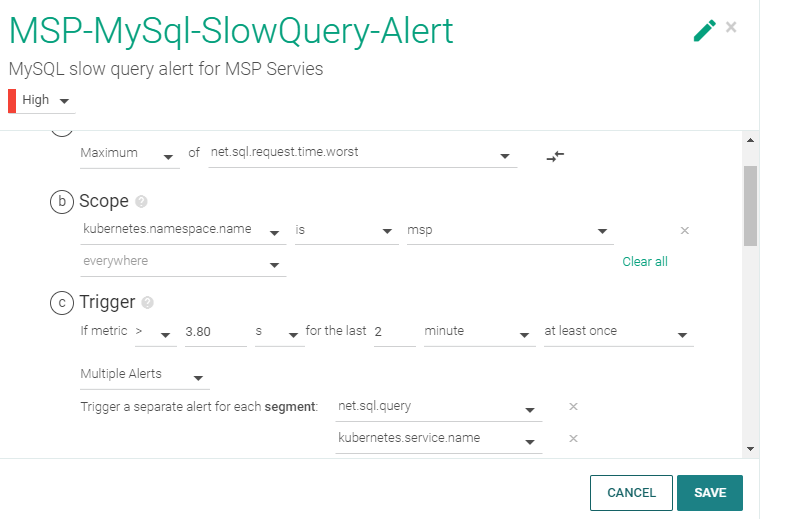
"OK, pretty straight forward" I think.
Any time the metric net.sql.request.time.worst is above 3.8 seconds in the "msp" namespace, fire an alert, and segment the alert by query and service name. I ask the customer to supply the query that they're running. They supplied the query name, and provided some additional details.
"This second query takes 0.04 seconds to complete. Why do we get continuous alerts? Any assistance is appreciated"
I review the capture, and find that the query in question is consistently reported above the 3.8 second threshold. I explain to the customer that our method of measuring query time is: we start the timer when the query is executed from user space, and stop our timer when the kernel returns a result to the user space.
The customer maintains:
"As per our logs, application sent request to Database at 2022-03-05T11:41:00.000″ and received response at 2022-03-05T11:41:00.298000+0100″ and this means there is no delay here. The query is fast with no network issues, and the query runtime is 0.003000 seconds".
10:15: The plot thickens
I'm going to need more data to understand how long these queries are truly taking.
I ask the customer to gather a Sysdig capture. This capture would contain anything and everything I'd want to know about what's happening on a machine. Syscalls, processes, CPU time…everything. If there's one thing we live by at Sysdig, it's that syscalls don't lie.
The customer sends over the capture file, and I load it into Sysdig Inspect. It becomes clear to me that the SQL server is measuring the completion time of the first response, however, it turns out that the full payload of the query was returned after 4 seconds, which means the alert sent by Sysdig is valid.
The following screenshots of the capture show the traffic filtered between the hosts in question on port 3306:
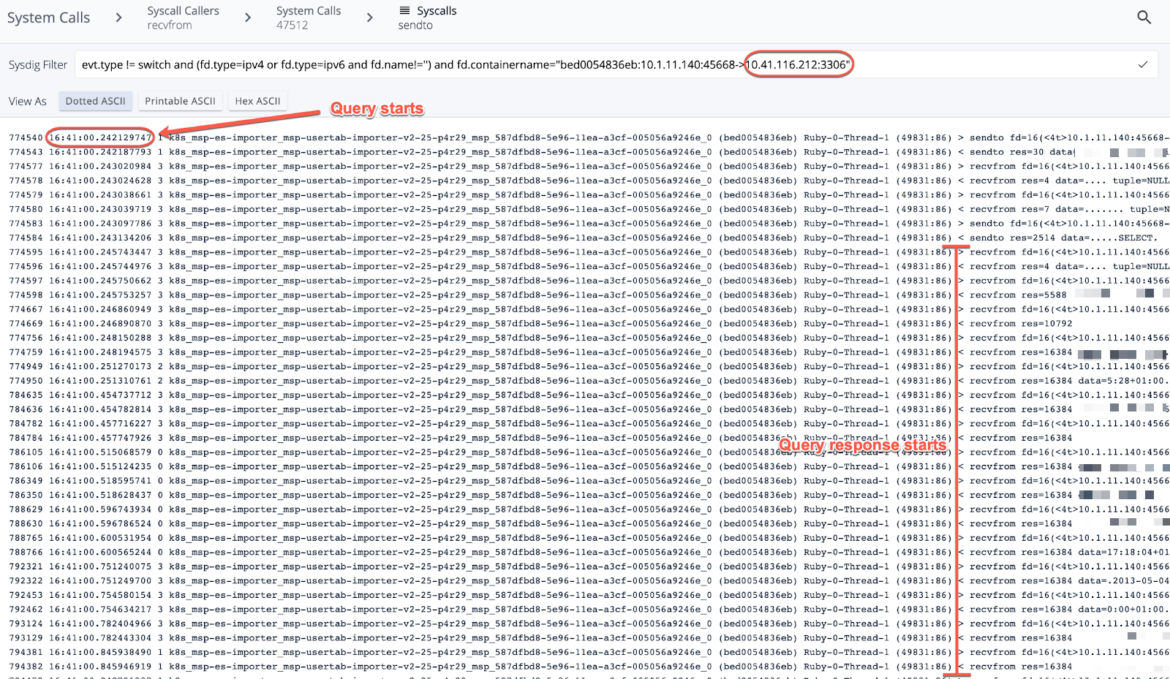
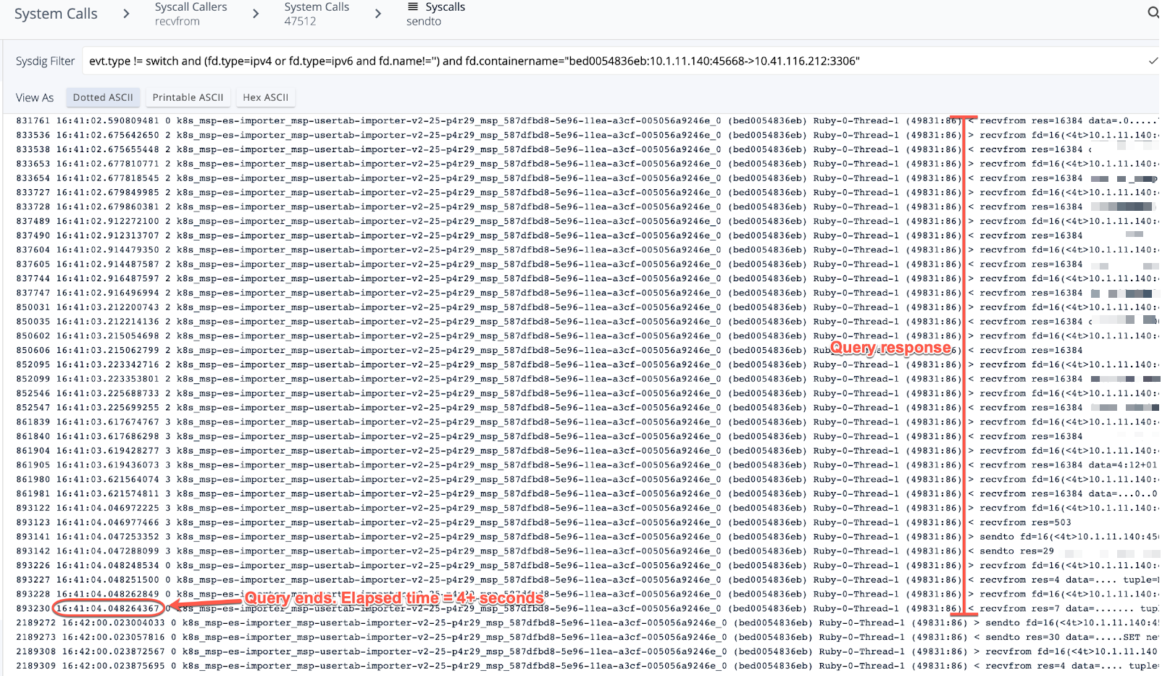
This query runs every minute, and this particular query kicked off at 16:41:00, and finished at 16:41:04. I relayed this to the customer, and the explanation was well received.
Case closed! I write up a knowledge base article so that my colleagues can follow this workflow with future customers.
13:00: You say "go", Sysdig says "stop"!
Upon returning from lunch, I see another interesting case, and decide to take it on. A customer is looking to stop golang from being used in an environment. That should be easily achievable with Falco Rules. To test, I spin up a VM, install a Sysdig agent, and connect it to the backend.
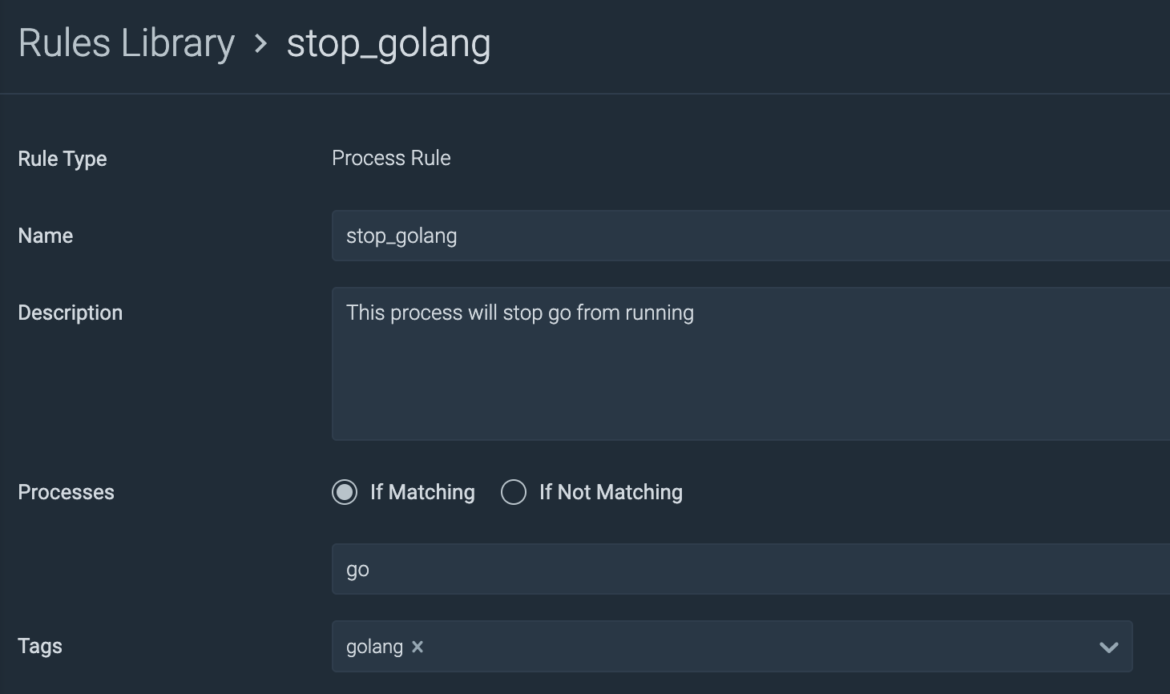
In Sysdig Secure I create a new process rule:
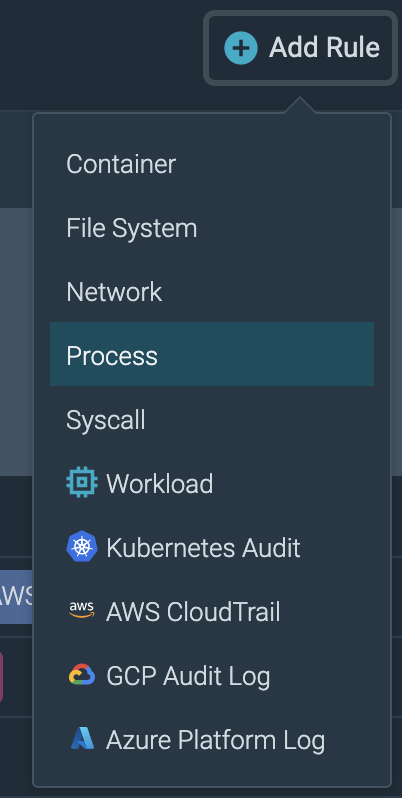
The rule is simple: If a process name matches "go", kill that process:
I import the rule into a new policy:
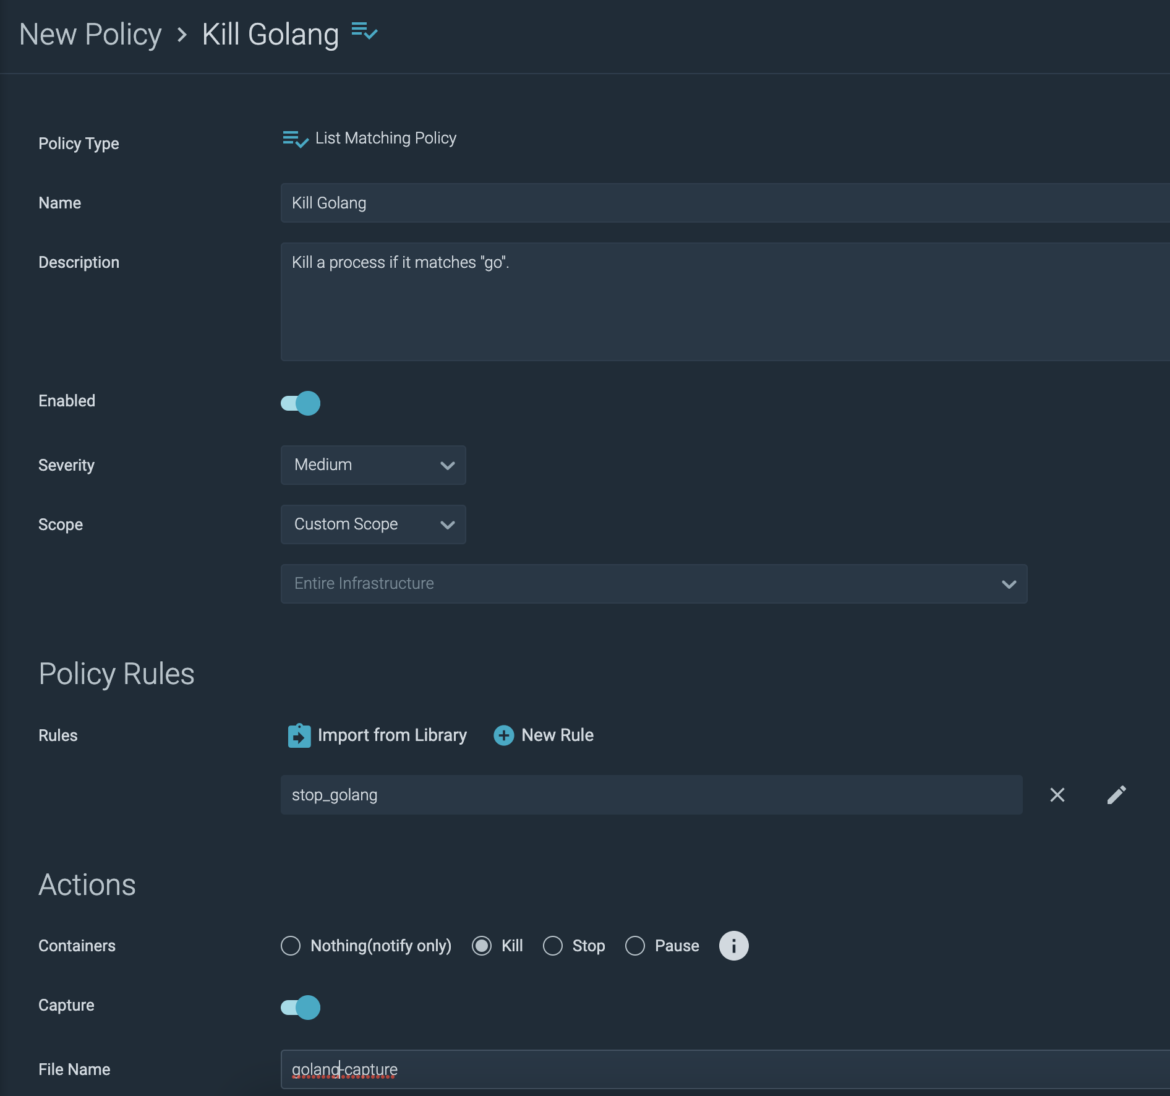
So now, not only will the go process be terminated anywhere in my environment, but I will get a capture of the event. This gives me useful information such as which user ran the process, and where.
From my VM where the agent is running, I install golang within a docker container. To test my policy I spawn a shell into my go container, and run "go version". As expected, my terminal comes to a screeching halt. Pleased with the results, I forward this information on to my customer.
Sysdig is an amazing application, and I love helping our customers use it to achieve their goals, and explain the unknown. It truly is the swiss army knife of both security and observability.
These are just a small subset of the questions that our customers bring to the table, and we on the Customer Reliability Engineering team love the challenges that come along with them.
Sysdig gives us the power to dig deeper!