


Falco Feeds extends the power of Falco by giving open source-focused companies access to expert-written rules that are continuously updated as new threats are discovered.

As Kubernetes adoption continues to grow, Kubernetes audit logs are a critical information source to incorporate in your Kubernetes security strategy. It allows security and DevOps teams to have full visibility into all events happening inside the cluster.
The Kubernetes audit logging feature was introduced in Kubernetes 1.11. It's a key feature in securing your Kubernetes cluster, as the audit logs capture events like creating a new deployment, deleting namespaces, starting a node port service, etc.
In this article, you will learn what the Kubernetes audit logs are, what information they provide, and how to integrate them with Falco (open-source runtime security tool) to detect suspicious activity in your cluster.
"Learn how to integrate the #Kubernetes audit log with a runtime security tool, like @falco_org 🦅, to detect and block threats. 🛡"
The benefits of Kubernetes audit log
By integrating Kubernetes audit logs, you can answer questions like:
- What happened? What new pod was created?
- Who did it? The user, user groups, or service account.
- When did it happen? The event timestamp.
- Where did it occur? The namespace that the pod was created in.
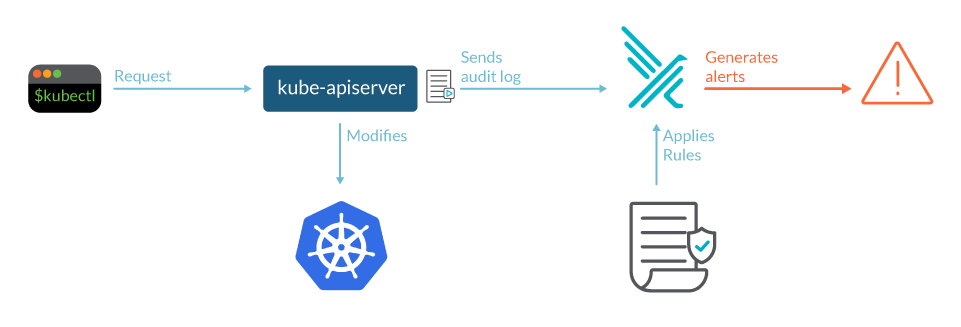
In a Kubernetes cluster, it is the kube-apiserver who performs the auditing. When a request, for example, creates a namespace, it's sent to the kube-apiserver.
If an attacker, or a careless administrator, screws with the cluster, the actions will be registered in the audit log. Your security tools can parse the events in this log and alert you on suspicious activity.
Each request can be recorded with an associated stage. The defined stages are:
- RequestReceived: The event is generated as soon as the request is received by the audit handler without processing it.
- ResponseStarted: Once the response headers are sent, but before the response body is sent. This stage is only generated for long-running requests (e.g., watch).
- ResponseComplete: The event is generated when a response body is sent.
- Panic: Event is generated when panic occurs.
Now, let's see this in practice. We'll show how to introduce a Kubernetes audit policy and enable Kubernetes auditing.
Kubernetes audit policy: An example
A Kubernetes cluster is full of activity, so it's not feasible nor practical to record all of it. An audit Policy allows you to filter the events and record only the ones you desire.
With security in mind, we'll create a policy that filters requests related to pods, kube-proxy, secrets, configurations, and other key components.
Such a policy would look like:
apiVersion: audit.k8s.io/v1 # This is required.
kind: Policy
# Don't generate audit events for all requests in RequestReceived stage.
omitStages:
  - "RequestReceived"
rules:
  # Log pod changes at RequestResponse level
  - level: RequestResponse
    resources:
    - group: ""
      # Resource "pods" doesn't match requests to any subresource of pods,
      # which is consistent with the RBAC policy.
      resources: ["pods"]
  # Only check access to resource "pods"
  - level: Metadata
    resources:
    - group: ""
      resources: ["pods/log", "pods/status"]
  # Don't log watch requests by the "system:kube-proxy" on endpoints or services
  - level: None
    users: ["system:kube-proxy"]
    verbs: ["watch"]
    resources:
    - group: "" # core API group
      resources: ["endpoints", "services"]
  # Don't log authenticated requests to certain non-resource URL paths.
  - level: None
    userGroups: ["system:authenticated"]
    nonResourceURLs:
    - "/api*" # Wildcard matching.
    - "/version"
  # Log the request body of configmap changes in kube-system.
  - level: Request
    resources:
    - group: "" # core API group
      resources: ["configmaps"]
    # This rule only applies to resources in the "kube-system" namespace.
    # The empty string "" can be used to select non-namespaced resources.
    namespaces: ["kube-system"]
  # Log configmap and secret changes in all other namespaces at the Metadata level.
  - level: Metadata
    resources:
    - group: "" # core API group
      resources: ["secrets", "configmaps"]
  # A catch-all rule to log all other requests at the Metadata level.
  - level: Metadata
    # Long-running requests like watches that fall under this rule will not
    # generate an audit event in RequestReceived.
    omitStages:
      - "RequestReceived"
One way to apply these rules, as well as enabling Kubernetes auditing, is to to pass the --audit-policy-file flag when starting kube-apiserver along with the audit policy file you defined.
As you can see, you can configure multiple audit rules in a single Kubernetes audit Policy.
The fields that define each audit rule are:
level: The audit level defining the verbosity of the event.resources: The object under audit (e.g., "ConfigMaps").nonResourcesURL: A non resource Uniform Resource Locator (URL) path that is not associated with any resources.namespace: Specific objects within a namespace that are under audit.verb: Specific operation for audit – create, update, delete.users: Authenticated user that the rule applies to.userGroups: Authenticated user group the rule applies to.omitStages: Skips generating events on given stages.
The audit level defines how much of the event should be recorded. There are four audit levels:
- None: Don't log events that match this rule.
- Metadata: Logs request metadata (requesting user, timestamp, resource, verb, etc.) but does not log the request or response bodies.
- Request: Log event metadata and request body but not response body. This does not apply for non-resource requests.
- RequestResponse: Log event metadata, request, and response bodies. This does not apply for non-resource requests.
Be aware that when an event is processed and compared against the audit Policy rules, the first matching rule sets the audit level of the event. This is unlike Kubernetes and RBAC policies, where the rules are applied accordingly to the most restrictive one.
Configuring Falco as an audit backend to receive events
You cannot react to threats on time if the logs are just sitting there, waiting for a forensic investigation.
Integration with a security tool, like a Host Intrusion Detection (HIDS), will unleash all of the audit log potential.
You can integrate the Kubernetes audit log with security tools by sending the events in one of two ways:
- Log backend: Writes the events into the filesystem. If your security tool is installed in the same machine it can parse the files. You can also manually process the files with a json parser, like
jq, and build up some queries. - Webhook backend: Sends the events to an external HTTP API. Then, your security tool doesn't need access to the filesystem; or, you could have a single security tool instance protecting several
kube-apiserver.
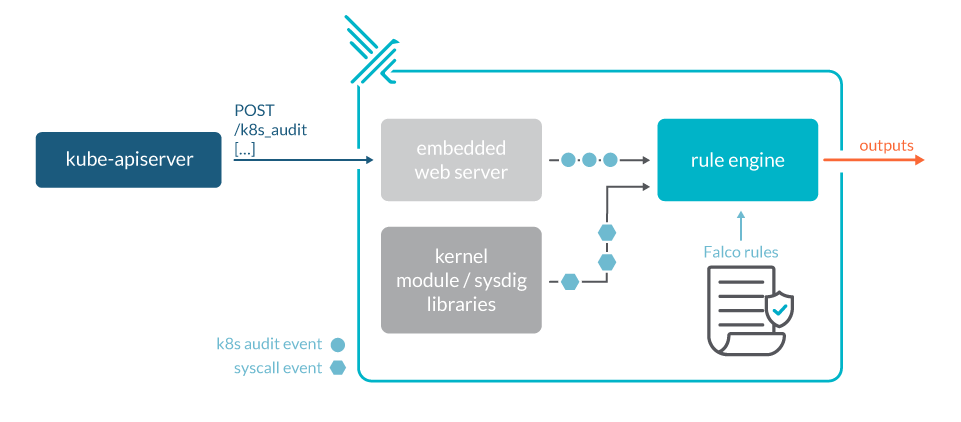
For the following examples we'll use the webhook backend, sending the events to Falco.
Falco, the open-source cloud-native runtime security project, is the de facto Kubernetes threat detection engine. Falco was created by Sysdig in 2016 and is the first runtime security project to join CNCF as an incubation-level project. Falco detects unexpected application behavior and alerts on threats at runtime. By tapping into Sysdig open-source libraries through Linux system calls, it can run in high performance production environments.
Falco, as a webhook backend, will ingest Kubernetes API audit events and provide runtime detection and alerting for our orchestration activity. Falco ships with a comprehensive set of out-of-the-box rules, that will help you get started on detecting the most common threats. You can easily customize those rules or create your own ones to adapt Falco to your organization needs.
The following example kube-apiserver configuration would set Falco as a backend webhook:
    apiVersion: v1
    kind: Config
    clusters:
    - name: falco
     cluster:
       server: http://$FALCO_SERVICE_CLUSTERIP:8765/k8s_audit
    contexts:
    - context:
       cluster: falco
       user: ""
     name: default-context
    current-context: default-context
    preferences: {}
    users: []
The URL endpoint in the server field is the remote endpoint that the audit events will be sent to.
To enable the webhook backend, you need to set the --audit-webhook-config-file flag with the webhook configuration file.
On versions 1.13 to 1.18 of Kubernetes, the webhook backend can be also configured dynamically via the AuditSink object. Note that this feature has been removed since 1.19.
End-to-end example
Now that we have the audit policy defined and our webhook backend is configured to send Kubernetes audit logs to Falco, let's give them life!
We can post a configmap, like the example below, into the Kubernetes API:
apiVersion: v1
data:
 ui.properties: |
   color.good=purple
   color.bad=yellow
   allow.textmode=true
 access.properties: |
   aws_access_key_id = MY-ID
   aws_secret_access_key = MY-KEY
kind: ConfigMap
metadata:
 name: my-config
 namespace: default
Running:
> kubectl create -f badconfigmap.yamlIt triggers the following out-of-the-box rule (you can check the full list of rules on GitHub):
- rule: Create/Modify Configmap With Private Credentials
  desc: >
     Detect creating/modifying a configmap containing a private credential (aws key, password, etc.)
  condition: kevt and configmap and kmodify and contains_private_credentials
  exceptions:
    - name: configmaps
      fields: [ka.target.namespace, ka.req.configmap.name]
  output: K8s configmap with private credential (user=%ka.user.name verb=%ka.verb configmap=%ka.req.configmap.name config=%ka.req.configmap.obj)
  priority: WARNING
  source: k8s_audit
  tags: [k8s]
If we look now at the Falco log (your pod name will be different):
> kubectl tail -f falco-b4ck9We should see the following alert/detection:
Warning Kubernetes configmap with private credential (user=minikube-user verb=create configmap=my-config config={"access.properties":"aws_access_key_id=MY-ID aws_secret_access_key=MY-KEY","ui.properties":"color.good=purple color.bad=yellow allow.textmode=true"})Conclusion
In order to enhance your Kubernetes security strategy, it is important to be attentive to new features and improvements, incorporating those that will let you gain visibility into suspicious events or misconfigurations like Kubernetes audit log events.
The information gathered in these logs can be very useful to understand what is going on in our cluster, and can even be required for compliance purposes.
Tuning the rules with care and using less verbose mode when required can also help us lower costs when using a SaaS centralized logging solution.
But what really makes a difference here is the use of Falco as a threat detection engine. Choosing it to be your webhook backend is the first step towards enforcing Kubernetes security best practices, detecting misuse, and filling the gap between what you think the cluster is running and what's actually running.
If you would like to find out more about Falco:
- Get started in Falco.org.
- Check out the Falco project in GitHub.
- Get involved Falco community.
- Meet the maintainers on the Falco Slack.
- Follow @falco_org on Twitter.
At Sysdig Secure, we extend Falco with out-of-the-box rules, along with other open source projects, making them even easier to work with and manage Kubernetes security. Register for our Free 30-day trial and see for yourself!