


Falco Feeds extends the power of Falco by giving open source-focused companies access to expert-written rules that are continuously updated as new threats are discovered.

Are you an OSS Prometheus, Grafana, and Alert Manager user thinking about migrating to Sysdig Monitor, and don't know about the transition details? Are you wondering what the benefits are of using Sysdig Monitor instead of DIY Prometheus, Grafana, and Alert Manager? If so, then this article is for you!
Sysdig Monitor is a SaaS cloud-native observability platform that offers not only the same, but much more than OSS Prometheus, Grafana, and Alert Manager. Thanks to Sysdig, you can take your burden off monitoring and troubleshooting issues in Kubernetes and cloud environments. Benefit from a great onboarding experience, and in a few minutes you'll be ready to monitor your whole infrastructure. You won't need to worry about maintenance, scalability, or performance issues in your observability platform, Sysdig takes care of it.
In this blog post, you'll learn more about things to have in mind when migrating from OSS Prometheus, Grafana, and Alert Manager to Sysdig Monitor. You'll soon realize that the process itself is quite easy. In most cases, you just need to rely on what Sysdig Monitor provides out of the box.
Benefits of using Sysdig Monitor instead of DIY Prometheus, Grafana, and Alert Manager
As we already mentioned, Sysdig Monitor has the same capabilities (and much more) as the OSS Prometheus, Grafana, and Alert Manager bundle. When migrating from the OSS stack to Sysdig, you won't lose any of your current functionalities, and it's actually the other way around. You'll soon realize the huge catalog of features that Sysdig provides out of the box.
Let's talk briefly about what Sysdig Monitor brings to its customers:
- A unified portal to monitor and troubleshoot your Kubernetes and Cloud environments. Not only your Kubernetes, OpenShift, and Rancher clusters, but you can also observe the main Cloud providers like AWS, Azure ,and GCP. You can monitor all your cloud environments from a single pane of glass.
- An enterprise-managed service for Prometheus. Avoid headaches and let Sysdig take care of scalability, performance, and long-term storage for your Kubernetes and Prometheus metrics.
- Sysdig comes with Advisor to help you troubleshoot issues in your Kubernetes environments.
- Cost Advisor is a tool that helps you reduce your wasted spending. Identify the areas in which you are overspending and apply suggested remediation steps to rightsize your workloads.
- Kubernetes control plane components are monitored out of the box. Sysdig pulls this data for you and provides dashboards and alerts for every control plane component from the very beginning.
- You can still have your own DIY Prometheus instance if you want, but it is not necessary anymore with Sysdig! Sysdig Agent has a lightweight Prometheus instance embedded. Everything you need is managed by the agent.
- You don't need to worry about Prometheus exporters, Sysdig provides its own Prometheus exporters for third-party software. You won't need to waste time choosing and testing Prometheus exporters. Sysdig maintains and provides the best exporters for you.
- Besides OSS Prometheus and Prometheus exporters, there is no need to deploy, configure, and manage other software like Grafana, Alert Manager, KSM, or node exporter. With Sysdig, you only need to deploy the Sysdig Agent.
- As soon as the Sysdig Agent is running, log into the Sysdig Monitor portal and start consuming your metrics right away, all your data available for you. Tons of out-of-the-box dashboards and alerts are provided from the very beginning. You monitor not only your Kubernetes environment and cloud providers, but your own workloads, applications, and other third-party applications.
- Sysdig Agent leverages eBPF to pull metrics and infrastructure data like the Kernel syscalls. Dig deeper into your Kubernetes issues thanks to the Kernel insights provided out of the box.
- Explore your metrics on your own thanks to the PromQL explorer, and benefit from the metrics enrichment. Your metrics now gain Kubernetes and Cloud context.
- Use remote write to push metrics from your endpoints to the Sysdig managed service for Prometheus as you do with DIY Prometheus.
- Ingest metrics every 10 seconds instead of the default 60 seconds in DIY Prometheus.
The following table aims to clearly show the differences between both approaches.
(1) While Grafana provides a huge dashboard library, those are diverse and maintained by the community. Sysdig Monitor offers a curated and opinionated set of out-of-the-box dashboards available from the very beginning.
Sysdig Agent vs. Prometheus
In short, as was mentioned, the Sysdig Agent has a lightweight Prometheus instance embedded. Thus, the same you do with your DIY Prometheus instance can be done with the Sysdig Agent. Avoid maintaining and supporting your DIY Prometheus, Grafana, and Alert Manager stack. Take the burden off by letting Sysdig take care of scalability, availability, performance, and long-term storage for your data retention.
In addition, the agent brings a set of eBPF integrations, which allows Sysdig to pull not only Kubernetes and Prometheus metrics, but also Kernel syscalls, and other infrastructure specific metrics and data. All the metrics are processed and enriched with Kubernetes and cloud context. That way, Sysdig users can easily correlate their own workloads and custom metrics with Kubernetes events and other infrastructure or cloud data. Sysdig Agent gives you more: Kubernetes control plane metrics, Kubernetes events, out-of-the-box system metrics, automatic integrations, lower metrics and data ingestion interval, and much more.
If you want to learn more about the benefits of using the Sysdig Agent instead of DIY Prometheus, check out this article.
KSM, node exporter, and cAdvisor metrics migration
Most of the users running and maintaining their own OSS Prometheus along with Grafana and Alert manager, relies on KSM, Prometheus node exporter, and cAdvisor to get insights about their Kubernetes clusters. New Sysdig customers may wonder which path they should take when moving from their current OSS environment to Sysdig Monitor.
Do you want to learn more? Keep reading and discover how to move to Sysdig Monitor.
KSM metrics
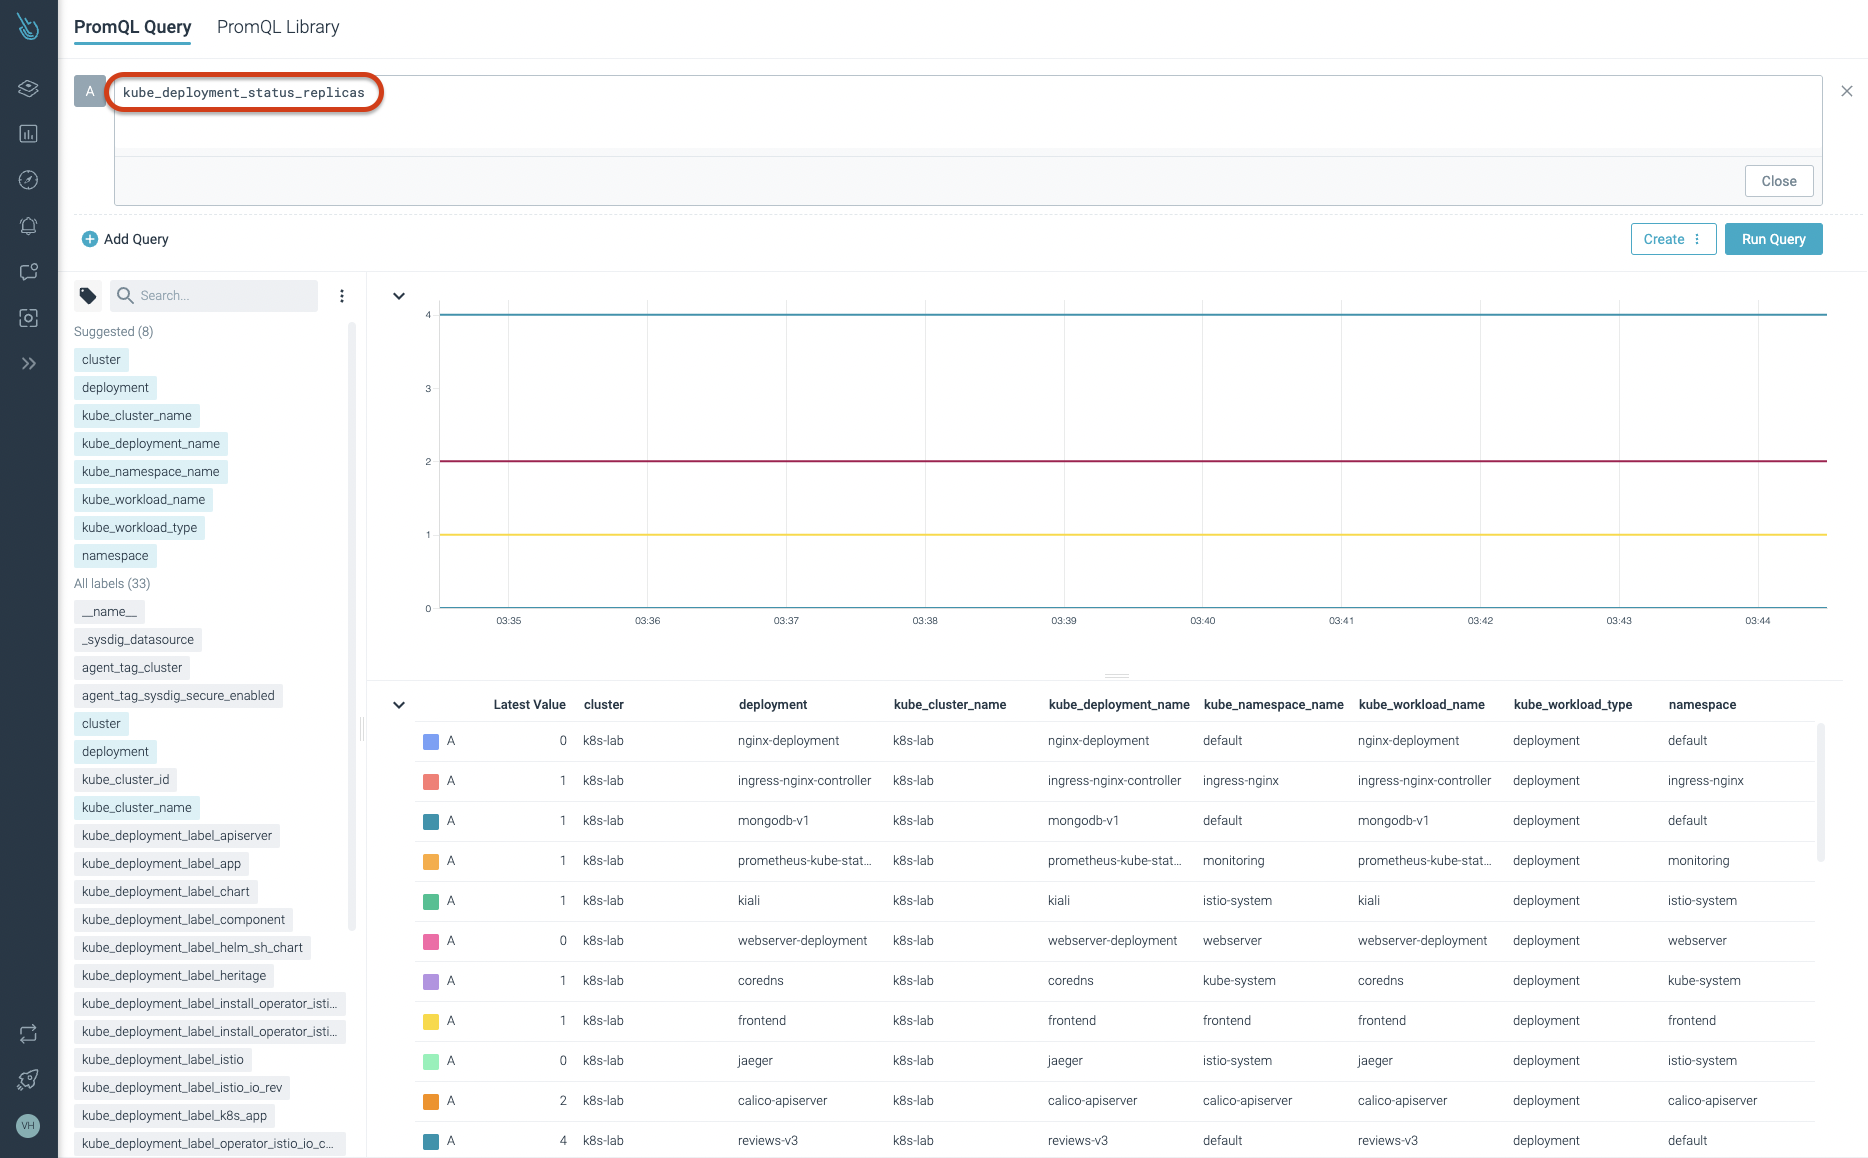
When it comes to OSS KSM metrics, those are almost identical to what Sysdig Monitor provides out of the box. Users already using DIY Prometheus along with KSM can migrate their own dashboards, alerts, or other metric-related configurations. As you can see in the following picture, OSS KSM metric names are consistent across Sysdig Monitor.
Anyway, thanks to the out-of-the-box KSM metrics and dashboards in Sysdig Monitor, you won't need to migrate or create new dashboards. Those are already provided and accessible from the very beginning.
Also, Sysdig offers a set of labels in KSM to identify easily the workload (DaemonSet, Deployment, StatefulSet, etc.) that a pod or container belongs to. This makes it easy to troubleshoot problems without having to know the kind of workload that you are investigating, saving time and effort, especially in critical situations.
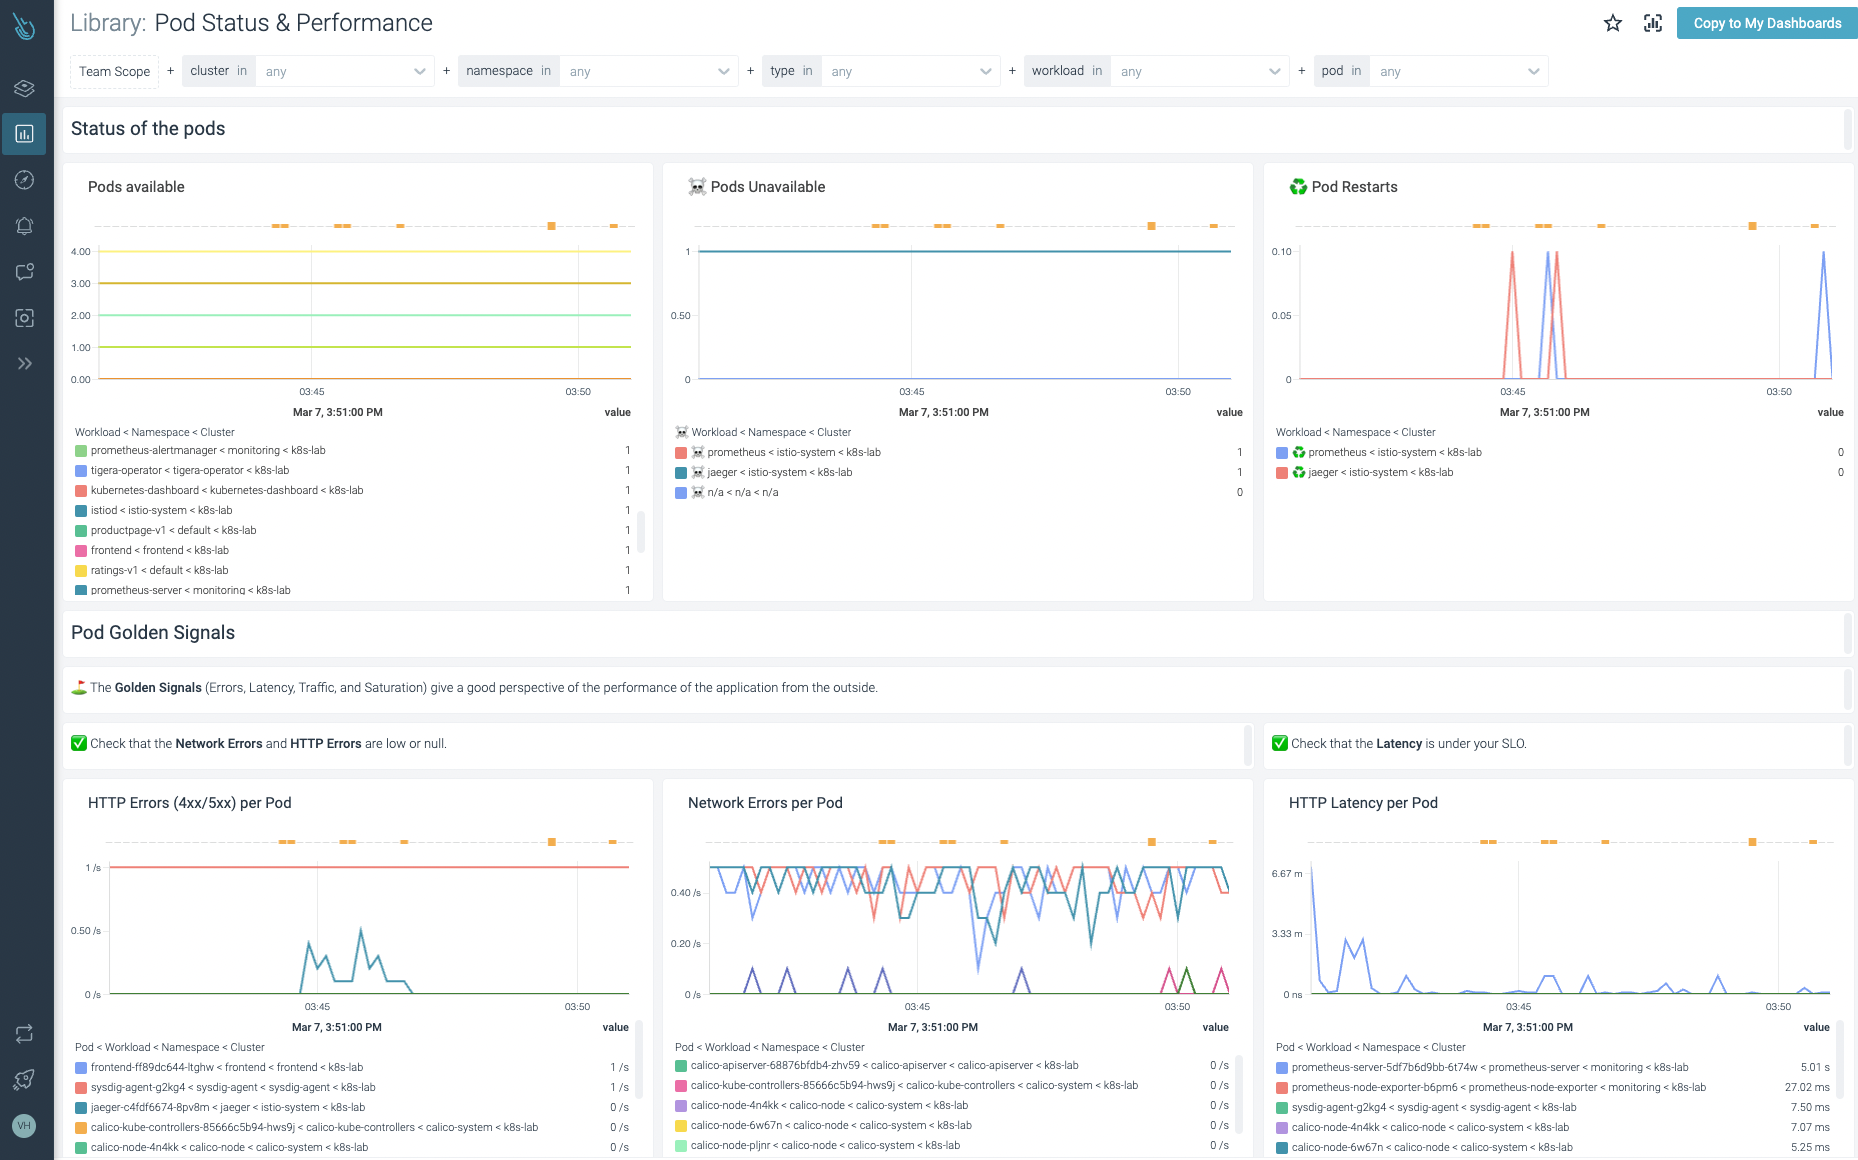
For example, this is how a Pod Status & Performance dashboard looks, showing out-of-the-box KSM metrics.
Node exporter metrics
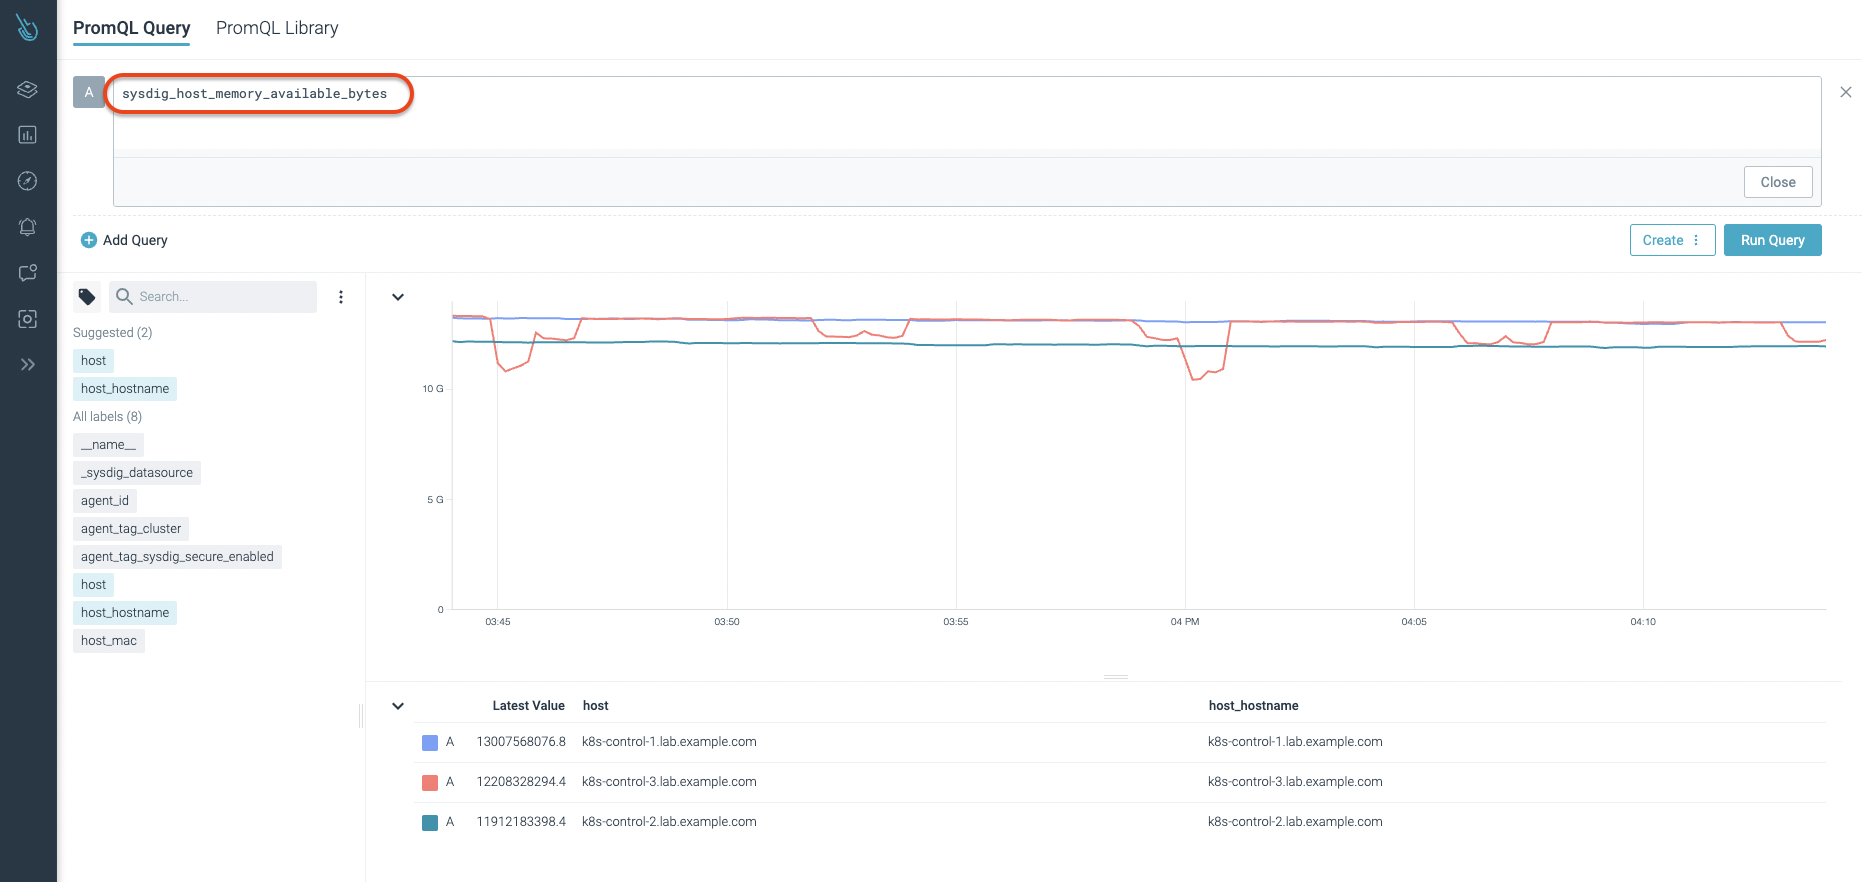
Sysdig's node metrics names are different from the OSS node exporter metrics. As discussed earlier, Sysdig collects its own set of metrics from Kubernetes nodes, plus other Kernel related data from syscalls. Those are converged into metrics automatically. For that reason, Sysdig uses its own naming convention.
For example, the node_memory_MemAvailable_bytes equivalent metric you get from the OSS node exporter is sysdig_host_memory_available_bytes in Sysdig Monitor.
Sysdig Monitor comes with a lot of out-of-the-box dashboards for node exporter equivalent and related metrics. Here is an example of how Sysdig customers can easily monitor node status and performance with the out-of-the-box dashboards.
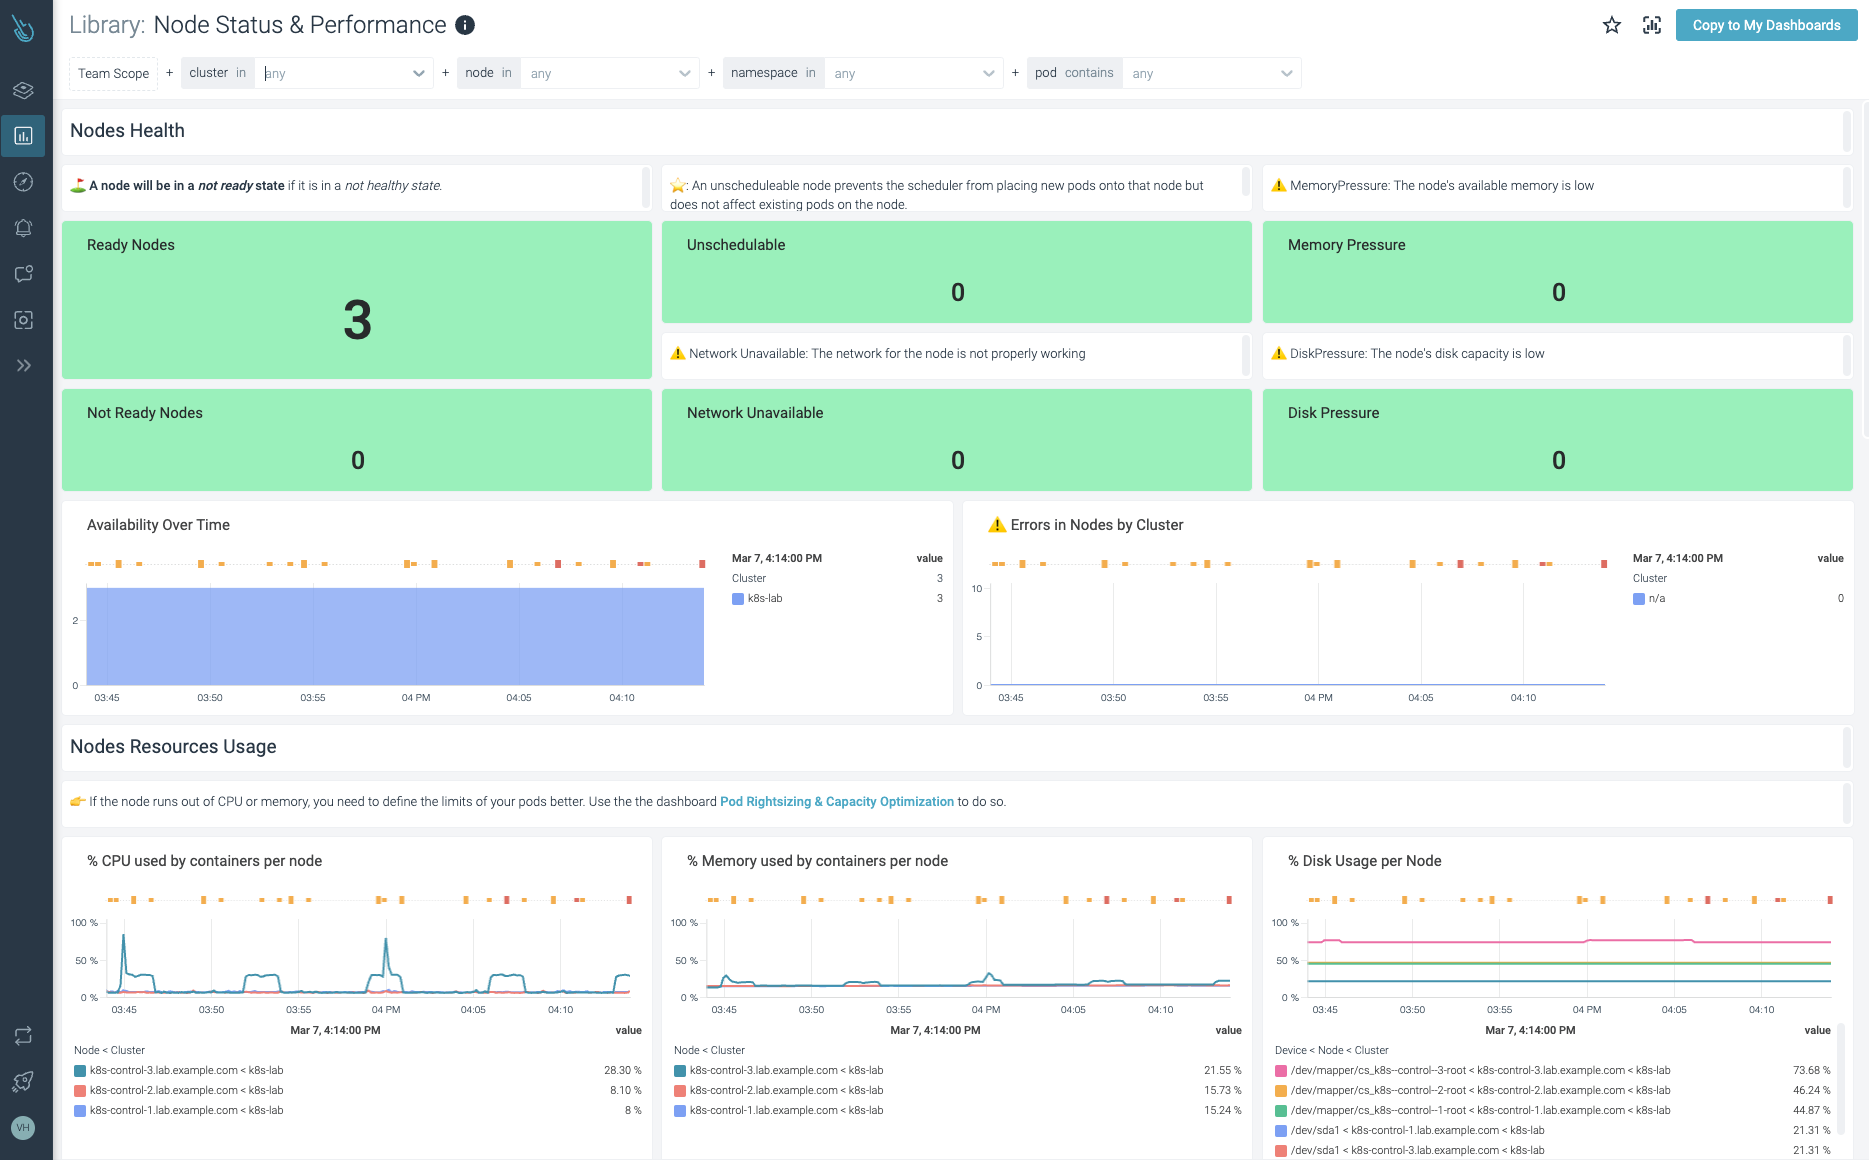
Sysdig covers the same use cases as the OSS Prometheus node exporter. Like KSM metrics, migrating or creating new dashboards for node exporter related metrics shouldn't be necessary. The out-of-the-box dashboards in Sysdig Monitor cover most user needs already.
cAdvisor metrics
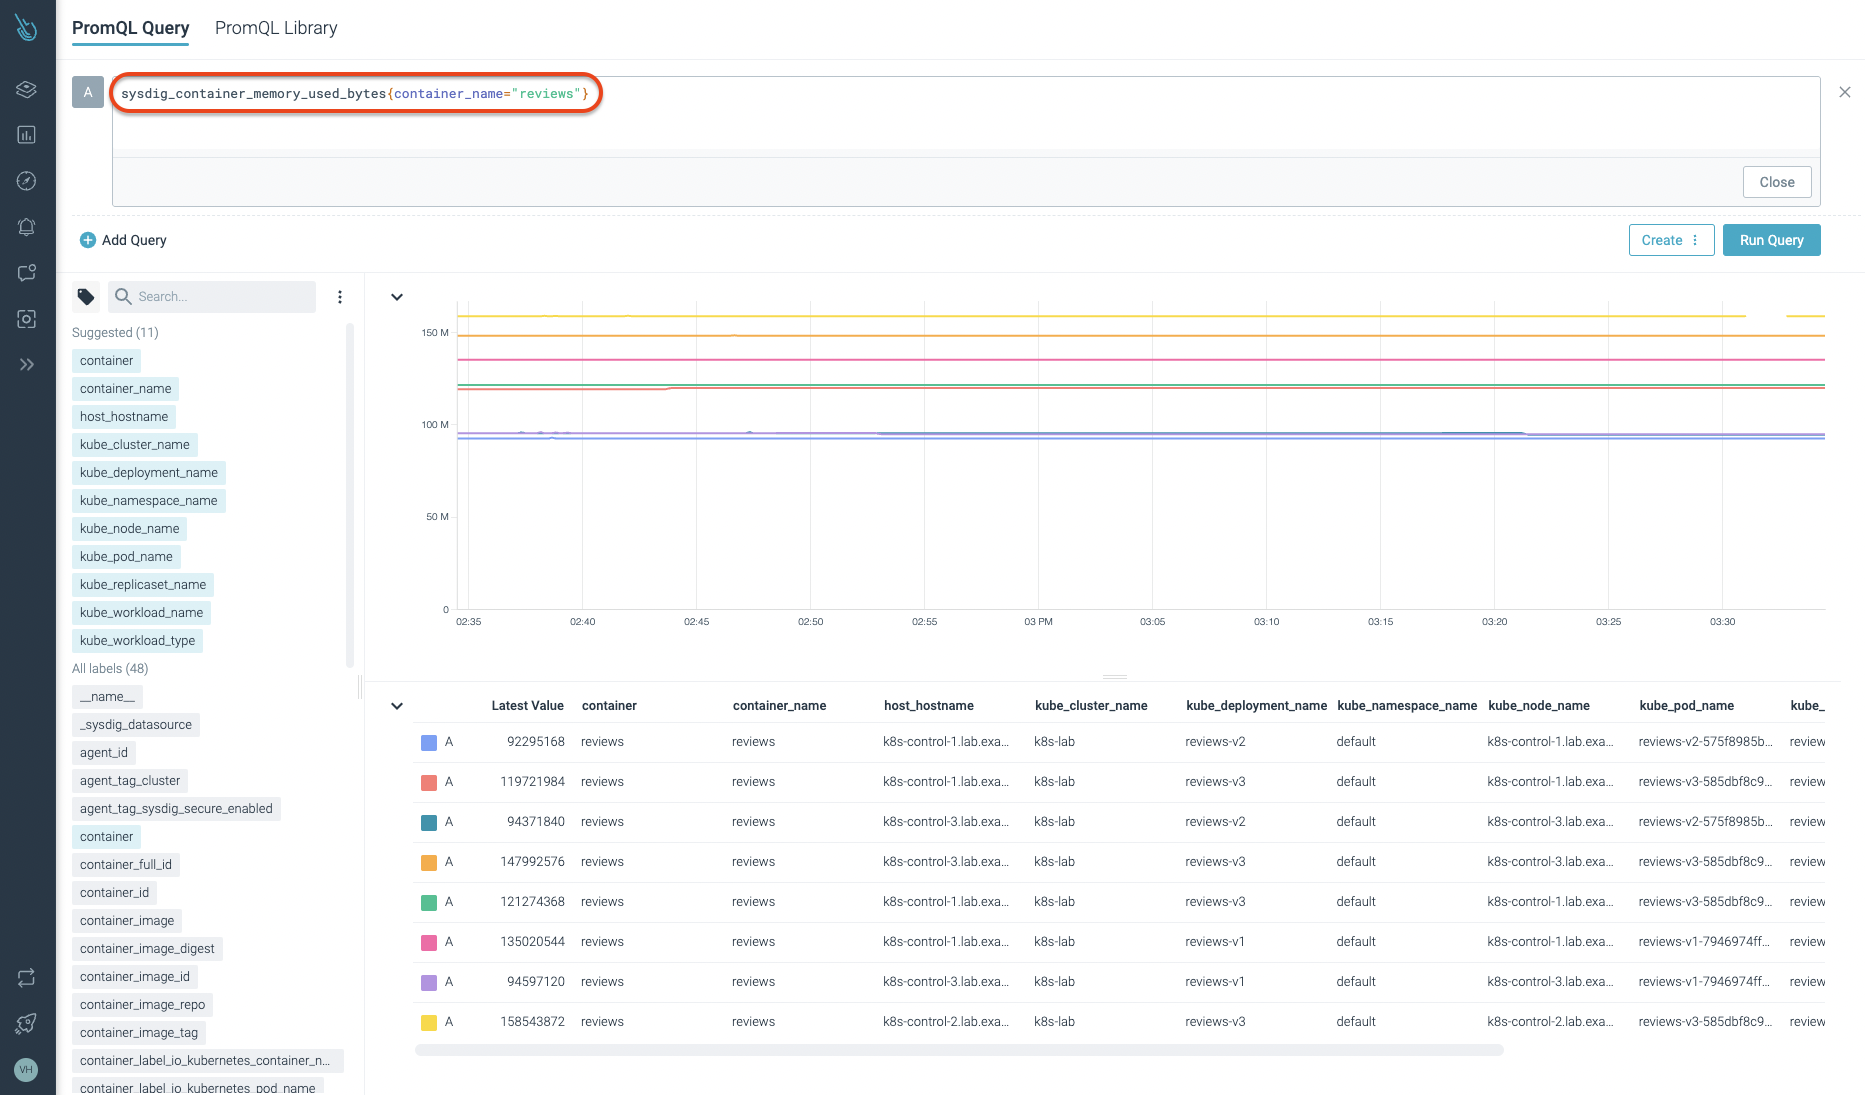
Sysdig Monitor has its own set of metrics for cAdvisor data as well. For example, the equivalent container_memory_usage_bytes metric you can find in OSS cAdvisor is sysdig_container_memory_used_bytes in Sysdig.
In addition, with Sysdig Monitor you can even dig deeper and get more granular information, like the memory consumed by a process. The following pictures show how you can get such data thanks to the sysdig_program_memory_used_bytes metric.
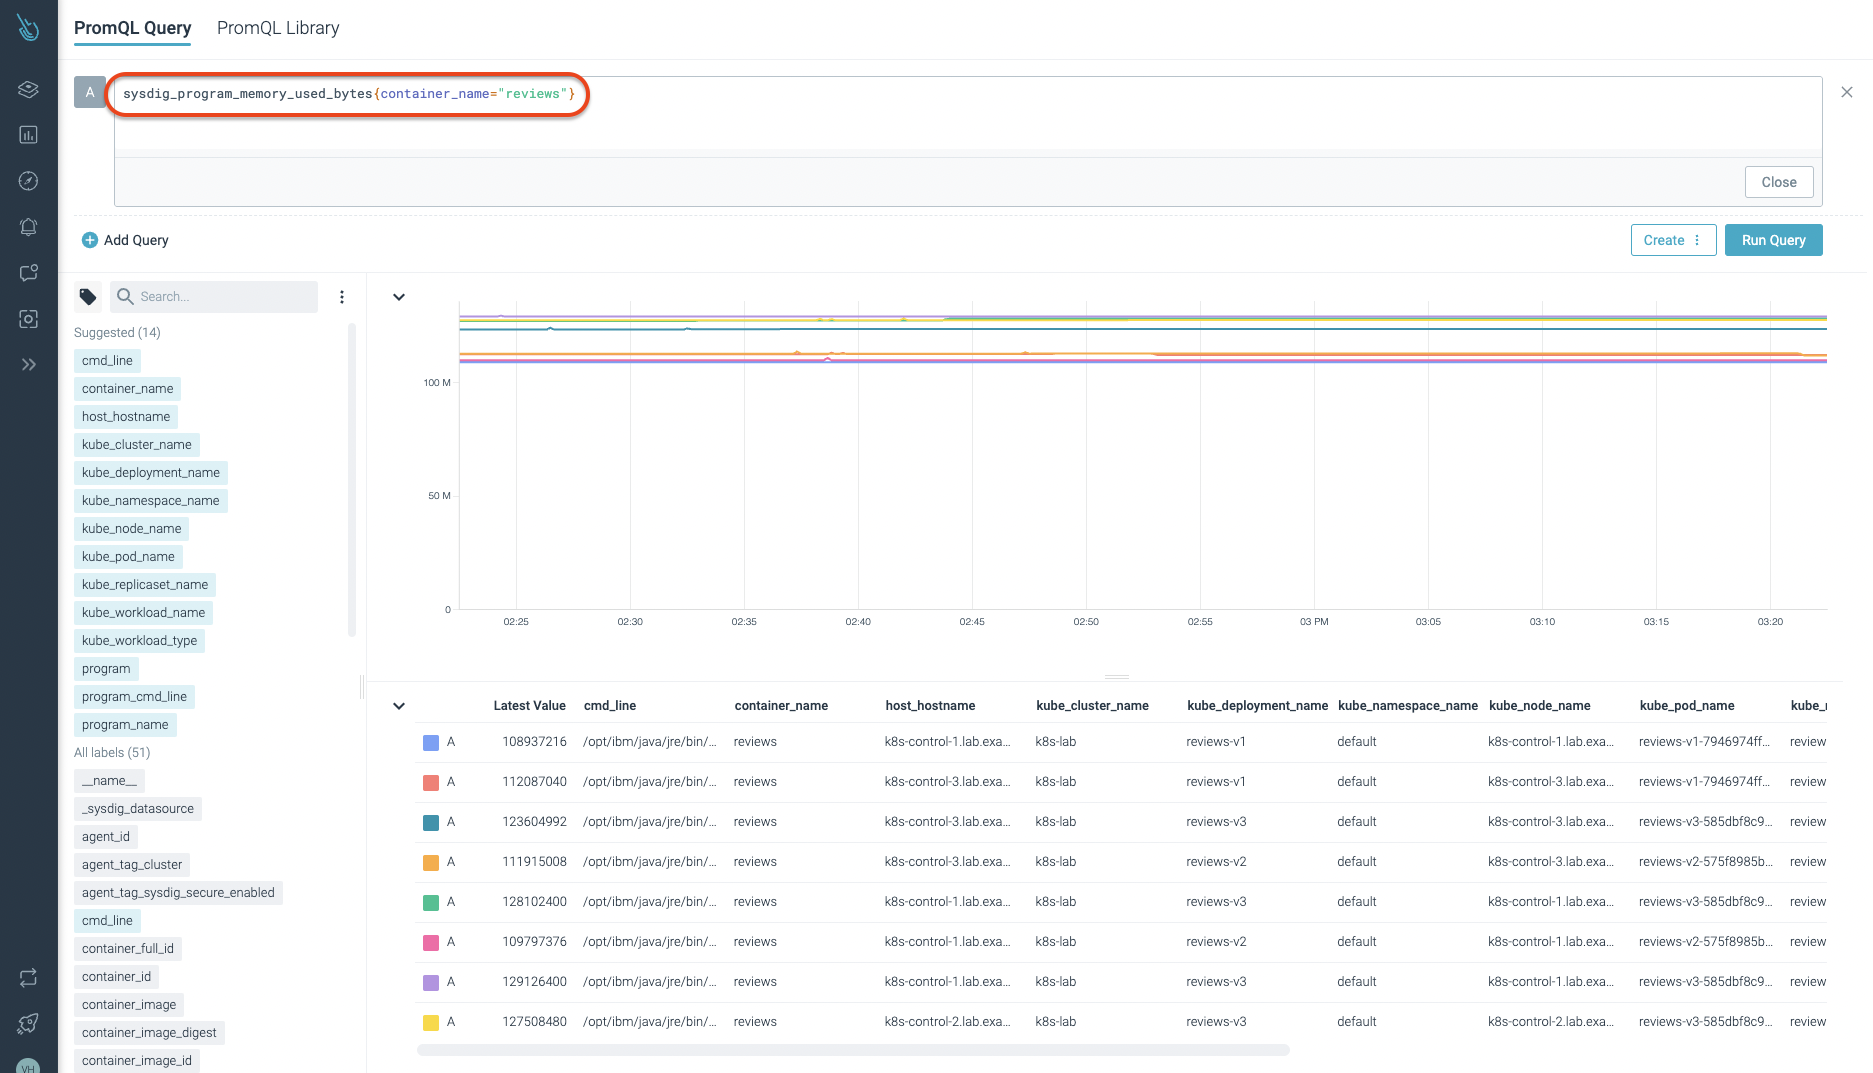
If you plan to move to Sysdig Monitor, don't worry about cAdvisor metrics. Sysdig agent collects all these metrics automatically for you. As soon as you log into the platform, you'll realize that cAdvisor related information is shown on the out-of-the-box dashboards.
Custom metrics monitoring
When it comes to scrape metrics from your custom or own endpoints, Sysdig relies on its Prometheus compatible service discovery the same way that DIY Prometheus does. Sysdig agent inspects kernel syscalls data in real time. That way, it's able to detect third-party software you may want to monitor.
In the following example, you'll see how the custom metric greeting_seconds_bucket can be easily consumed by Sysdig Monitor. No extra action is required at all, just log into the Sysdig Monitor platform and start exploring your custom metrics.
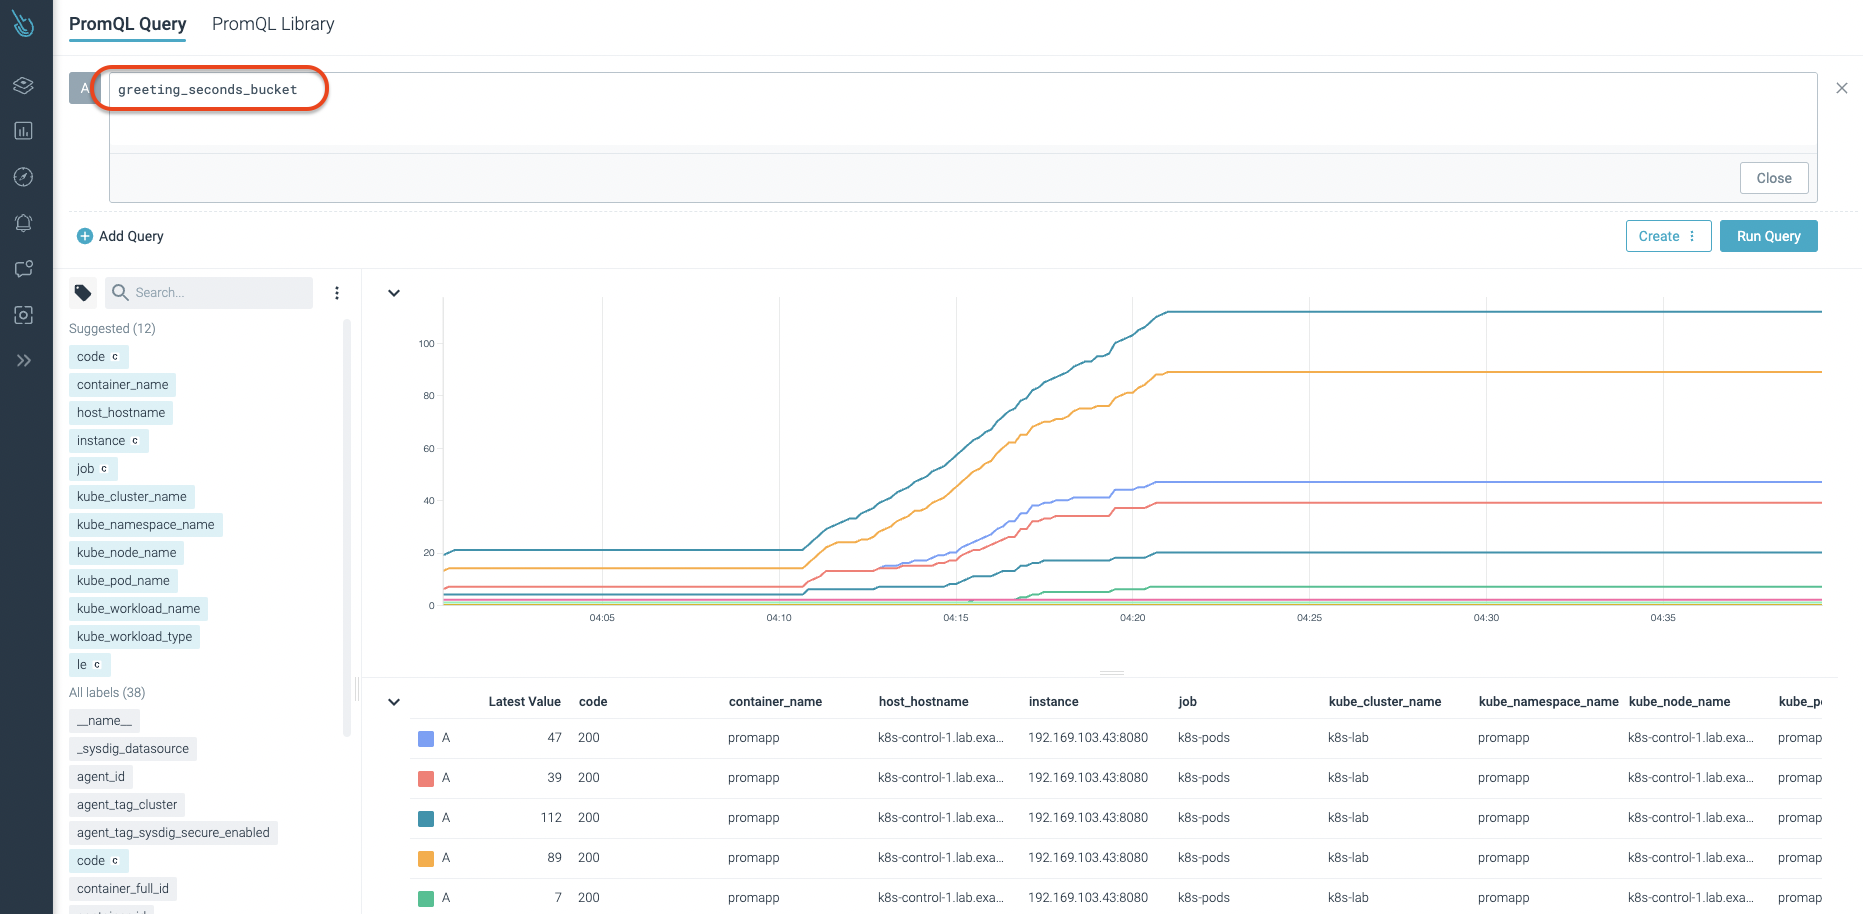
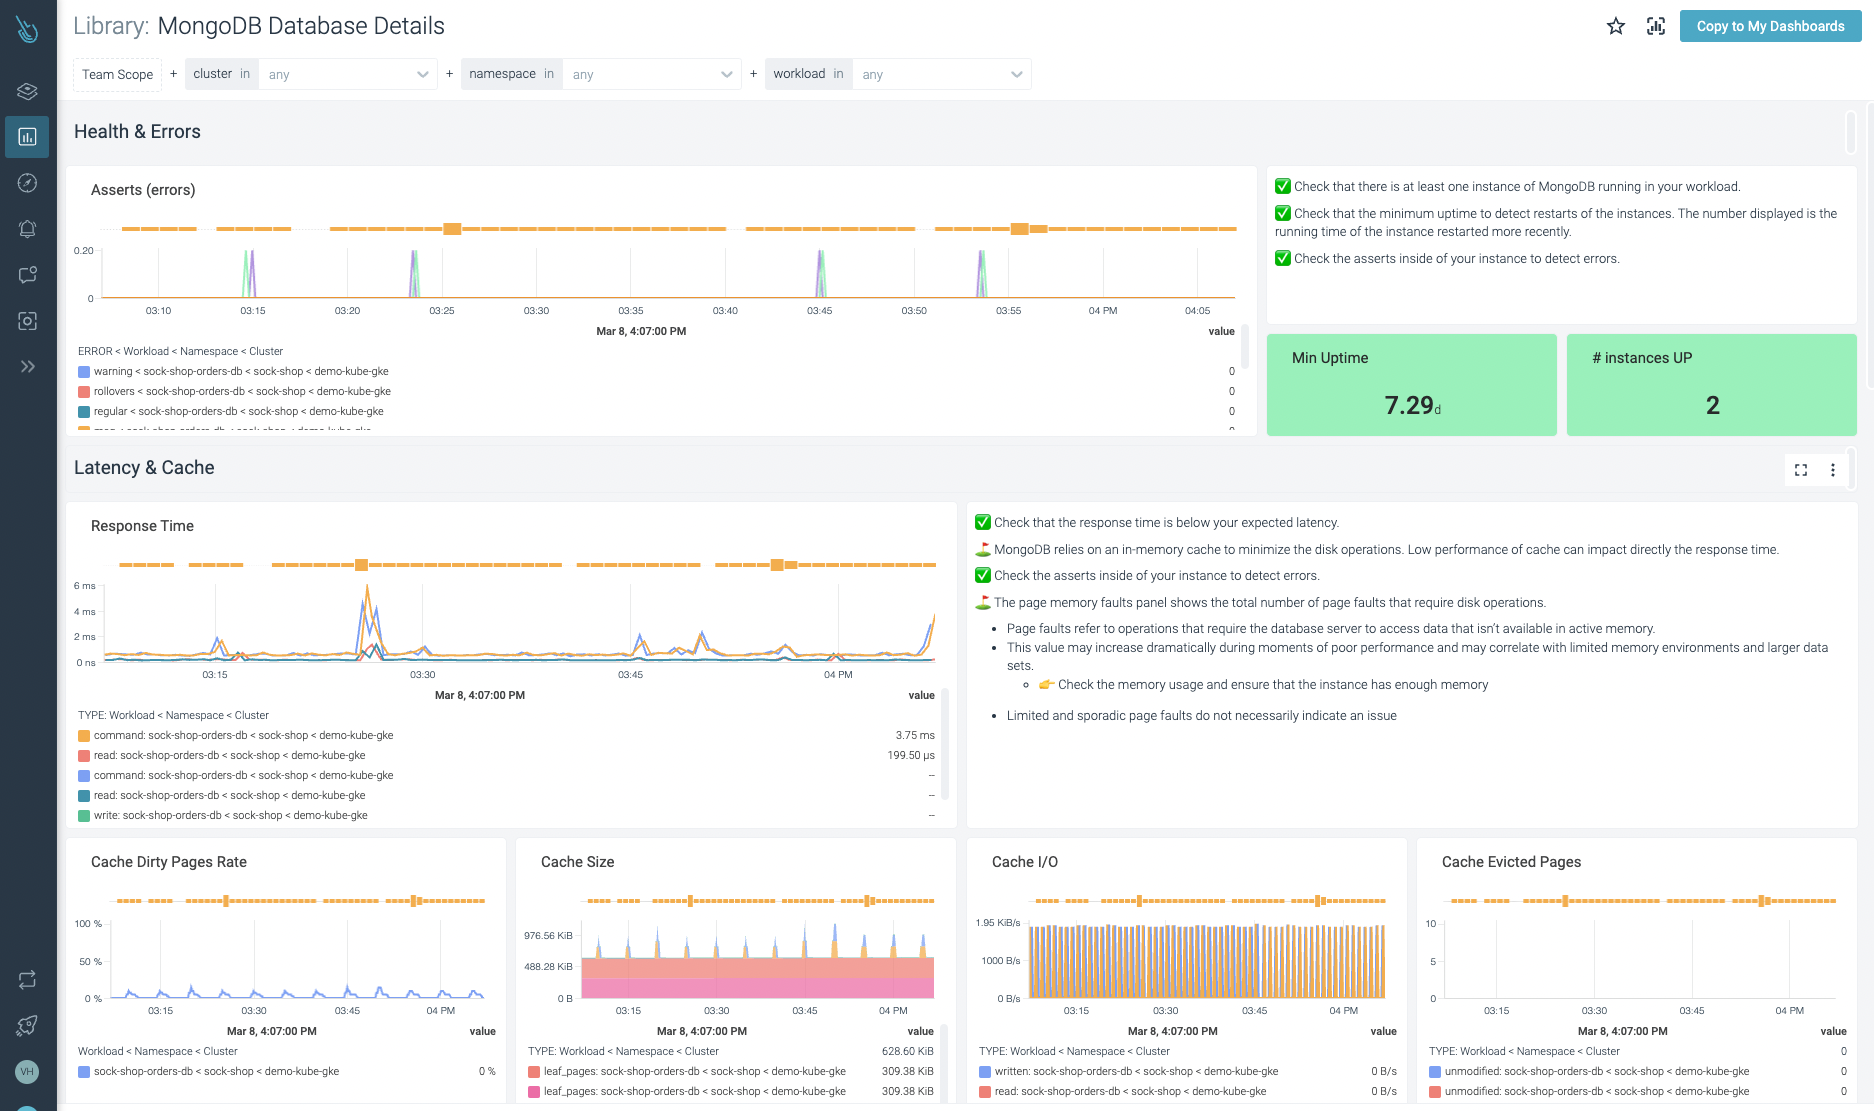
In terms of performance, stability, availability, etc., Sysdig provides a lot of out-of-the-box dashboards and alerts for your custom metrics and third-party software. This is an example of how Sysdig provides information about MongoDB instances with its out-of-the-box dashboards.
Migrating your alerts
In terms of alerts, users can migrate their alerts from DIY Prometheus to Sysdig Monitor in several ways. Let's talk about the different options available.
If you want to create your own alerts based on your metrics, you can do so easily, either through a form interface where you'll get assistance from the Sysdig Monitor console or directly from a PromQL query if you are familiar with that language.
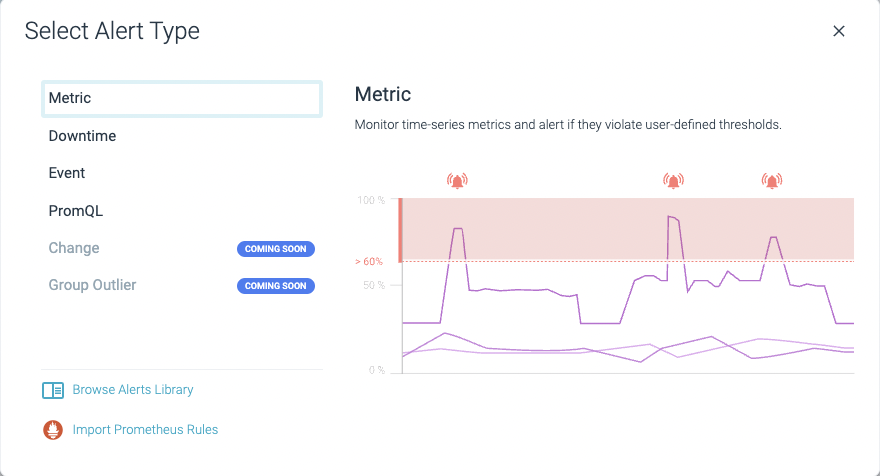
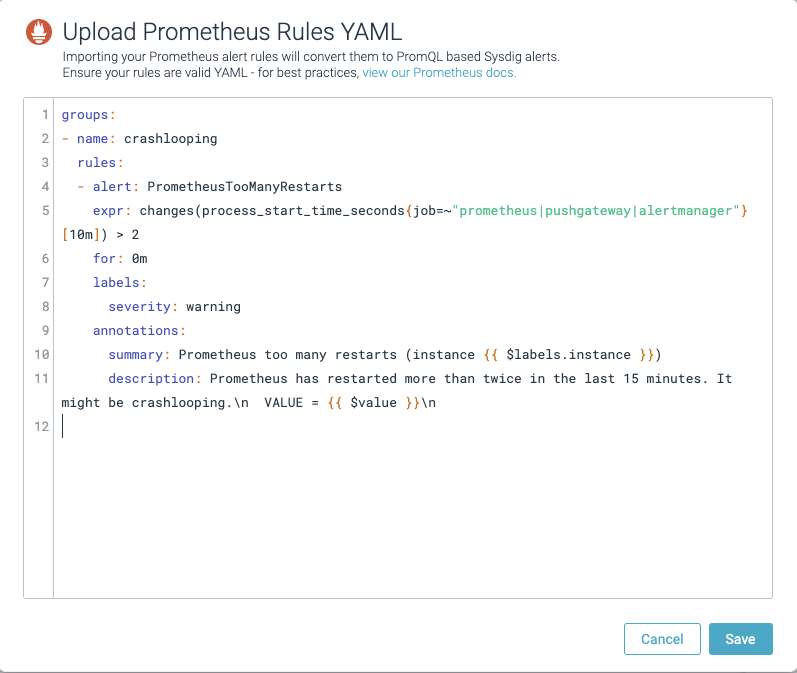
On the other hand, you may want to import your own Prometheus rules. If so, you can do that by selecting the "Import Prometheus Rules."
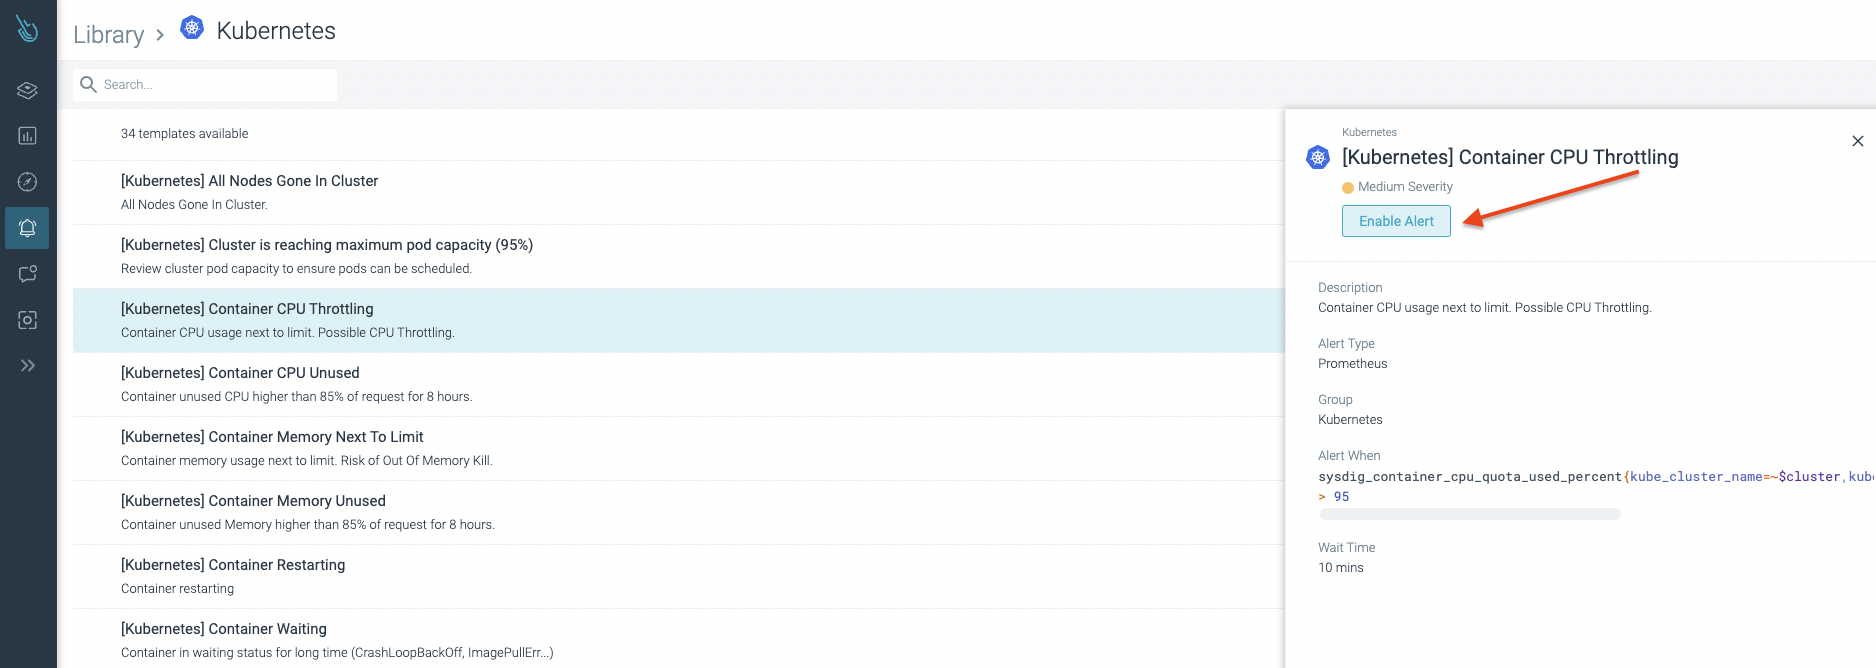
We've covered how to create your own alerts from a guided wizard or from your own Prometheus rules definition, but that's not all! Sysdig Monitor provides tons of predefined alerts, all included in a Library maintained and curated by the Sysdig engineering team. Kubernetes, cloud providers (AWS, Azure, GCP), and a bunch of third-party software alerts are available from the very beginning.
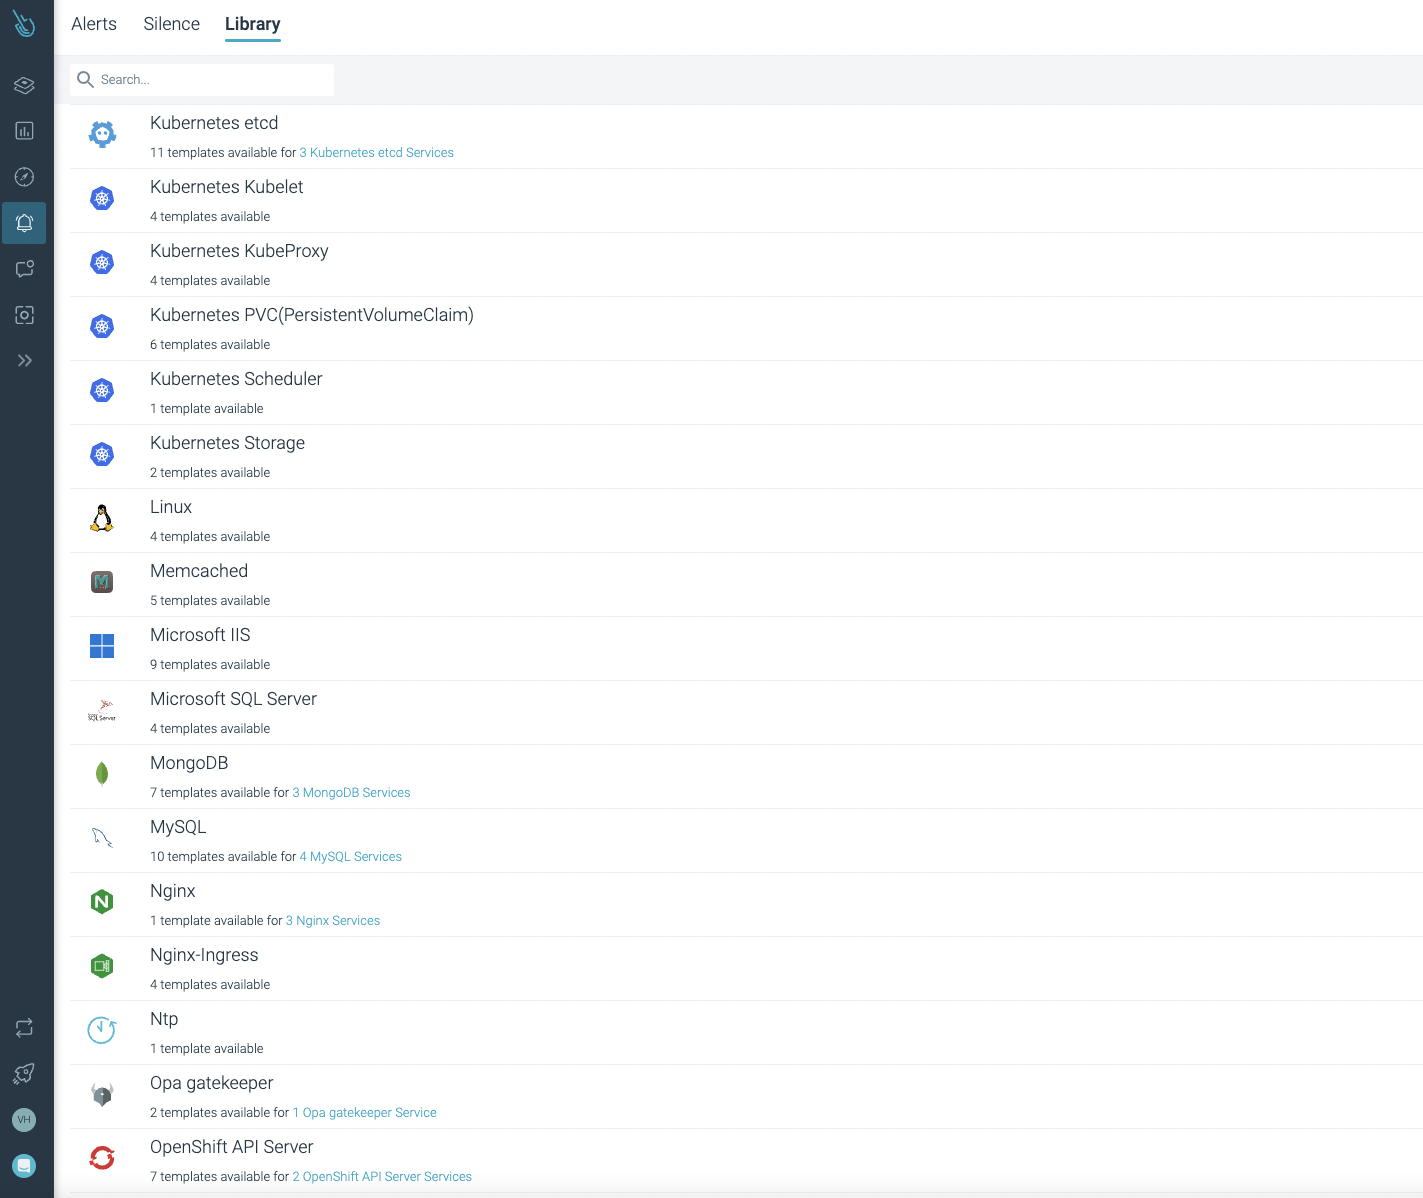
Here is an example of how easy it is to enable a Container CPU Throttling alert for any of your workloads. Just select the alert and click on "Enable alert." That's all!
As mentioned in previous sections, Sysdig provides automatic integration for a lot of third-party applications, and guided integration for other applications that may require manual steps. After integrating and enabling third-party software, users can start exploring and enabling these alerts immediately.
Conclusion
In this article, you have learned more about the migration process from DIY Prometheus, Grafana, and Alert Manager to Sysdig Monitor. Now you should be able to get answers for the following questions: What are the benefits of using Sysdig Monitor instead of DIY Prometheus? In terms of metrics, what are the main differences between both platforms? What about alerts? And how can you enable your own alerts in Sysdig Monitor?
Sysdig Monitor offers a multi-cloud monitoring experience, integrating the three main cloud providers: AWS, Azure, and GCP. The Enterprise Prometheus managed service is responsible for managing and storing, in its long term storage backend, your Kubernetes and Prometheus metrics. Users don't need to worry about performance, scalability, and availability of Prometheus metrics anymore.
If you want to learn more about how Sysdig Monitor can help with monitoring and troubleshooting your Kubernetes clusters, request a 30-day trial account and try it yourself. You'll be up and running in minutes!