


Falco Feeds extends the power of Falco by giving open source-focused companies access to expert-written rules that are continuously updated as new threats are discovered.

In this article we are going to deploy and monitor Linkerd as the default proxy for microservices communication inside a Kubernetes cluster. Common Linkerd metrics, failure points and their related alerts will be presented.
\r\r
Containerization and the closely related concept of microservices are turning the IT world upside down, and for a good set of reasons. If you are reading this, you are probably already familiar with the benefits and exciting ideas of the new stack. Of course, new architecture design principles come with its own share of challenges like microservice inter-communication or traceability.
\r\r
Microservices communication
\r\r
Containers are numerous, mostly anonymous and ephemeral. This is a perfect fit for scalability, redundancy and high availability but makes connection between the different entities somewhat more complex. Kubernetes services allow to expose a Service, abstracting the network details while providing basic load balancing and high availability. This is implemented as a simple connection round-robin using iptables underneath. Often, more latency or application aware methods are required. Should the client code be in charge of timeouts and/or retries?. Routing external requests coming from the Internet to the cluster services (Ingress) is not an obvious process either.
\r\r
Service traceability
\r\r
Containers and microservices are really interesting concepts for IT engineers, not so much for the final user. Users will evaluate how responsive and reliable the service is as a whole. Top-line metrics of a single microservice are a must, being able to monitor the complete round trip of a client request is often required.
\r\r
What is Linkerd?
\r\r
Linkerd is an open source, scalable service mesh proxy. It aims to solve some of the challenges we just discussed: the emerging communication complexities and traceability on large scale deployments.
\r\r
Main features of Linkerd are:
\r\r
- \r
- Advanced load-aware balancer with different forwarding strategies. \r
- Abstracts away the service discovery mechanism. \r
- Dynamic request routing. By tweaking the dtab router you can dynamically shift traffic during A/B testing, staging/production, etc. \r
- Automatic TLS tunneling for HTTP requests. \r
- Manages request retries, timeouts and deadlines, freeing other services or clients from implementing this network logic. \r
- Circuit breaking, removing unhealthy service instances from the pool. \r
\r\r
Linkerd deployment options
\r\r
A straightforward option is to deploy Linkerd in convoy mode, this is, as an extra container attached to every pod, but depending on your scale it can become expensive and you will also need to modify your current pod definitions.
\r\r
Another possibility is to deploy it using a DaemonSet, this will deploy exactly one Linkerd pod per Kubernetes node.
\r\r
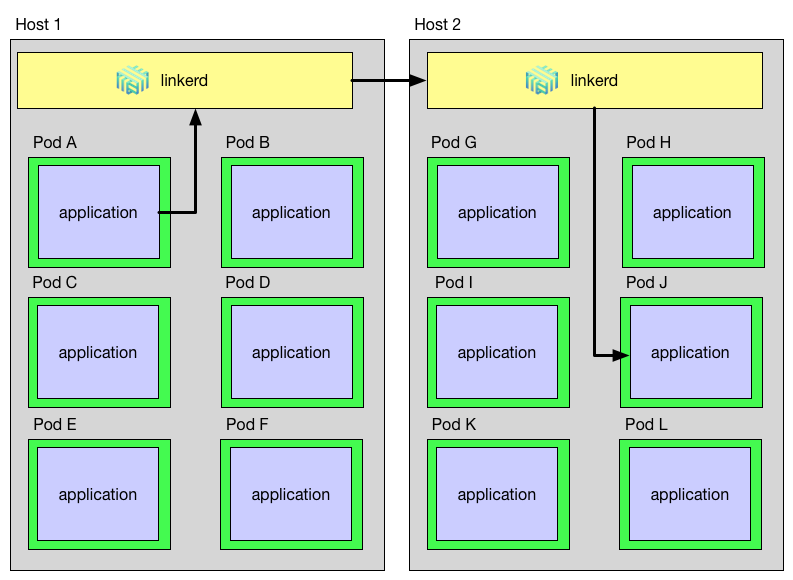
\r\r
Each time a pod wants to communicate it will forward traffic to its node-local Linkerd instance (Kubernetes downward API provides this information), and Linkerd will take care of the routing from that point on.
\r\r
This will be the deployment mode used to illustrate the how to monitor Linkerd in this article, Linkerd uses three ports by default:
\r\r
- \r
- Incoming traffic 4141 \r
- Outgoing traffic 4140 \r
- Local admin web 9990 (see monitoring section below) \r
\r\r
To deploy Linkerd on Kubernetes we used a service like this:
\r\r
\r\r\r <pre><code>\r<br>File: l5d-service.yml\r<br>---------------------\r<br>\r<br>---\r<br>apiVersion: v1\r<br>kind: Service\r<br>metadata:\r<br> name: l5d\r<br>spec:\r<br> selector:\r<br> app: l5d\r<br> type: LoadBalancer\r<br> ports:\r<br> - name: outgoing\r<br> port: 4140\r<br> - name: incoming\r<br> port: 4141\r<br> - name: admin\r<br> port: 9990\r<br>\r<br></code></pre>\r\r\r
And here is the Linkerd complete DaemonSet and ConfigMap config file (based on buoyant.io series of Linkerd articles).
\r\r
Monitor Linkerd
\r\r
Integrated monitoring interfaces
\r\r
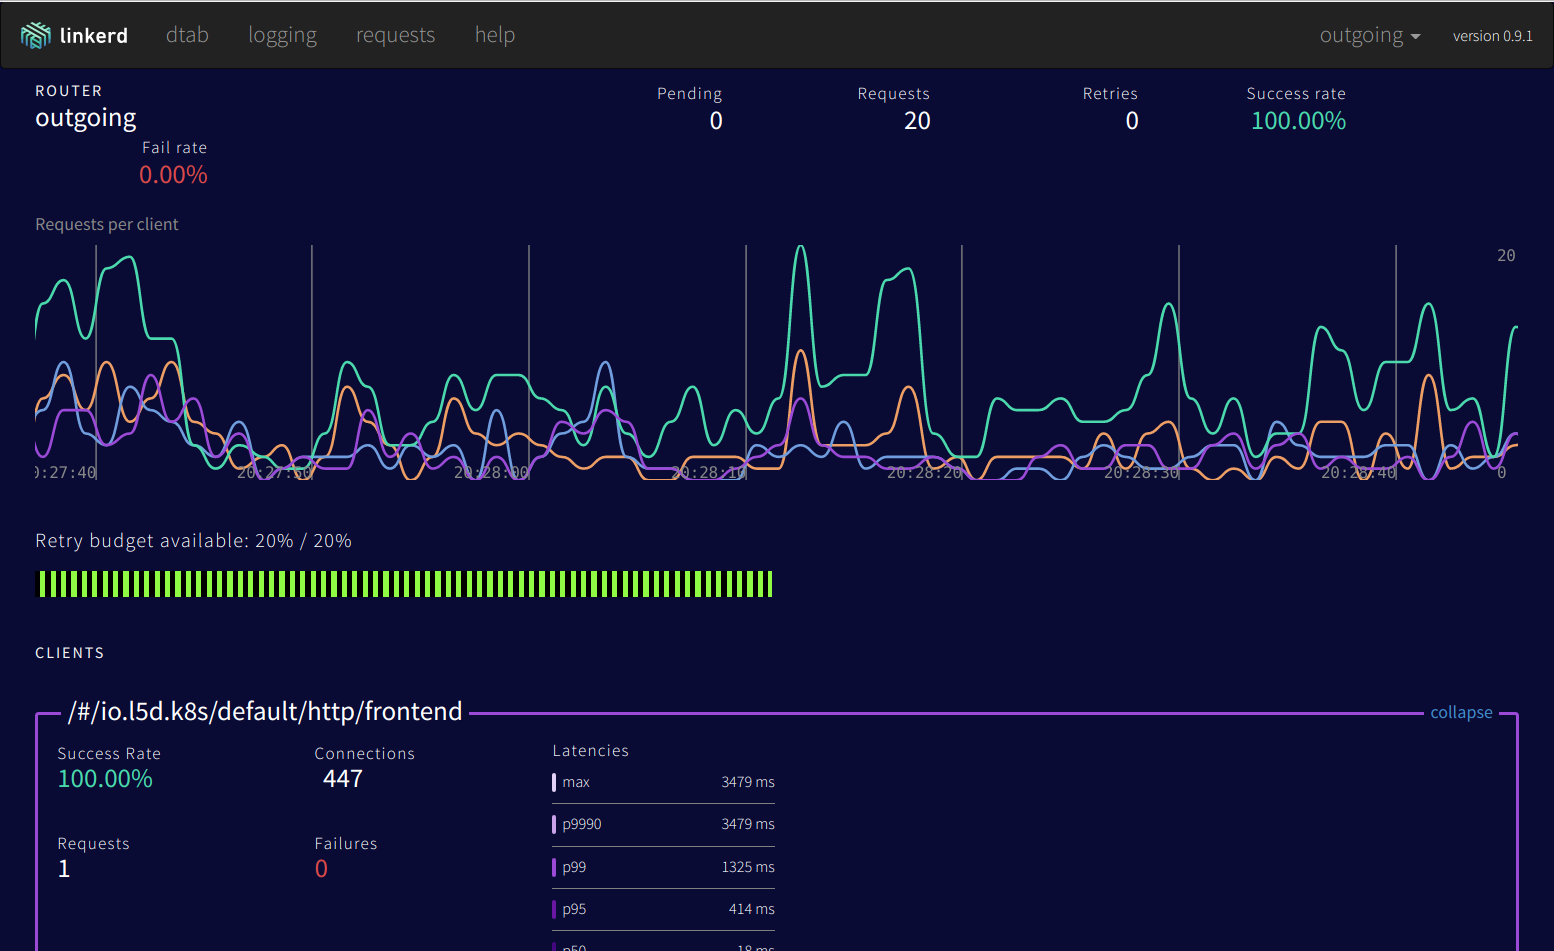
As mentioned above, a native web admin interface comes bundled out of the box:
\r\r
\r\r
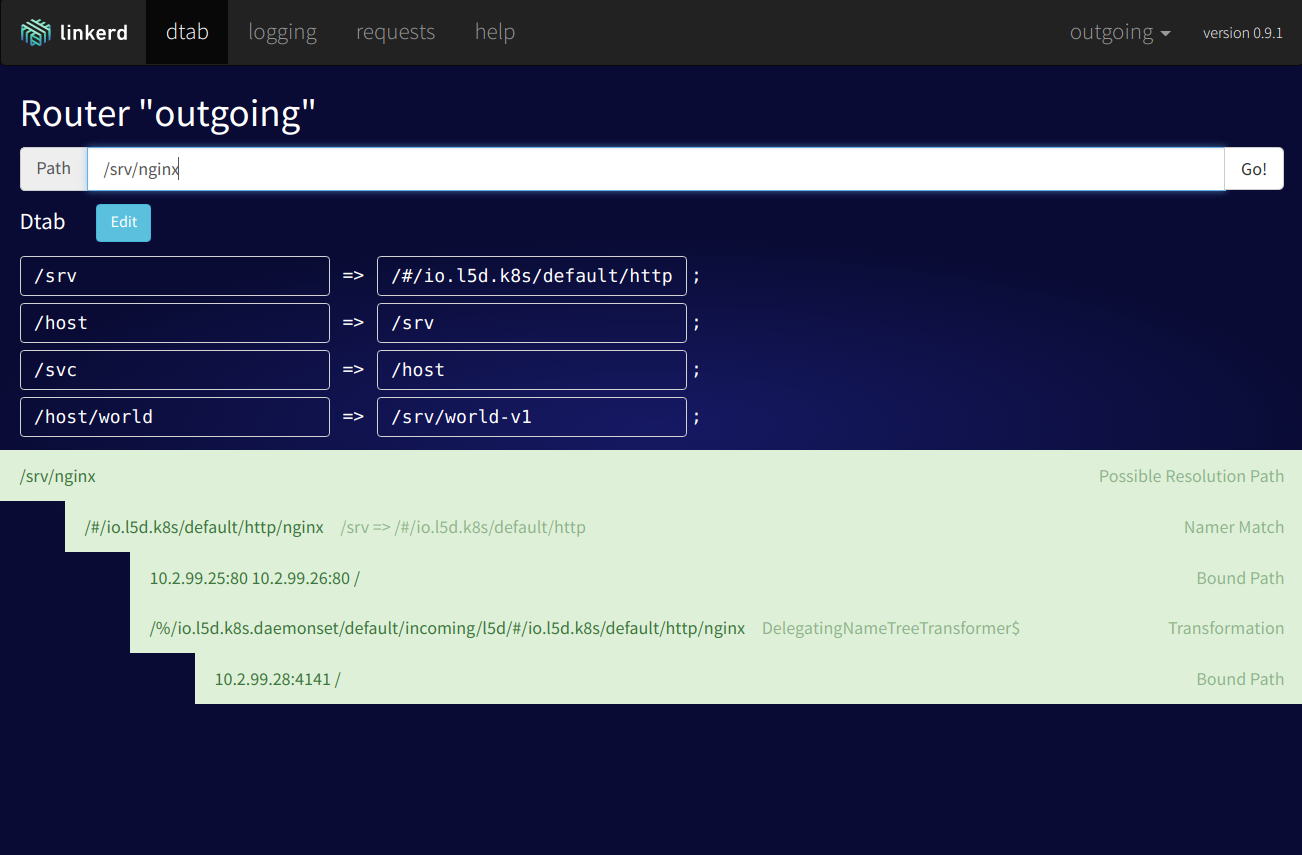
Using this web interface, you can get an overview of traffic and current requests, retries, failed requests, etc. The dtab routing section is also quite interesting, you can trace the path of a certain request and dynamically change the routing rules.
\r\r
\r\r
Sysdig Monitor
\r\r
In order to monitor Linkerd with Sysdig Monitor we need to deploy the Sysdig Monitor agent in your Kubernetes cluster, like Linkerd, as a DaemonSet. If you haven't done this before, just check out the instructions from here , it's just one kubectl command.
\r\r
statsd teleport!
\r\r
Linkerd can easily leverage statsd to expose the context-specific metrics. You can either send the metrics to a sidecar container (a exporter), have a dedicated statsd collector pod and instruct all the other services to send the metrics there, or even much easier, just forward all your metrics to a non-existent localhost port as shown in the Linkerd ConfigMap used above:
\r\r
\r\r\r <pre><code>\r<br>File: statsd.yml\r<br>----------------\r<br>\r<br> telemetry:\r<br> - kind: io.l5d.statsd\r<br> experimental: true\r<br> prefix: linkerd\r<br> hostname: 127.0.0.1\r<br>\r<br> port: 8125\r<br> gaugeIntervalMs: 10000\r<br> sampleRate: 0.01\r<br></code></pre>\r\r\r
** Wait, what?! **
\r\r
The Sysdig Monitor agent features passive statsd collection (or statsd teleport), the UDP packages will be eventually discarded, but Sysdig kernel module has already captured and forwarded the relevant information to the monitoring agent container, where it gets enriched with a set of tags and then sent to the Sysdig Monitor backend.
\r\r
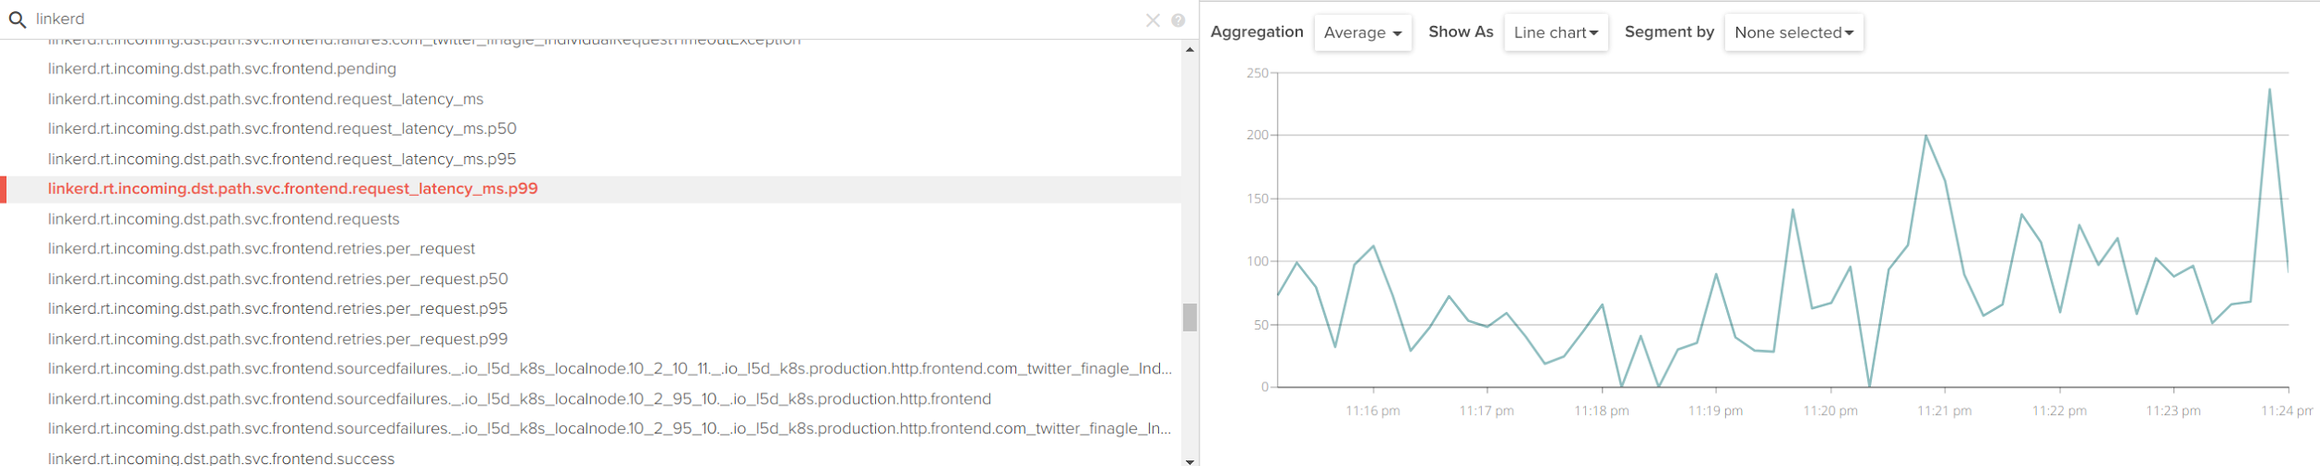
Accessing the Sysdig Monitor web interface and filtering by the 'linkerd' string, you will find a wealth of metrics available:
\r\r
\r\r
Very conveniently, Linkerd also yields a different set of metrics per namespace and service, such as l5d_k8s.production.http.nginx.retries.budget, where production is one of our namespaces and nginx one of our services.
\r\r
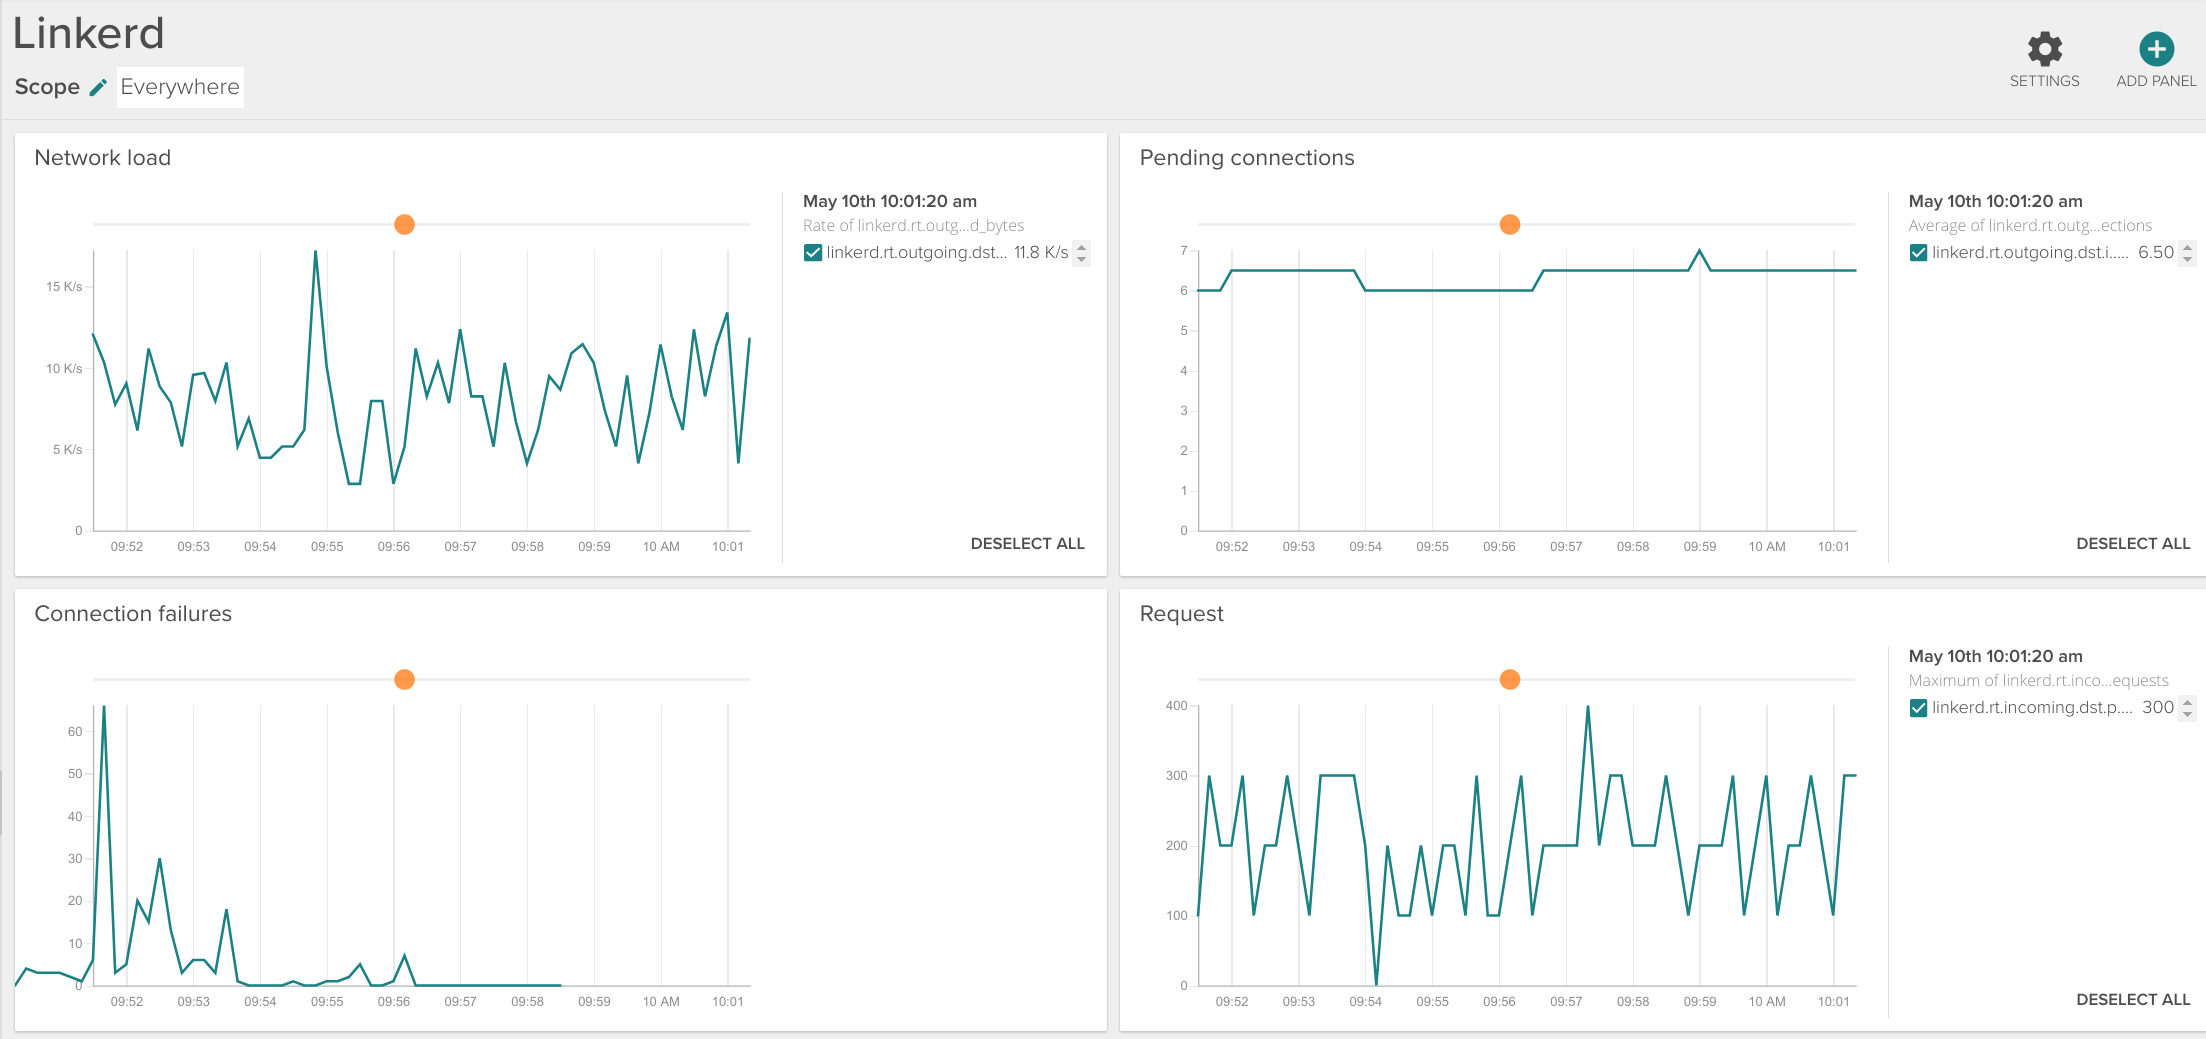
You can easily create your own Linkerd dashboard with the parameters that you consider most relevant for your case:
\r\r
\r\r
Most important linkerd metrics
\r\r
- \r
- Request latency (
svc.'yourservice'.request_latency_ms): aggregating all the successive calls, see section below. \r - Request latency percentiles (
svc.'yourservice'.request_latency_ms.p50, p95, p99): useful to get a grip of standard deviation and worst case scenario. \r - Service failures (
svc.'yourservice'.failures). \r - Total active connections (
'yourservice'.connections). \r - Requests pending (
svc.'yourservice'.pending): queue size and concurrency. \r - Total requests (
svc.'yourservice'.requests). \r - Service unhealthy (
failfast.unhealthy_for_ms, failfast.unhealthy_num_tries): Circuit breaking capabilities. \r - Loadbalancer removed node (
loadbalancer.removes): one of the nodes providing a service removed from the loadbalancer. \r - Loadbalancer available nodes (
'yourservice'.loadbalancer.available): number of nodes that the balancer considers alive for a given service. \r - Service bandwidth (
'yourservice'.received_bytes, 'yourservice'.sent_bytes). \r - Connection retries (
svc.'yourservice'.retries.total, .retries.budget). \r
\r\r
Monitoring microservices aggregating latency
\r\r
Imagine the following common scenario: you have an edge proxy A which, depending on the request URL will open a connection to service B or service C. B will open a successive connection with D to complete the request. C will open a connection with E and E with F.
\r\r
A ⇒ Linkerd ⇒ B ⇒ Linkerd ⇒ D
\r\r
or
\r\r
A ⇒ Linkerd ⇒ C ⇒ Linkerd ⇒ E ⇒ Linkerd ⇒ F
\r\r
Each request will finish when the successive requests returns, which allows you to measure the latency of individual microservices (D or F), entire services (B+D; C+E+F) or global average response time (A).
\r\r
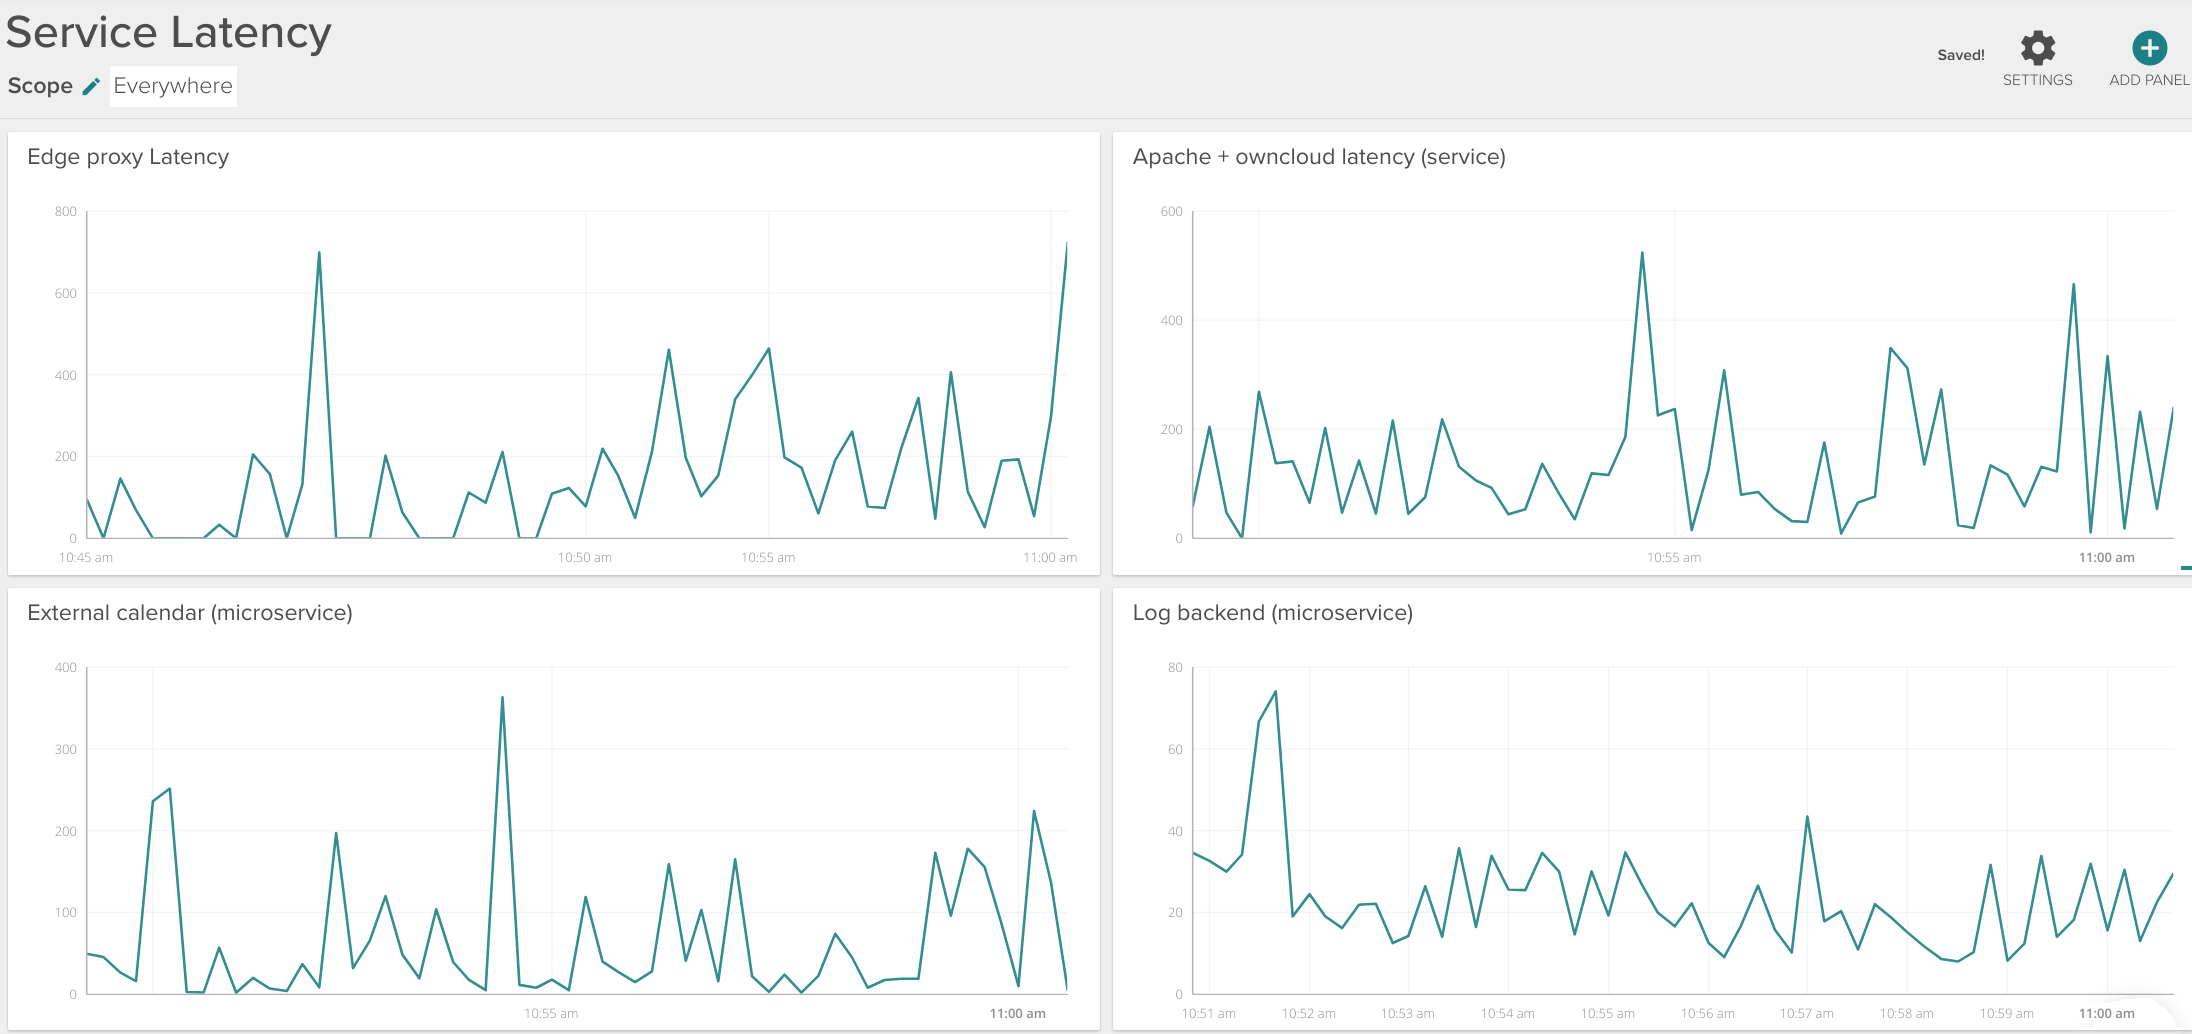
Consider the example dashboard below:
\r\r
\r\r
You can monitor:
\r\r
- \r
- The aggregated edge proxy latency (Internet-facing HAproxy, for example) -top left panel. \r
- Complete service latency (internal Apache reverse proxy + ownCloud + several database backends) – top right panel. \r
- Log backend individual microservice latency – bottom right panel. \r
\r\r
Distributed tracing with Zipkin
\r\r
Linkerd also supports forwarding connection data to distributed tracing systems like Zipkin, being able to monitor timing and latency for each request across all the different microservices.
\r\r
Linkerd alerts
\r\r
Now that you have imported all the metrics and Linkerd context-specific data and tags, next step is to configure the relevant alerts:
\r\r
\r\r
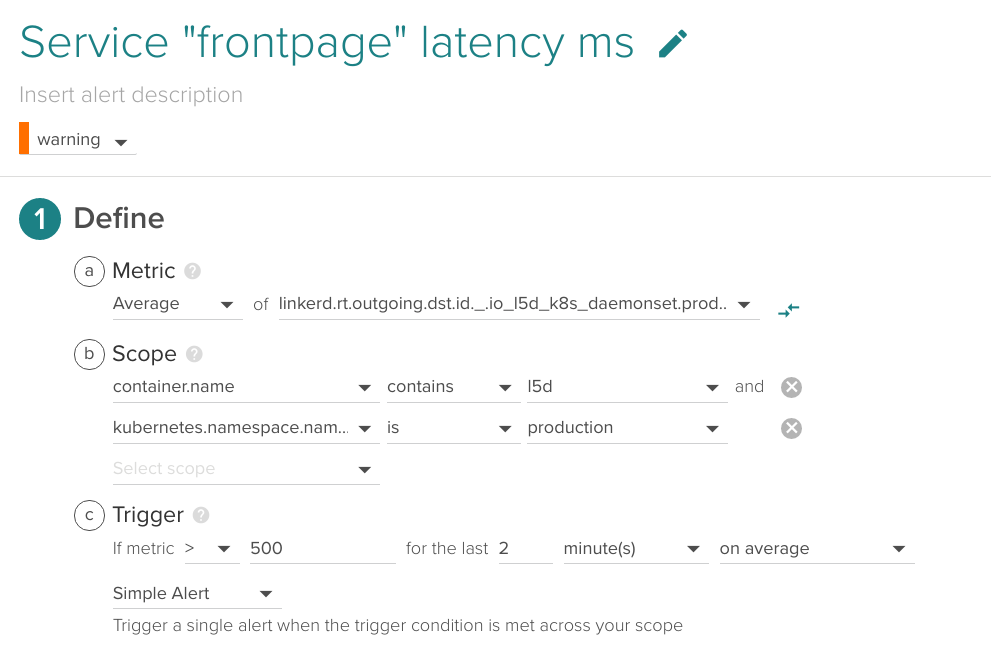
Service latency
\r\r
An early indicator of high loads or deficiencies in any of the backends, it is a good practice to set an upper bound latency for your business-critical services.
\r\r
\r\r
(Metric name (without prefix): production.http.frontend.request_latency_ms)
\r\r
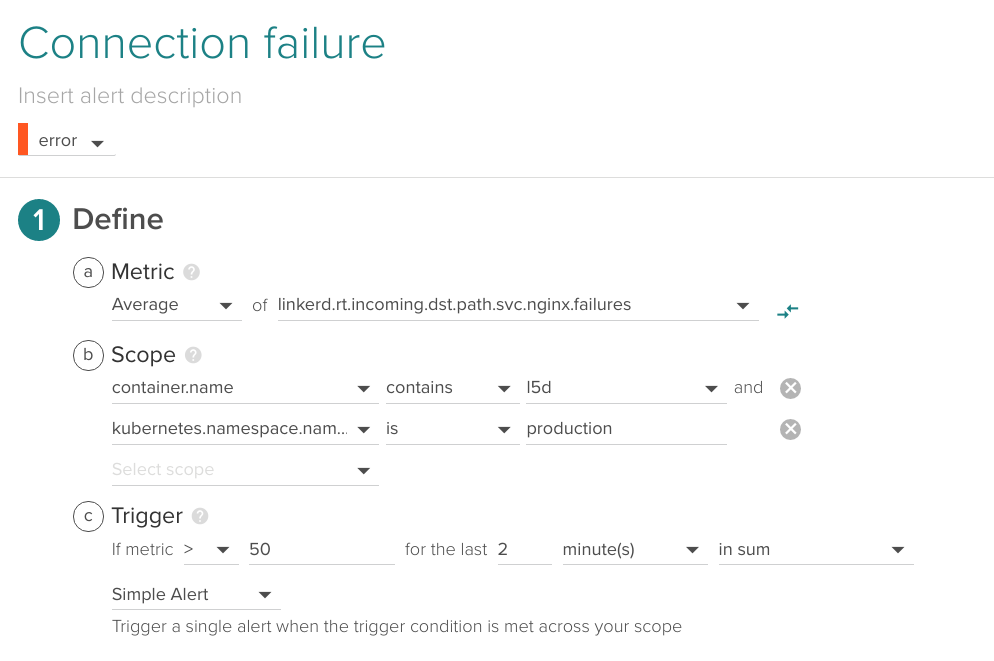
Connection failure
\r\r
If Linkerd is failing to connect with a specific service, it is probably a clear indicator of issues.
\r\r
\r\r
Depending on the average load and responsivity of your system, your acceptable rate of connection failures will vary.
\r\r
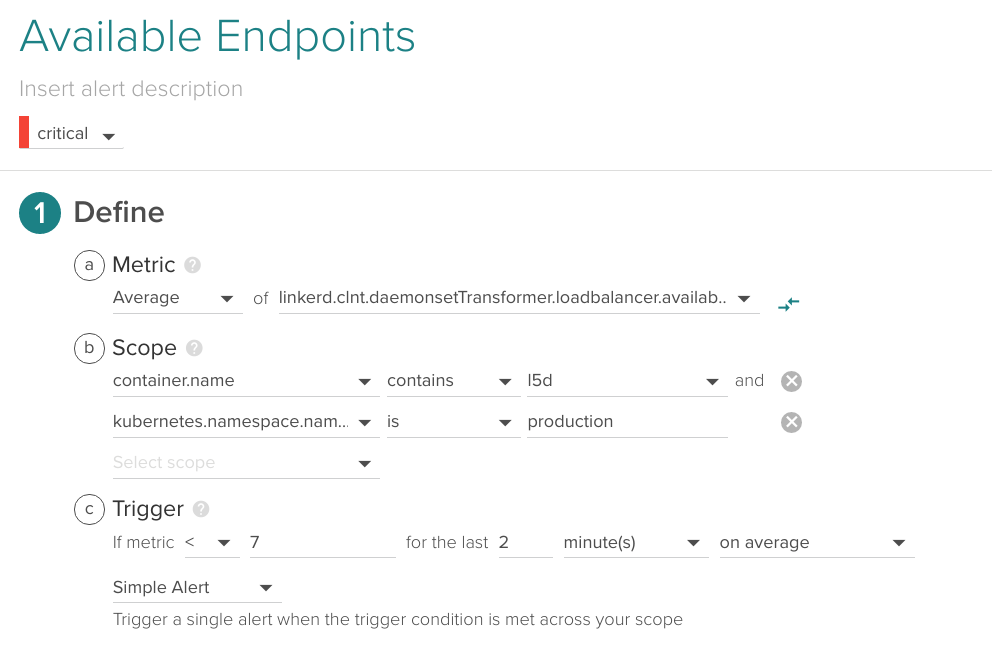
Available endpoints
\r\r
The Linkerd load balancer keeps a table of alive endpoints per service, you may want to fire an alert if this value drops. For example, if you have declared in your ReplicaSet that some service is composed of 10 instances, send an alert if 7 or less are currently available:
\r\r
\r\r
This alert bears some similarities with the running pods versus desired pods alert we described in our Monitoring Kubernetes guide: best practices for alerting on Kubernetes .
\r\r
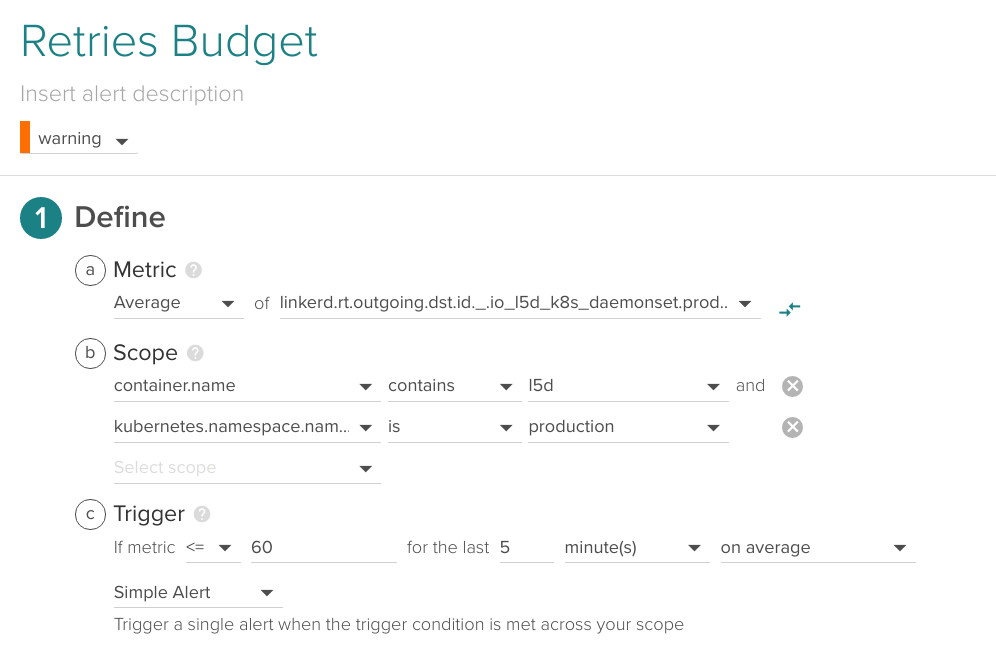
Retries budget
\r\r
Linkerd keeps a global 'Retry Budget' which is spent with every connection retry and regenerates automatically over time, you can keep an eye on this metric and be warned if the number of connection retries is anomalous.
\r\r
\r\r
(Metric name (without prefix): k8s.production.http.frontend.retries.budget)
\r\r
Conclusions
\r\r
Linkerd is an infrastructure add-on that can certainly add some extra capabilities over the default Kubernetes service balancers, handling the communication between your microservices and becoming a critical part of your infrastructure.
\r\r
An interesting benefit of this approach is being able to free individual containers from networking concerns like retries, timeouts or cypher. This enables them to be lighter, simpler and more deployment-agnostic, very much in line with the microservices approach.
\r\r
Monitoring Linkerd using Sysdig Monitor is really easy thanks to Sysdig statsd teleport: you can automatically import all the metrics with the required context, gaining visibility on the communication between the microservices. If you haven't done it yet, check it out using 15-days free trial!