


Falco Feeds extends the power of Falco by giving open source-focused companies access to expert-written rules that are continuously updated as new threats are discovered.

We're really excited to round up all the great functionality we've released so far this year on Sysdig Monitor into our Spring Release. Here we're going to give you a quick run-down on the most important features and where possible link you to deeper information on how to use the features.
\r\r
If you've got questions on any of these features, or want to assistance using them, we'd love to help you! Drop us a line at @sysdig.
\r\r
Increased performance and scale
\r\r
Sysdig Monitor now supports tens of thousands of containers per customer, with 10x faster dashboard load time. More data, faster!
\r\r
Added Container Ecosystem Support
\r\r
\r\r
Sysdig Integrates with Docker Data Center – Sysdig Monitor can capture key metadata (based on Docker Labels) from Docker DataCenter and use it to monitor the logical services of your environment.
\r\r
Sysdig supports Kubernetes 1.2 out-of-the-box – Kubernetes Scale, Ubernetes Lite, and DeamonSets are all supported within Sysdig.
\r\r
New Views – We added new views for AWS ECS, Docker, and Kubernetes that allow you to better monitor your environment out-of-the-box.
\r\r
Deeper Troubleshooting
\r\r
Sysdig Monitor now lets you troubleshoot a container after it's long gone. Alerts can now trigger a system capture. Most monitoring tools stop at a dashboard and an alert. But we let you go deeper, using sysdig's open source tool. Any alert can now trigger a system capture, recording every syscall made on a container or host at the time the alert was fired into a file.
\r\r
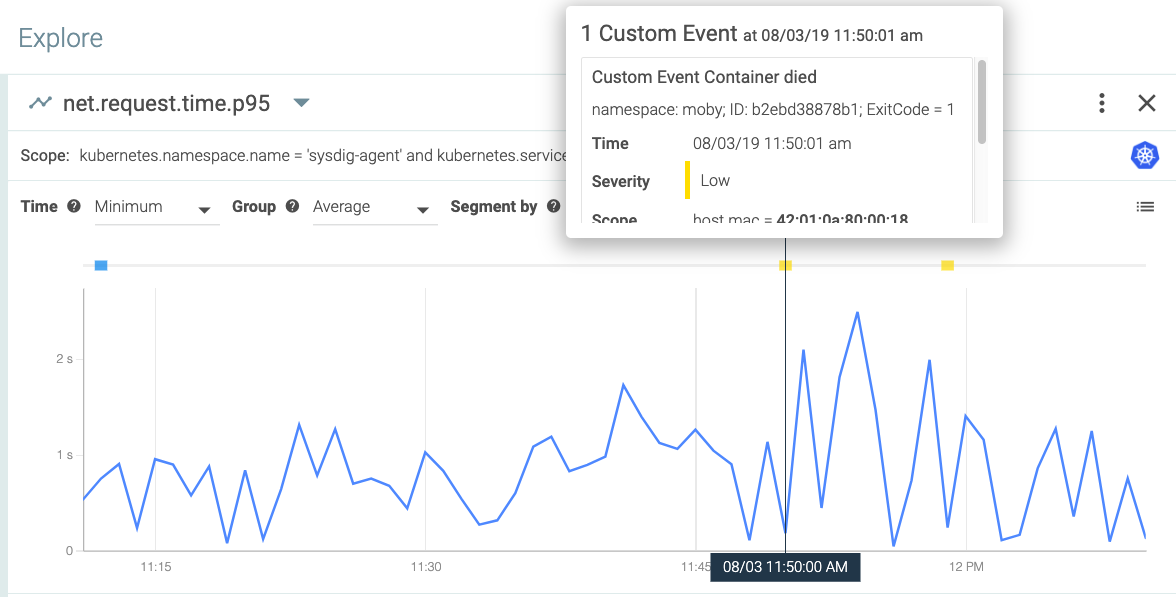
Sysdig graphs now **correlate alerts **with metrics – Get simple, beautiful alert overlays on any graph. It makes getting to the heart of any problem much easier and much more pleasant.
\r\r
\r\r
\r\r
Better Monitoring and Analytics
\r\r
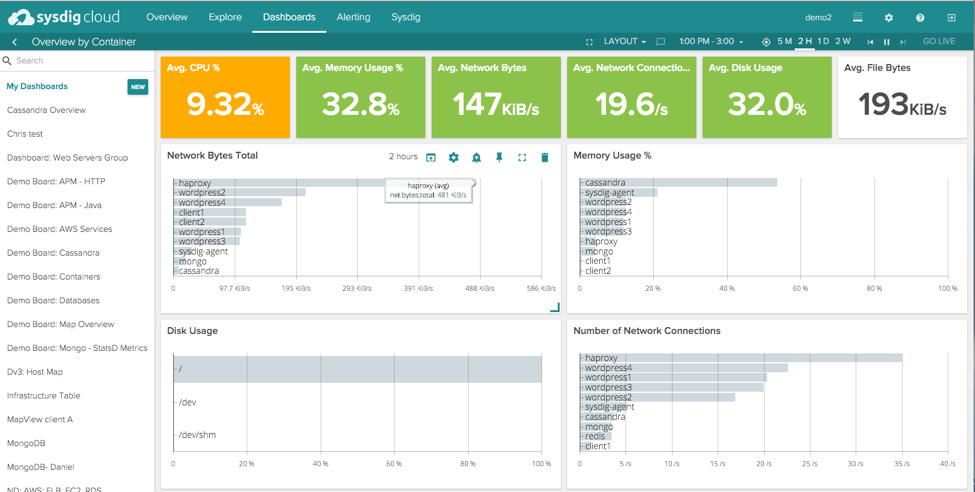
Number panel – This was a highly requested feature. A number panel shows you the state of a metric "right now", and dynamic color coding ensures that your wallboard will always be really useful and you're running by it.
\r\r
\r\r
\r\r
New Integrations – We added 20+ application views, which give you templated instant data on components that you might use in your app or service today. Combined with Sysdig's auto-app discovery capability, it means that you can install sysdig and immediately monitor your app with no config necessary.
\r\r
\r\r
\r\r
**Customizable columns in the Explore view **- Customers love our explore view because it's like a big pivot table for their entire infrastructure. Grouping features have always provided a way to switch between logical and physcial views of your apps, but data columns had been statically configured, until now. The explore table now allows you to configure every column for the exact metric you'd like to see.
\r\r
Dashboard Wizard – well, this one seems pretty self explanatory. But still awesome. So awesome, in fact, that since we introduced it we've seen a 10x increase in the number of dashboards created!