
Introduction
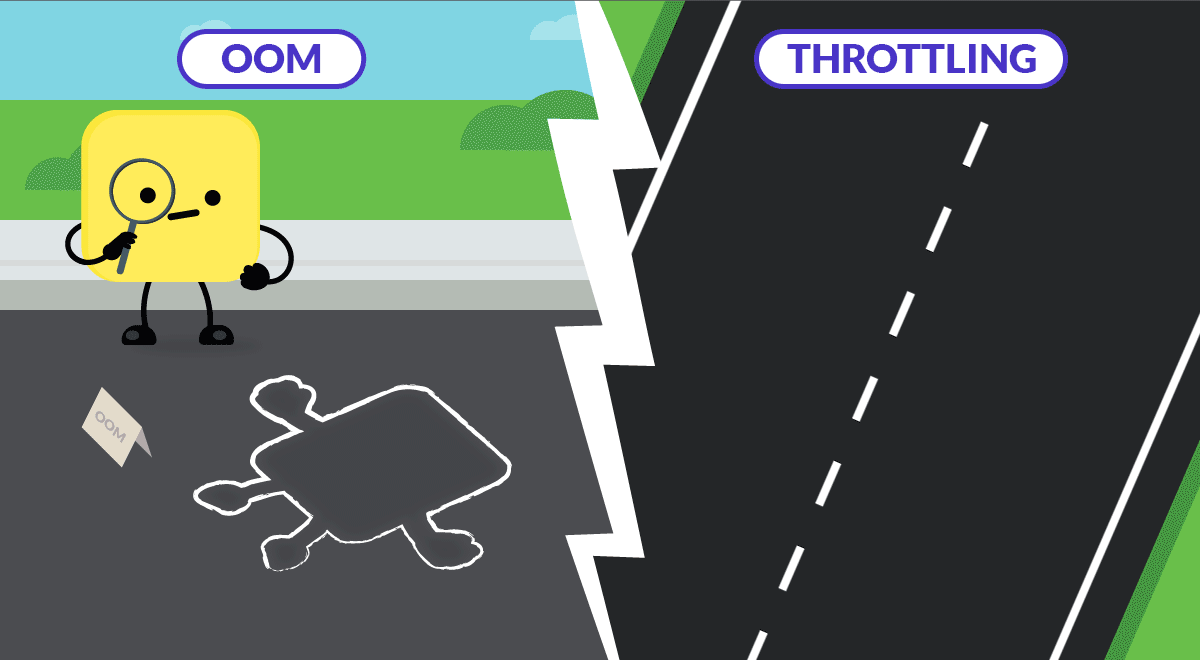
When working with Kubernetes, Out of Memory (OOM) errors and CPU throttling are the main headaches of resource handling in cloud applications. Why is that?
CPU and Memory requirements in cloud applications are ever more important, since they are tied directly to your cloud costs.
With limits and requests, you can configure how your pods should allocate memory and CPU resources in order to prevent resource starvation and adjust cloud costs.
In case a Node doesn’t have enough resources, Pods might get evicted via preemption or node-pressure.
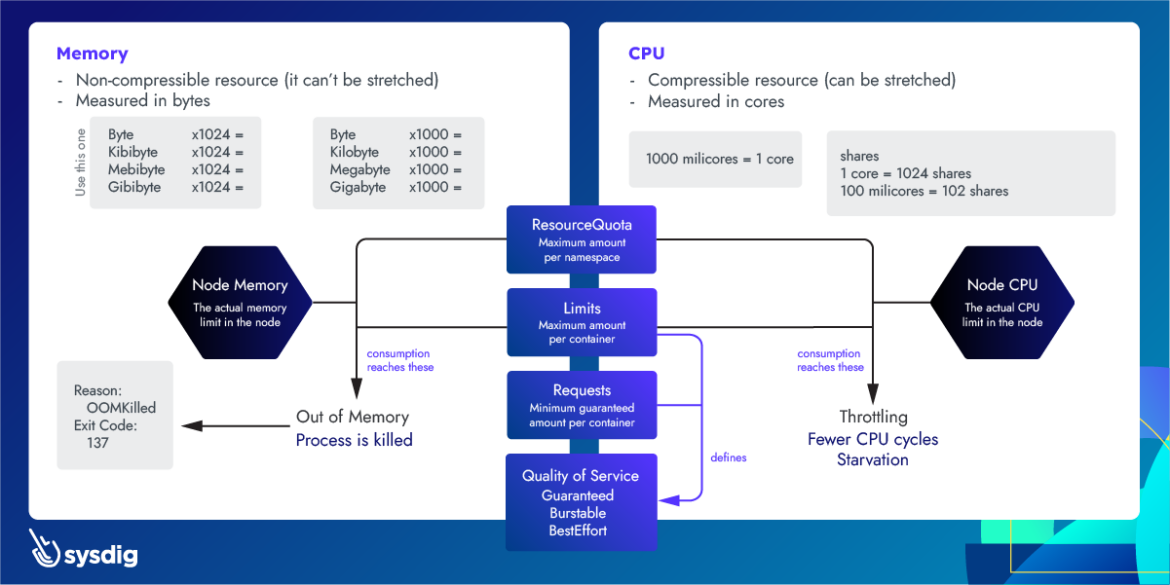
When a process runs Out Of Memory (OOM), it’s killed since it doesn’t have the required resources.
In case CPU consumption is higher than the actual limits, the process will start to be throttled.
But, how can you actively monitor how close your Kubernetes Pods to OOM and CPU throttling?
Kubernetes OOM
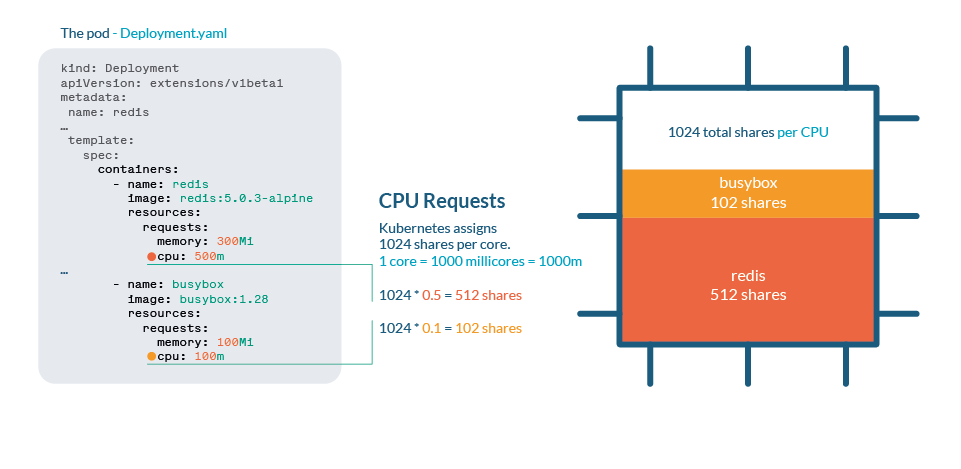
Every container in a Pod needs memory to run.
Kubernetes limits are set per container in either a Pod definition or a Deployment definition.
All modern Unix systems have a way to kill processes in case they need to reclaim memory. This will be marked as Error 137 or OOMKilled.
   State:          Running
      Started:      Thu, 10 Oct 2019 11:14:13 +0200
    Last State:     Terminated
      Reason:       OOMKilled
      Exit Code:    137
      Started:      Thu, 10 Oct 2019 11:04:03 +0200
      Finished:     Thu, 10 Oct 2019 11:14:11 +0200
Code language: YAML (yaml)
This Exit Code 137 means that the process used more memory than the allowed amount and had to be terminated.
This is a feature present in Linux, where the kernel sets an oom_score value for the process running in the system. Additionally, it allows setting a value called oom_score_adj, which is used by Kubernetes to allow Quality of Service. It also features an OOM Killer, which will review the process and terminate those that are using more memory than they should.
Note that in Kubernetes, a process can reach any of these limits:
- A Kubernetes Limit set on the container.
- A Kubernetes ResourceQuota set on the namespace.
- The node’s actual Memory size.

Memory overcommitment
Limits can be higher than requests, so the sum of all limits can be higher than node capacity. This is called overcommit and it is very common. In practice, if all containers use more memory than requested, it can exhaust the memory in the node. This usually causes the death of some pods in order to free some memory.
Monitoring Kubernetes OOM
When using node exporter in Prometheus, there’s one metric called node_vmstat_oom_kill. It’s important to track when an OOM kill happens, but you might want to get ahead and have visibility of such an event before it happens.
Instead, you can check how close a process is to the Kubernetes limits:
(sum by (namespace,pod,container)
(rate(container_cpu_usage_seconds_total{container!=""}[5m])) / sum by
(namespace,pod,container)
(kube_pod_container_resource_limits{resource="cpu"})) > 0.8

Kubernetes CPU throttling
CPU Throttling is a behavior where processes are slowed when they are about to reach some resource limits.
Similar to the memory case, these limits could be:
- A Kubernetes Limit set on the container.
- A Kubernetes ResourceQuota set on the namespace.
- The node’s actual Memory size.
Think of the following analogy. We have a highway with some traffic where:
- CPU is the road.
- Vehicles represent the process, where each one has a different size.
- Multiple lanes represent having several cores.
- A request would be an exclusive road, like a bike lane.
Throttling here is represented as a traffic jam: eventually, all processes will run, but everything will be slower.
CPU process in Kubernetes
CPU is handled in Kubernetes with shares. Each CPU core is divided into 1024 shares, then divided between all processes running by using the cgroups (control groups) feature of the Linux kernel.
If the CPU can handle all current processes, then no action is needed. If processes are using more than 100% of the CPU, then shares come into place. As any Linux Kernel, Kubernetes uses the CFS (Completely Fair Scheduler) mechanism, so the processes with more shares will get more CPU time.
Unlike memory, Kubernetes won’t kill Pods because of throttling.

You can check CPU stats in /sys/fs/cgroup/cpu/cpu.stat
CPU overcommitment
As we saw in the limits and requests article, it’s important to set limits or requests when we want to restrict the resource consumption of our processes. Nevertheless, beware of setting up total requests larger than the actual CPU size, as this means that every container should have a guaranteed amount of CPU.
Monitoring Kubernetes CPU throttling
You can check how close a process is to the Kubernetes limits:
(sum by (namespace,pod,container)(rate(container_cpu_usage_seconds_total
{container!=""}[5m])) / sum by (namespace,pod,container)
(kube_pod_container_resource_limits{resource="cpu"})) > 0.8
In case we want to track the amount of throttling happening in our cluster, cadvisor provides container_cpu_cfs_throttled_periods_total and container_cpu_cfs_periods_total. With these two, you can easily calculate the % of throttling in all CPU periods.
Best practices
Beware of limits and requests
Limits are a way to set up a maximum cap on resources in your node, but these need to be treated carefully, as you might end up with a process throttled or killed.
Prepare against eviction
By setting very low requests, you might think this will grant a minimum of either CPU or Memory to your process. But kubelet will evict first those Pods with usage higher than requests first, so you’re marking those as the first to be killed!
In case you need to protect specific Pods against preemption (when kube-scheduler needs to allocate a new Pod), assign Priority Classes to your most important processes.
Throttling is a silent enemy
By setting unrealistic limits or overcommitting, you might not be aware that your processes are being throttled, and performance impacted. Proactively monitor your CPU usage and know your actual limits in both containers and namespaces.
Wrapping up
Here’s a cheat sheet on Kubernetes resource management for CPU and Memory. This summarizes the current article plus these ones which are part of the same series:
Reduce your Kubernetes costs with Sysdig Monitor
Sysdig Monitor can help you reach the next step in the Monitoring Journey.
With Cost Advisor, you can reduce Kubernetes resource waste by up to 40%.
And with our out-of-the-box Kubernetes Dashboards, you can discover underutilized resources in a couple of clicks.
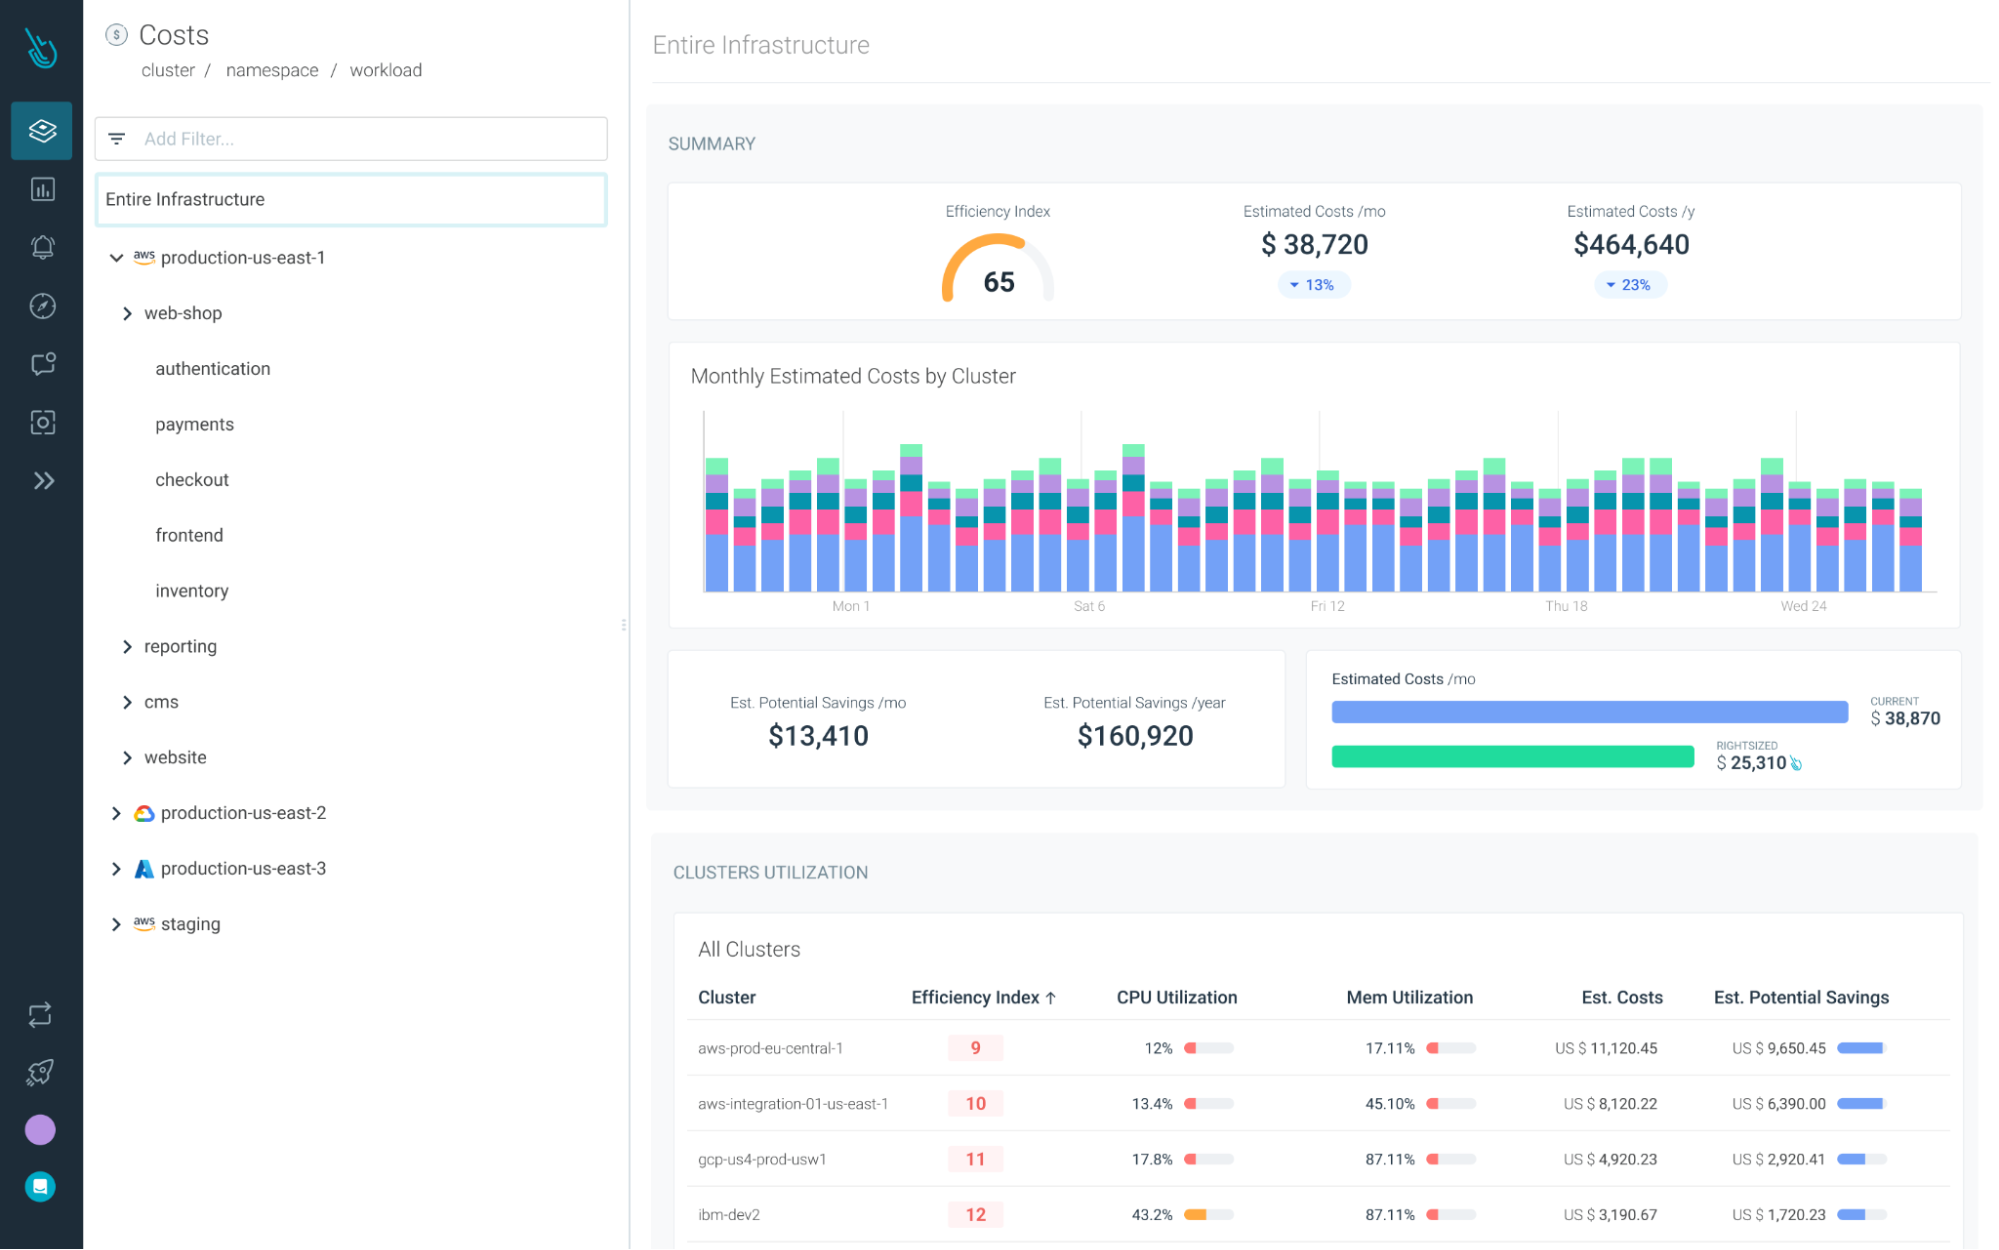
Try it free for 30 days!