


Falco Feeds extends the power of Falco by giving open source-focused companies access to expert-written rules that are continuously updated as new threats are discovered.

99% of the time HackerNews is an awesome time sink, but every once in awhile something there inspires you to try out a new technology, platform, etc. In this case two fresh slices of pizza and the HN post below were the perfect excuse to try a new cloud platform. We'll dive into spinning up a container cluster and monitoring Alibaba Container Service.
\r\r
\r\r
Alibaba Cloud has been around for awhile, but with their new $300 trial credit offer there's no reason not to spin up some instances to see what it's about.
\r\r
Not to be confused with AWS ECS Alibaba refers to their compute service as ECS and like GCP, AWS, and Azure they have many services for Databases, load balancers, etc. There's a ton of different free options, but naturally the first thing I wanted to check out was their container service.
\r\r
Setting up Alibaba Container Service
\r\r
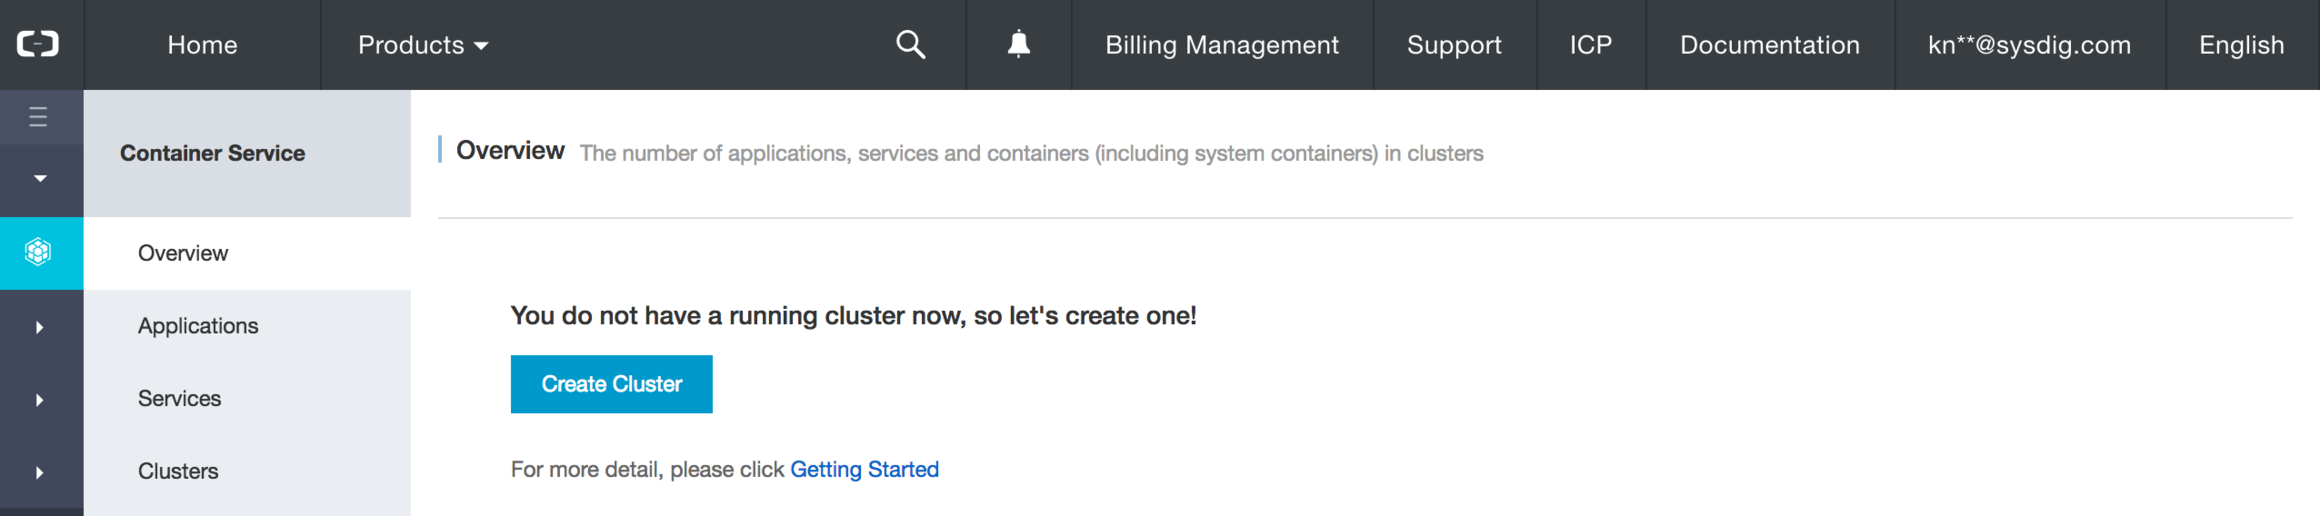
The Alibaba Container Service makes it easy to get a handful of hosts booted up, then to schedule and run containerized applications on them. But before we dive into visibility let's take a look at the building blocks of the Container Service. The first thing we need to do to get started is boot up a cluster.
\r\r
\r\r
When building a cluster just click through the GUI to choose your Region, Number of nodes, security group parameters and you're all set.
\r\r
\r\r
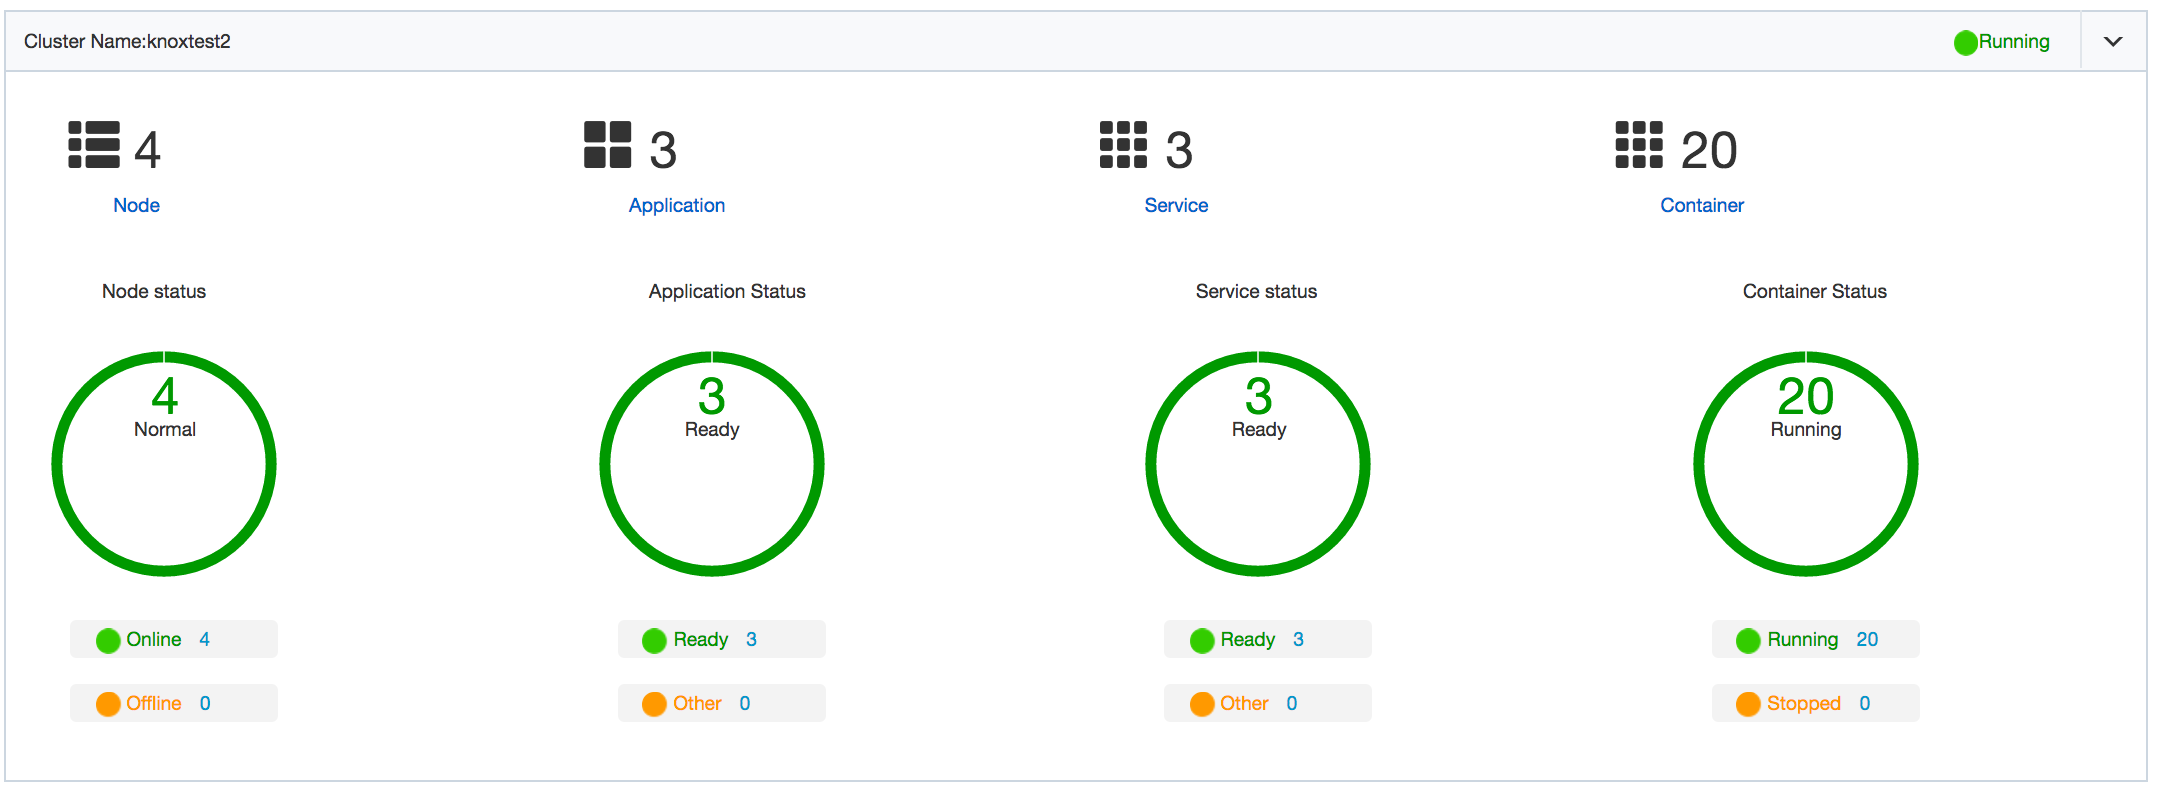
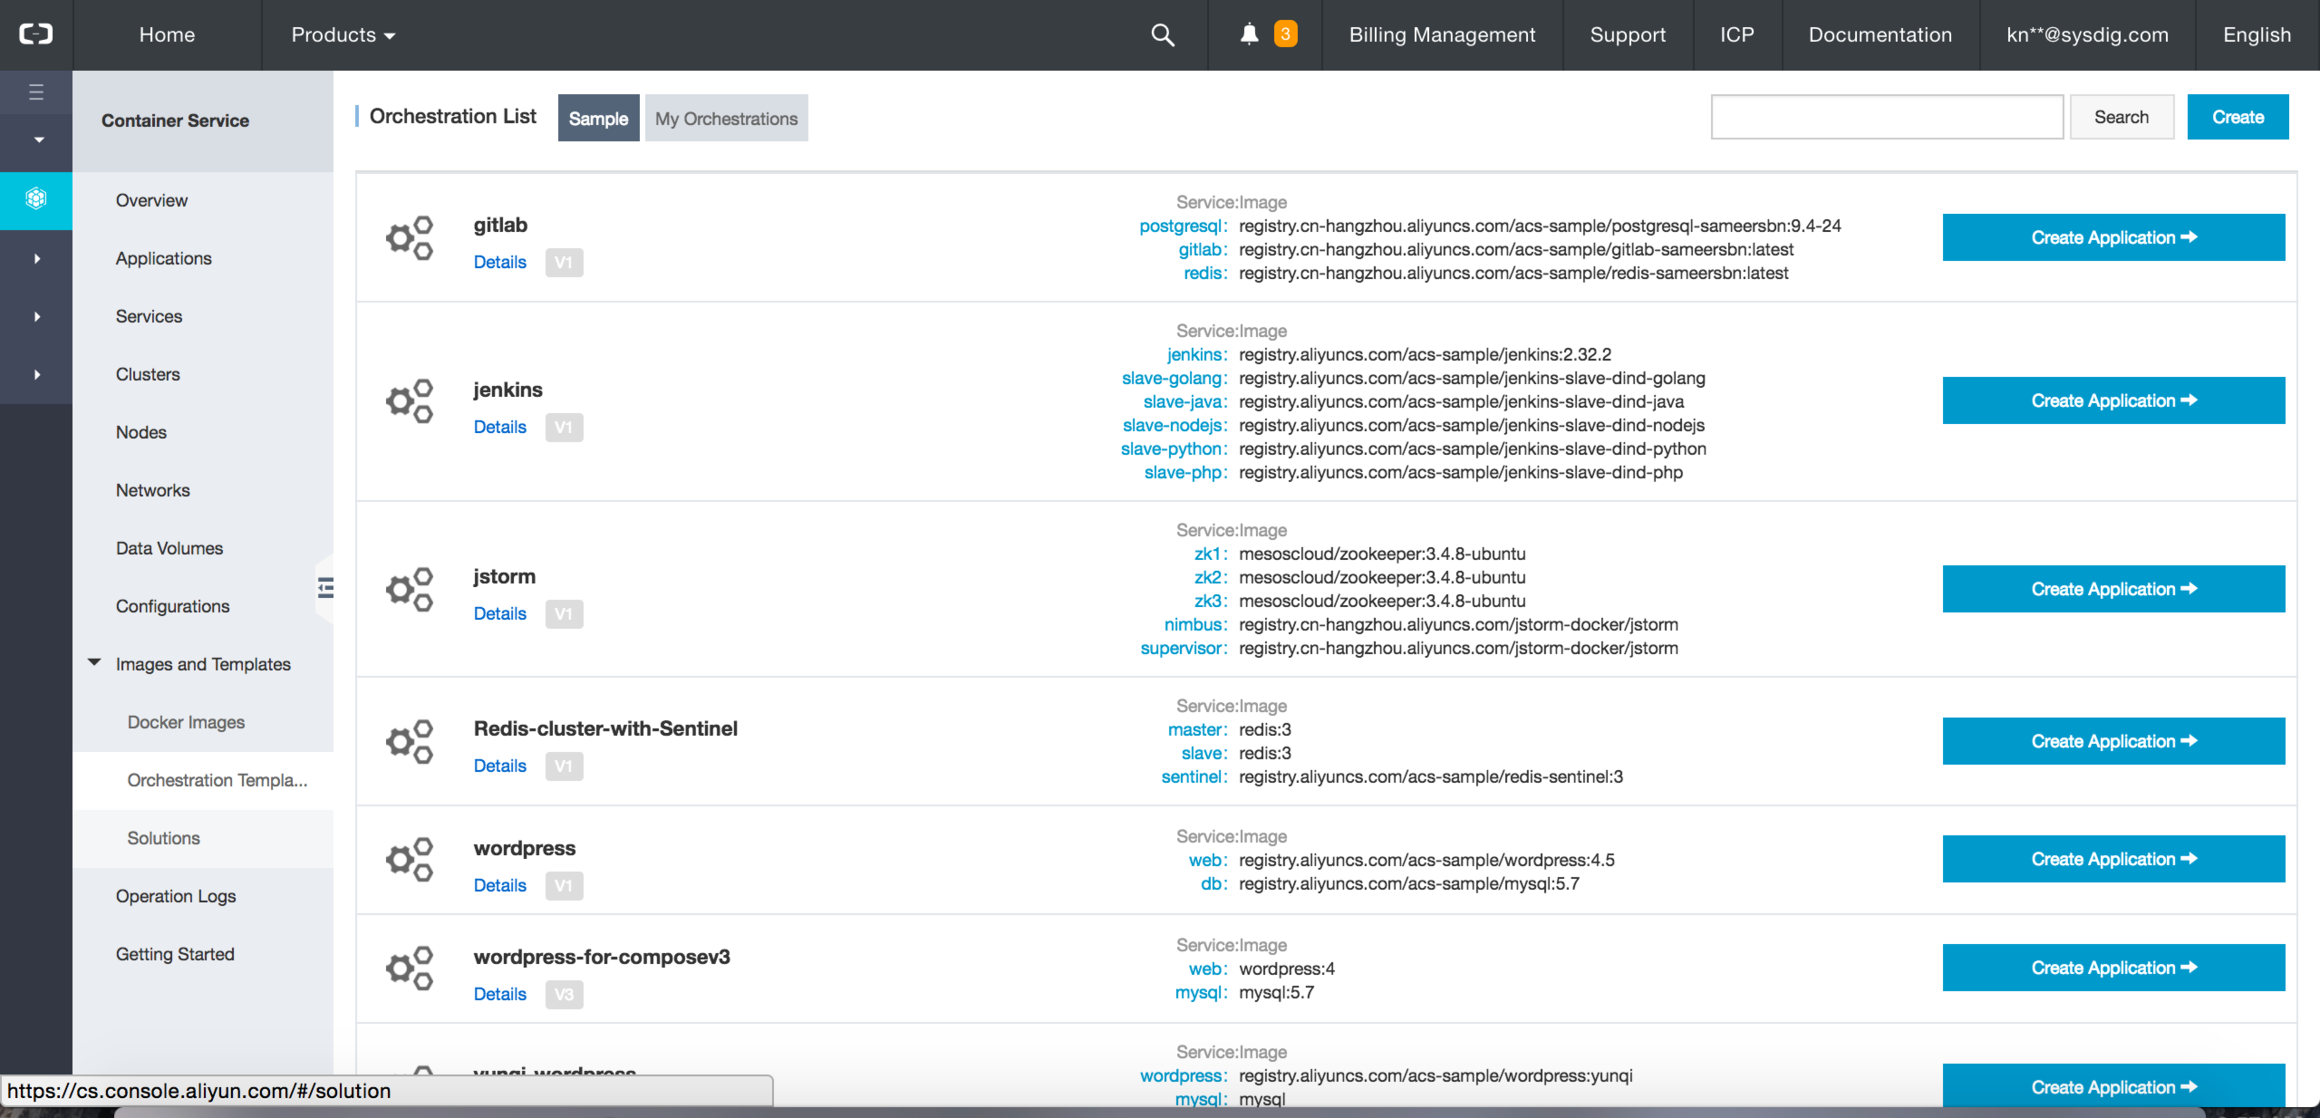
Now that you've got a small cluster of nodes, let's deploy some applications. There are a couple different options baked into the Container Service Console
\r\r
- \r
- Docker Images – Choose any image from the docker public repo and with a single click start that container on your service \r
- Orchestration – use docker compose within the console via orchestration templates, or roll your own orchestrator like kubernetes or mesos \r
- Applications – pre-built application stacks, or applications that you've uploaded to run in containers on the nodes in your cluster \r
\r\r
I chose to boot up one of the gitlab applications as well as the wordpress service into the cluster we have running.
\r\r
\r\r
Installing Sysdig Monitor
\r\r
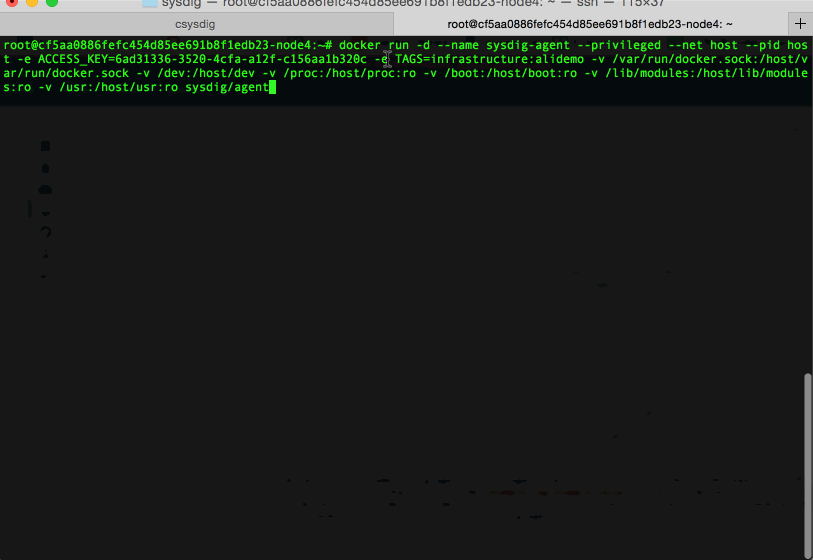
Installing Sysdig Monitor in your cluster is crazy fast. Just copy the docker run command or use existing orchestrator facilities like daemonset in kubernetes to get our agent installed. The Sysdig Monitor agent runs as a container on each node, and then loads a non block kernel module via DKMS to start collecting all system, application, network, and custom metrics (statsd, jmx, prometheus) from your system.
\r\r
\r\r
Monitoring Alibaba Container Service
\r\r
Monitoring Physical Infrastructure: Hosts & Containers
\r\r
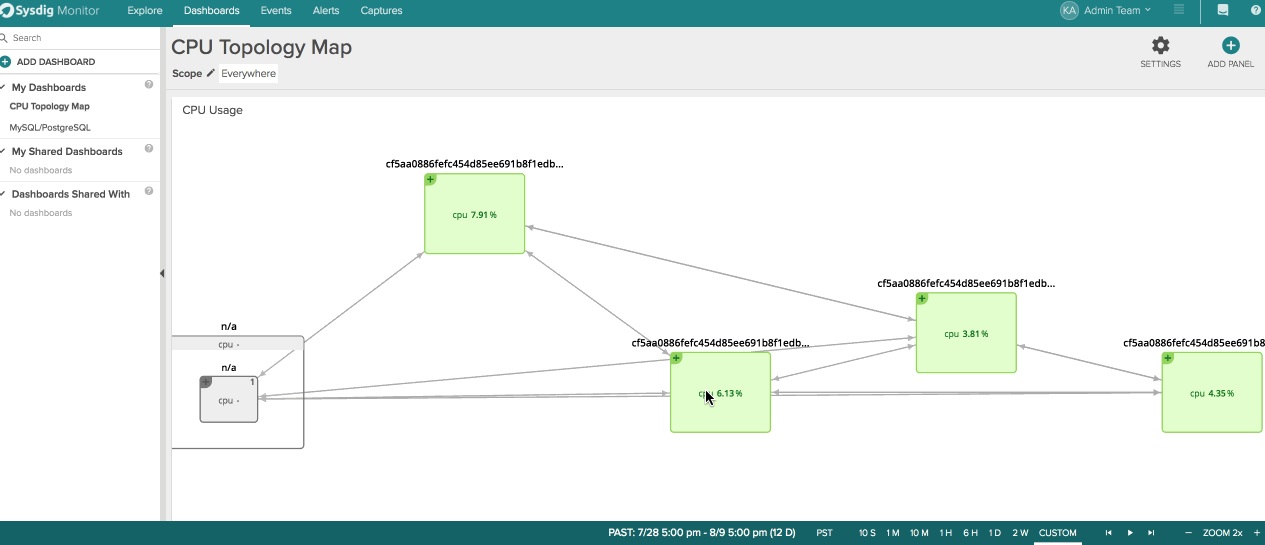
One of the first things to do when you get Sysdig Monitor installed in any environment is to look at a topology map of the cluster. Here we can see every node in the cluster, the cpu usage of the node, and then all ingress and egress connections to other nodes we're monitoring or external services.
\r\r
From here we can drill down even further inside the host and see all the containers, their network connections, and then go another layer deeper by drilling down to the process level or even syscall of what's running inside the container. This provides huge value into understanding the performance of Alibaba Container Service, most monitoring tools only provide container metrics via the docker stats API so you know "hey, my container is running at 98% CPU" but you don't know why, or what's running inside that container.
\r\r
\r\r How to create dynamic topology maps for Alibaba Container Service Click to tweet \r\r
Monitoring Applications running on Alibaba Container Service
\r\r
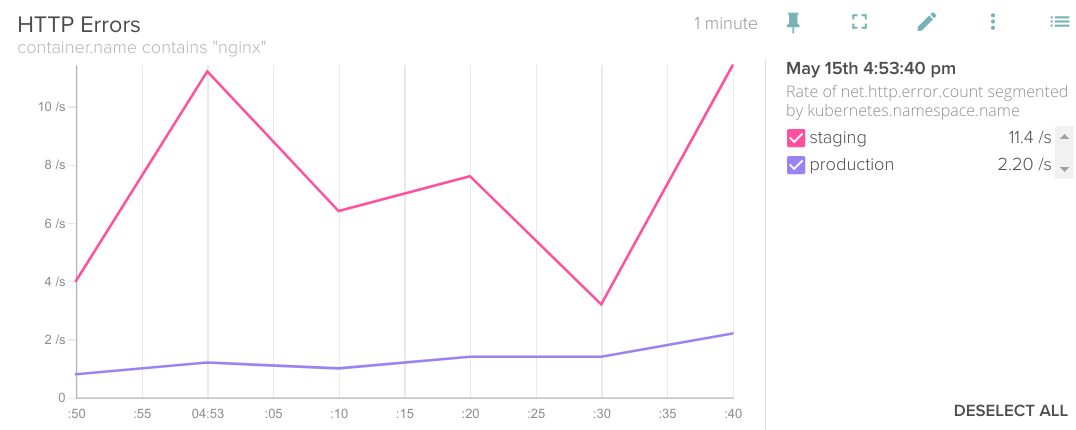
Next let's move to the application layer. In the previous gif we had looked at a host and noticed that there was a MySQL process running inside the wordpress container. Sysdig Monitor comes with hundreds of out of the box integrations with popular applications and services. We'll automatically recognize the process or protocol and then start pulling metrics from that application and tag them with the metadata from your cloud provider and orchestrator. Such as this example of nginx errors segmented by the kubernetes namespace that they're coming from.
\r\r
\r\r
The same applies to any custom metric from statsd, jmx or prometheus. Just install the agent as a container on the node and we'll discover everything whether it's running inside a container or on the node. Let's check out the gif below to see what this looks like for our containerized MySQL application.
\r\r
\r\r
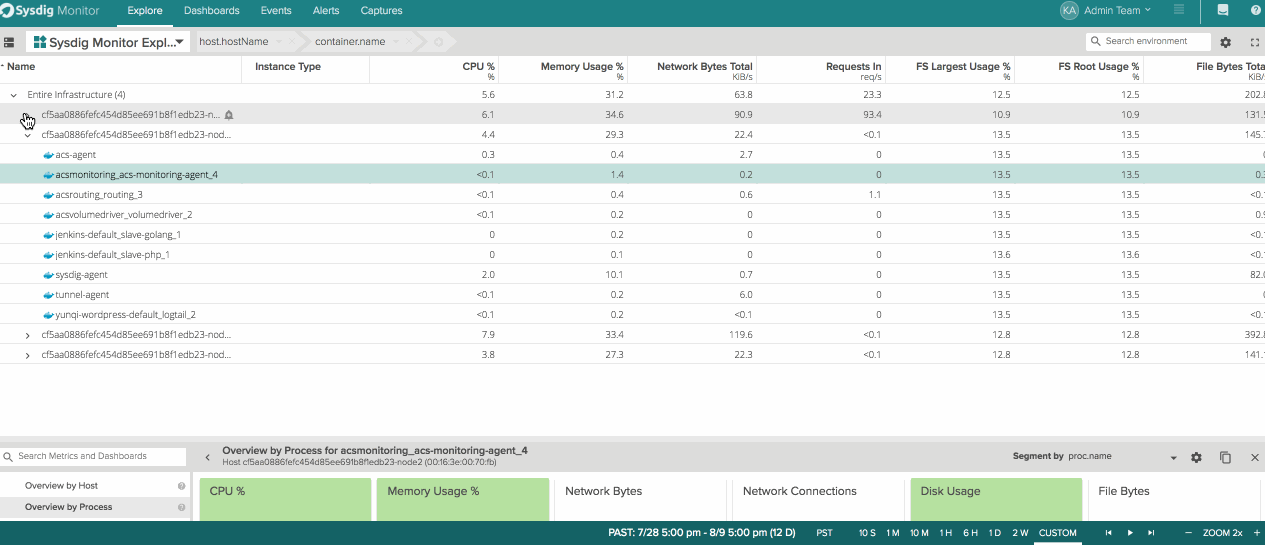
Exploring our Container Service Environment
\r\r
Next let's flip over to the explore page of Sysdig Monitor to slice and dice our infrastructure to dynamically troubleshoot and visualize services. The explore page works like an interactive top or pivot table so you can set up and hierarchy and change it on the fly depending on what questions you want to answer about services, hosts, or containers. Here we can look at hosts first, and then switch our grouping up to get the performance of images and the containers that are sharing that image regardless of what physical infrastructure they're running on.
\r\r
\r\r
Conclusion
\r\r
A couple of slices of pizza and some free credits to learn about monitoring Alibaba Container Service were more than enough to keep me entertained while futzing with different applications on this service.
\r\r
On the Sysdig Monitor side we've still barely touched the surface of the insights you can get into Alibaba Container Service. Check out some of these posts to learn more about how we do alerting, kubernetes monitoring, or more about our custom metrics integrations.
\r\r
If you're already running on Alibaba Container Service or any other cloud platform then kick off a 15 node free trial of Sysdig Monitor and let us know what you think!