


Falco Feeds extends the power of Falco by giving open source-focused companies access to expert-written rules that are continuously updated as new threats are discovered.

A few weeks ago, we announced that Sysdig is offering fully compatible Prometheus monitoring at scale for our customers, as well as a new website called PromCat.io hosting a curated repository of Prometheus exporters, dashboards and alerts. This got me thinking about how we were actually able to implement the changes necessary to offer this in our platform. Being somewhat new to Sysdig, I decided to sit down with Payal Chakravarty, VP of Product Management, and Jorge Salamero, Director of Product Management, to ask a few questions.
Why all the big fuss about Prometheus?
Jorge: Prometheus has been gaining more and more adoption and popularity as Kubernetes is also becoming more widely adopted. Basically, they are going side by side in a container marathon.
One of the things that is great about Prometheus is that it makes it very easy to get started with monitoring. Developers across your organization start playing with Kubernetes, and as soon as they deploy an application into those clusters, they need to get some visibility, like what's going on with CPU, memory usage, and how many instances are running. So it's very easy for them to deploy Prometheus alongside that Kubernetes cluster.
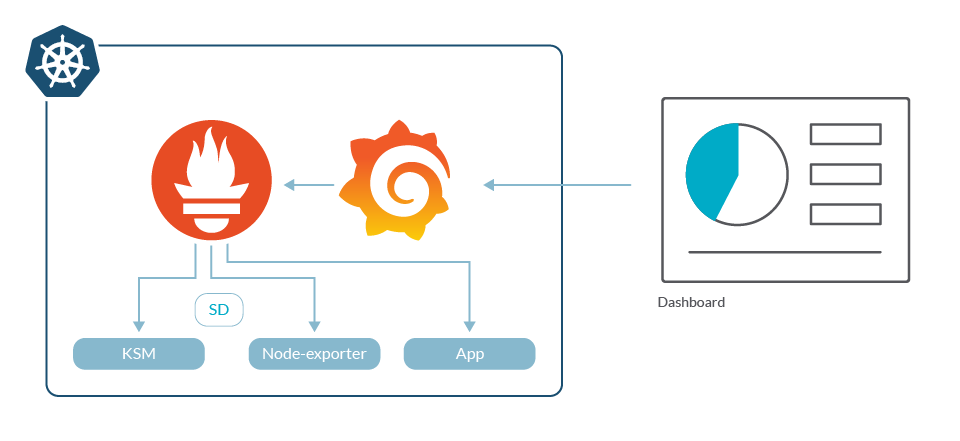
A simple Prometheus setup includes very few elements.
So ease of use is one key to Prometheus monitoring growth, but at what point do you start having issues?
Jorge: As you start moving things into production, you end up running a more diverse environment, and things start to become very tricky. Prometheus is built using a pull model, so it needs to be deployed locally on each cluster.
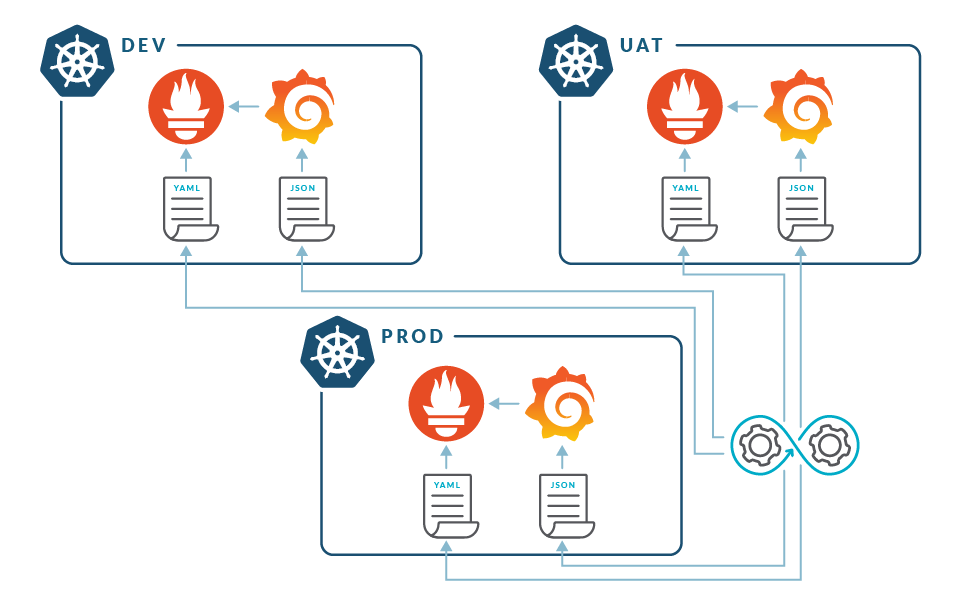
Prometheus needs to be deployed locally on each cluster
Your first cluster is fine, maybe even the second and third are too, but as soon as you have a bunch of clusters, you need to start logging into different environments to get visibility into those. You lack a global view. Then, as you move more production workloads into those clusters, you require larger scale. And this scaling impact can be felt even in medium-sized environments. You might start to wonder what we can see with these cloud-native environments? When you have containers spinning up and down, services restarting, nodes dying, and pods being rescheduled, the number of assets you need to track basically explodes.
If we do an analogy between pets and cattle, before, you had a few services or pets that you knew very well. Now, with Kubernetes, you have a whole herd of pods or containers. You can't give them all a name anymore. You've created a large number of different, small things that you need to track. That generates what we call cloud-native metric explosion.
How are we addressing that problem of Prometheus and scale?
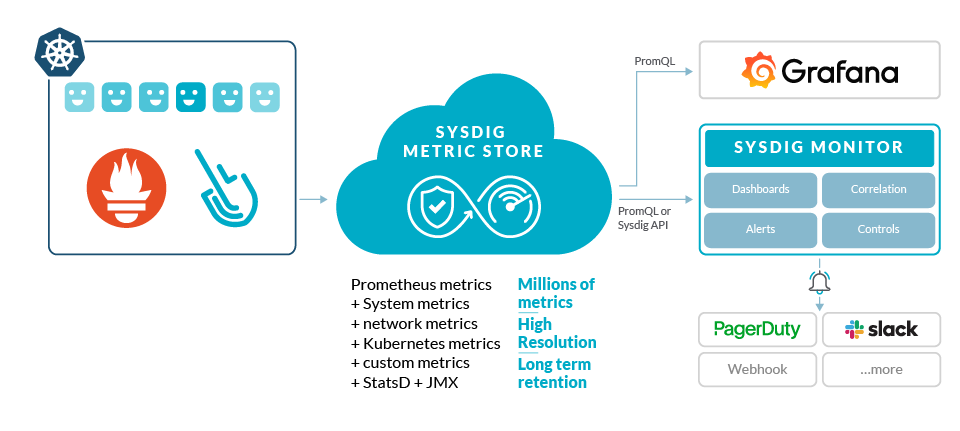
Jorge: First, we have developed full compatibility with Prometheus. From the outside you see a Sysdig deployment just as if it was a Prometheus server. It has the same APIs. You can query the metrics, using the Prometheus Query language (PromQL).
So all of the investment that developers have put into Prometheus, like creating dashboards, learning PromQL, and instrumenting their applications and infrastructure with Prometheus exporters, doesn't have to be thrown away when you move to Sysdig.
Basically, you switch backends and now, automatically, you get enterprise capabilities and scale on top of your existing investment. That's the big advantage of Sysdig, the ability to have full compatibility while we add enterprise functionality on top, like teams and RBAC. As you grow, we've got your back. You can grow as you need to in order to support your workloads and organizational requirements.
How far can we scale with the changes we have made?
Payal: Sure, Aaron. Scale has many different dimensions. Let's break it into the most important ones that we want to talk about. First, there is the number of nodes. Second, the number of time series, which I think is the most relevant in the context of monitoring. Time series is the combination of metrics and labels generated. In the Prometheus world, you may have heard the word "high cardinality", which means that when you combine the number of metrics and labels to generate time series, you can have a sudden explosion of data. You would have to figure out a system that can handle that high cardinality data, right? Third, there are a number of containers that are running per node. That's also a factor because as the number of containers grows, so does the number of Kubernetes objects. When I say Kubernetes objects, I'm talking about deployments, namespaces, statefulsets, etc.
In order to monitor all of that in depth and granularly, your system has to be capable of querying in an effective and efficient way. Looking at those three parameters and taking the ingestion and querying activity into consideration, now we can scale to hundred of thousands time series per agent.
Each node reports a combination of system resource usage metrics, Kubernetes metrics, Prometheus metrics, statsd, JMX, and custom metrics. Today, we typically see customers sending up to 10,000 Prometheus time series per node. That's in addition to the agent metrics that we provide out-of-the-box, like host, container, and kube state metrics which are not counted in that 10,000. If you take an average environment, that can be multiple million time series for just one customer. Now, if you're talking about an entire cloud environment like IBM cloud or you take one of our SaaS environments where we have hundreds of customers, then you're talking about hundreds of millions of time series that we're able to handle every 10 seconds.
Wow! How and when did we decide to go in this direction?
Payal: It's taken us close to two years to get where we are today. We started step by step. As I said before, we had different dimensions of scale. First, we had to scale the number of agents we support because we had some really large scale customers who were monitoring a hundred thousand nodes. So we had to be able to handle that. Then came the time series scaling and the container density. Three years ago we would see our average container density in the tens and twenties. Now, we see an average more in the 50 to 70 range and sometimes up to 150. So people are pushing the limits on density.
Similarly, we've seen an explosion of Kubernetes objects. There used to be mainly replication controllers, namespaces, and clusters. Now we see an increase in statefulsets, more daemonsets and more Kubernetes jobs being executed. So there's way more Kubernetes data we are being asked to handle. We planted the seeds about two years ago to examine how the cardinality of data and container density is increasing, and we knew that was going to lead to an explosion of time series. And then we started talking to a few customers who were pushing the limits on scale. They were ahead of the curve in a way. We started looking at our system and seeing where the bottlenecks were. We realized we had to build a time series database that could handle the scale that our customers were going to demand. Our classic data store wasn't really a pure time series database, but rather a bit of a hybrid between time series, host, container, and processes database.
There are many time series databases available in the market, including InfluxDB and OpenTSDB, among others, but they all faced certain challenges when it came to fine-tuning on the query side. Ingestion is easier because you can just push metrics and see how far it can go. That part was solved more in the industry than the query optimization. So, we had to break it down into parts. First, collection, which is how the agent can collect that much data and transport it to the backend. The second part was ingestion, providing a way to ingest all of that data and store it in a meaningful and optimized way so that it doesn't lead to cloud cost explosion. Third is optimizing that query part when you're querying that large of a data set using distributed query processing. So, step by step, we took those pieces and broke it down. On the query part and on the ingest side, we decided on Kafka to handle real time queries and Cassandra as the metric store. Then we wanted to determine how to handle long term data. Like if you want to look at 13 months back, how could we provide that? Those are all the parameters that we had to take a look at.
Looking at the actual changes we made, did we simply embed a Prometheus server into our platform?
Jorge: You can see many open source bits and pieces in Sysdig Monitor. Some of them are related to open source Prometheus, and some of them are other projects like Cortex. So you will find a diversity of different elements that you're going to find in Sysdig; for example, our agent uses a lightweight Prometheus server embedded in our agent, and our backend exposes the PromQL APIs leveraging some Cortex components. Other open source elements we use are Cassandra and Kafka, which are not part of Prometheus.
If we simply just used Prometheus we would not be solving any of the problems we identified from our customers. And it is important to note, on this journey, our engineers have been contributing actively to the open source projects we use making them better for everyone.
What did we actually change in the frontend (Sysdig Monitor)?
Jorge: We have actually rewritten our entire dashboarding engine to improve the user experience when monitoring Kubernetes from a Prometheus point of view. That's key for us.
We want to bring Prometheus for the masses to coin a term. Providing an opinionated experience and easy to use interface is one of our key differentiators. An opinionated experience is always a trade-off between exposing functionality and a certain degree of being able to customize things while still providing a predefined set of steps in your workflow. So, with that premise, we rebuilt the way we do dashboarding.
We still use PromQL, but it's different to other open source elements like Grafana. It's a streamlined experience where you can build dashboards using our UI, where you can navigate through the metrics, select the metric, select different operators or functions like average rate, maximum, or minimum. On the same screen, there's also the ability to use PromQL compatibility. You can actually combine both to create your dashboards that allow you to navigate and browse through the metrics and correlate all of the indicators that you need to do troubleshooting and monitoring for your Kubernetes environments.
Why did we release PromCat.io instead of just writing more proprietary integrations? And why does it live on its own web site?
Payal: Just to level set a little bit. Sysdig does have built-in integrations that we've supported for a while, and they are pretty automatic out of the box and they get you started. But what has been evolving in the Prometheans world is that as more and more applications and technologies are natively emitting Prometheus metrics, there is a whole community-sourced approach to monitoring a specific technology or application with Prometheus. There's a lot out there.
Today, the user experience for an organization using Prometheus is that they have to go search for an exporter that supports what they're looking to do. There may be multiple of them on GitHub with different star ratings and different levels of documentation. Then, they go search for the dashboards for Grafana. And again, there you could have 20 different options.
For example, if they just search for "node exporter" or "Kubernetes dashboards" there are dozens of them. They would have to make an explicit decision on which one to download, maybe basing their choice on popularity or a certain factor like that. And then they also have to maintain compatibility, for instance, if the version changes, or if they upgrade their software their dashboards may break because the metric name changed. We've heard users say that it took them a week of developer time to figure out which integration will work and how do they set it up and make it work in their environment? And that's just the upfront investment. There's the ongoing maintenance cost of that, too. So, as we started going down this path, we wanted to solve this problem.
We have this amazing system that can provide full compatibility and scale, but how do we make it easier for users to get their content? That brainstorming led to PromCat.io, a searchable repository that will give them step-by-step guidance on how to set up exporters, as well as dashboards and alerting rules. These can be used with Sysdig or in a complete, pure open source format if desired. For our customers, these will also be supported by Sysdig, so there will be somebody you can call if you need help or if this integration breaks. We keep the integrations up to date and use a test harness to test different releases to make sure that they work as expected.
In the future on our roadmap, what we have is a very seamless integration into the product. Sysdig will automatically tell you that we detected that you have Cassandra running, and provide you with the right dashboard and the proper steps you need to take to configure it. You will be able to seamlessly import items directly from the Prometheus catalog.
If we are taking that support burden off of the end user, how are we supporting this ourselves?
Jorge: Each integration on PromCat.io is a bundle of an exporter, dashboards and alerts with deployment instructions and they might have some recording rules for Prometheus. So we built a new support team that maintains these integrations so Sysdig customers don't need to worry about all of the heavy lifting.
For example, one of the recent integrations we published was collecting metrics from AWS services, and there were some exporters available out there, but they were done basically by hobbyists as a DIY project. The moment someone would deploy that exporter to retrieve metrics for AWS, they would generate thousands of metrics by default, creating an expensive bill. So our team worked to improve that exporter to make it work in larger scale environments. That's just one example of the work that this team does behind the scenes. Then, these changes are contributed back to the open source community.
Based on the lessons we learned, what recommendations would you give other organizations that are going through a big change like this?
Payal: Number one, I think with a platform transformation like this, you have to think about your existing customers as well as the new ones that you want to bring onboard. For new customers, you can introduce them to the new platform right away, but you have to think about how you're going to take your existing customer base along on this journey. They're used to certain things. They have historical data stored in certain formats. How do you migrate them from the classic stack to the new stack?
That's a big challenge that we are figuring out and we have a good plan here, but we're still learning every day. Added to that is the multidimensional problem we have of having both SaaS and on premises solutions. If it's SaaS, you do all of it yourself and take the pain of figuring out the problems within the company. For on premises, customers have to figure out an upgrade process that provides a smooth path to take them from one stack to another. That, to me, was the hardest challenge.
Another factor is that the ecosystem keeps changing. We are in such a new ecosystem that any dimensions we define can change three months later, whether it's the number of kube state metrics we want to ingest or the number of containers that we should allow on a host. When we started, we thought, 50 is good, but let's push it to 75. Now we're like, let's push it to 200. The scale goals are moving targets. They're not fixed. We have to evolve along with the ecosystem which makes it challenging because every customer has a unique environment. Some will have a lot of nodes plus a lot of time series, but less number of containers per node.
Understanding and classifying those different categories and where you have to fine tune the bottlenecks to work in each of those environments is a learning process. We can't think that we know all of the problems and that we're done fixing all of them. Being meticulous and ruthless about prioritizing the right things by identifying the biggest pain points to be solved is very important on a journey like this.
Jorge: I would agree on everything that Payal has said. I'll add that it is always important to find the sweet spot between providing opinionated experiences for new Kubernetes users and a highly detailed experience for those power users that are Prometheus experts and want to build on what they already know. You need to figure out how you can bring these two different worlds together into a product that can satisfy them both. It might appear that they are on opposite sides of the story, but actually, many of our customers have significant skill requirements while at the same time, they are onboarding new teams into Kubernetes monitoring. Making a product that keeps everyone happy is a very tough position that we need to take into account every day as product managers. We have some great ideas on the roadmap that will help with these scenarios.
We talked about a few things we are working on. What else is in the works for Sysdig Monitor?
Payal: Today, we have an agent that you install on your nodes that can scrape all of the Prometheus metrics and send it to our backend. That works very nicely from a user experience standpoint because you're just installing an agent and you're done. But from a scalability standpoint and for platforms where you can't install an agent like PaaS, or even serverless applications for that matter, it becomes more difficult. So, we are looking at a method of remote ingestion, which means that instead of using the agent, you can push the metrics from your Prometheus server directly to the Sysdig backend without installing agents.
Along with that, we're also looking at improving our billing mechanism where it's much more pay as you go based on the time series volume rather than per node. With remote ingestion, you don't have the node boundaries, so if you're paying for 10 million time series, you can use them however you want. You may have two hosts that generate two million metrics and the rest are minor. You'll be to do that and you'd still be billed only on your time series volume.
Jorge: We don't want to give too many spoilers, but the things my team is working on fall under three categories. Continually improving our integration with Prometheus environments, moving towards time series oriented monitoring, and easing the burden of using Prometheus with multiple teams. For PromCat.io, we are going to work on quickly developing coverage by adding supported Prometheus integrations for the most popular cloud-native stacks, as well as for the services offered by the major cloud service providers.
Conclusion
As you can probably tell, the changes we announced represent a great deal of effort. We listened to our customers and developed enhancements to Sysdig Monitor that will:
- Reduce roadblocks to scalable Prometheus monitoring
- Lower the burden of maintaining Prometheus environments
- Provide a supported solution with full Prometheus compatibility
- Enable us to provide more enhancements in the future
You can find out more about these features we released by watching our on-demand webinar or by signing up for a trial or demo.