


Falco Feeds extends the power of Falco by giving open source-focused companies access to expert-written rules that are continuously updated as new threats are discovered.

Welcome to another monthly update on what's new from Sysdig. Our team continues to work hard to bring great new features to all of our customers, automatically and for free! This month was mostly about compliance and a PromQL Query Explorer! Have a look below for the details.
We have added a number of new compliance standards to our compliance dashboards page, making it even easier for our customers to quickly (and continuously!) check how well they'd do from an audit. Our customers also receive guidelines on what they can do to improve their current configuration.
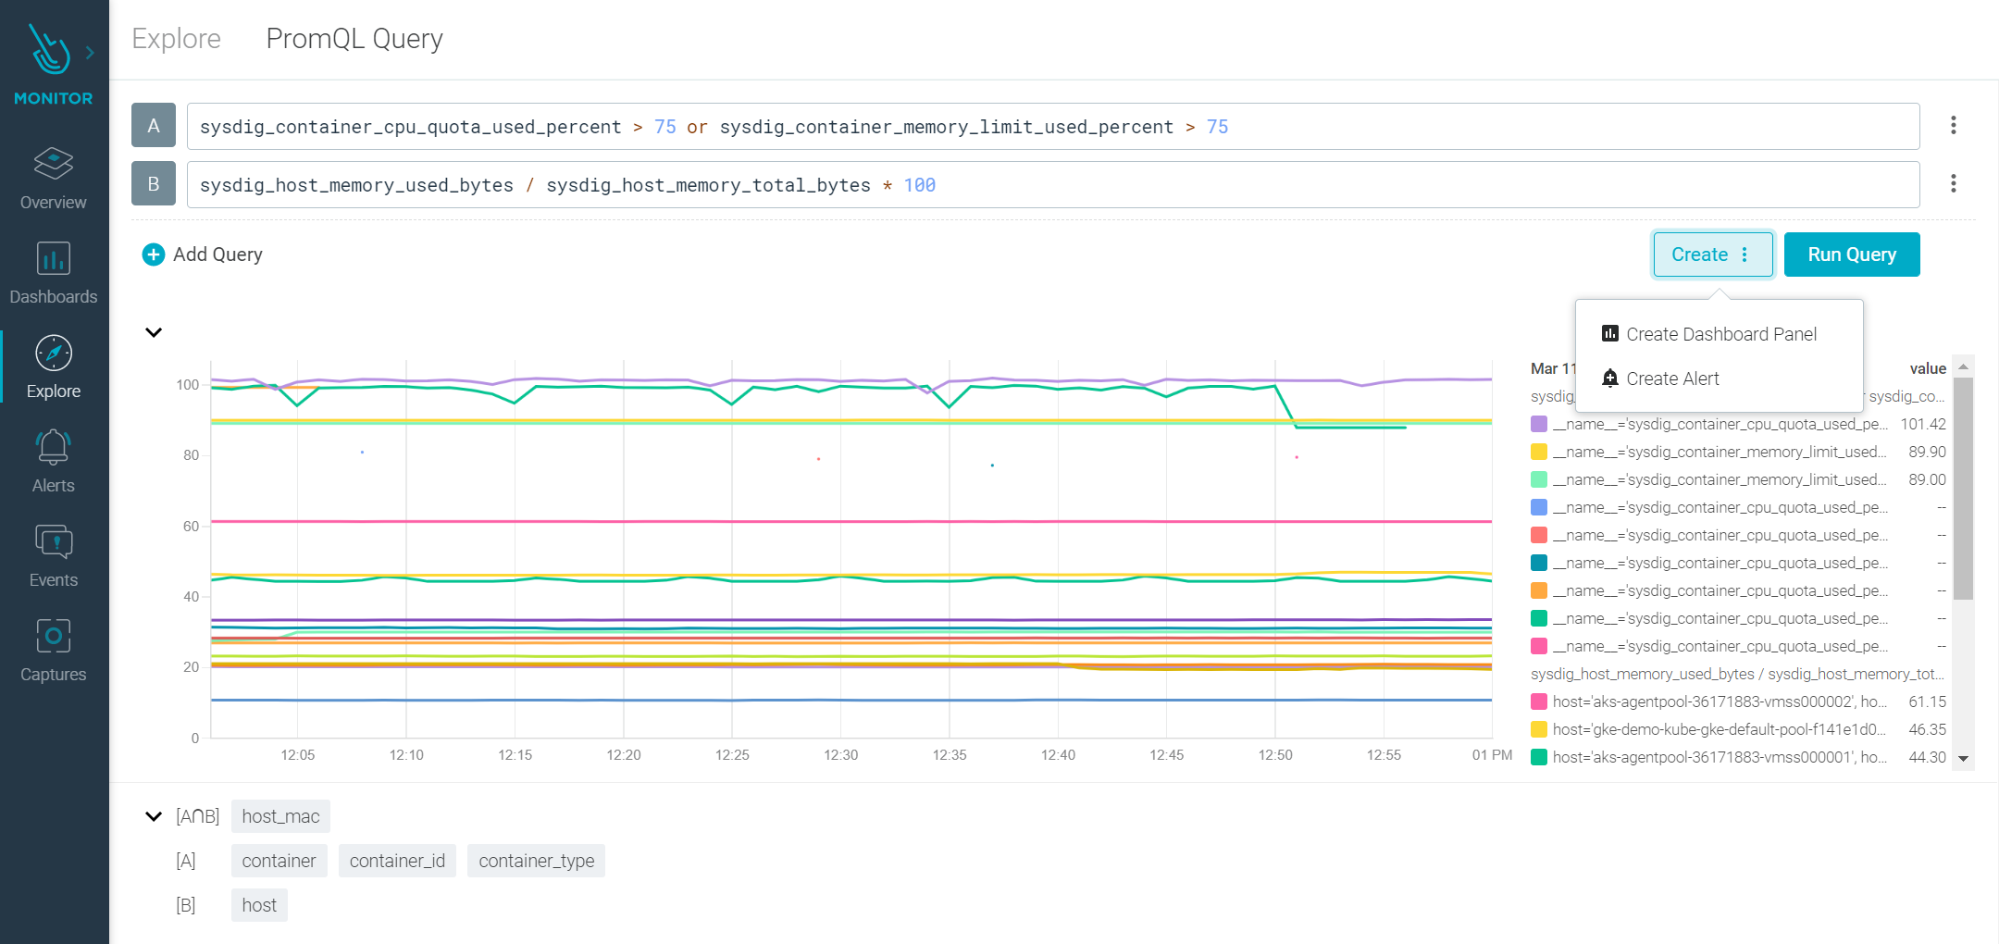
Additionally, we listened and heard about challenges navigating through thousands of metrics, trying to pick the right PromQL query to get the views that make most sense and give the best benefits. So we developed, and this month launched, a PromQL Query Explorer to again make our customers' lives easier. It will help build better, more meaningful dashboards, without asking everyone to memorize all of those metrics or queries.
We also added a bunch of extra great features, including Windows scanning support, UI based admission controller configuration, and support for IBM cloud functions. Have a read below!
As always, please go check out our own Release Notes for more details on product updates, and ping your local Sysdig contact if you have any questions about anything we cover here.
Sysdig Secure
Regulatory Compliance for SOC 2, NIST 800-53 rev4, and rev5
Three new compliance standards have been added to Sysdig compliance feature: SOC 2, NIST 800-53 rev4, and NIST 800-53 rev5.
The compliance validator now also includes new checks for the following features: Admission Controller, Network Security Policies, and Node Analyzer.
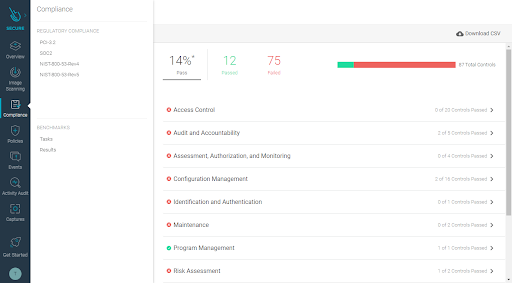
See the Compliance documentation for usage details and the controls implemented.
How customers are using this
Customers have told us that the need to have a continual up-to-date view of their current compliance posture and exposure is essential for their business, and something that auditors are routinely asking for. Several organizations are now implementing randomized internal audits, so the compliance dashboard is proving to be a very useful tool for them to prove compliance of their containerized environments. The new compliance standards have expanded the scope for our customers and allows them to quickly see which audits are passing or at risk.
Windows Scanning Released
A beta version of the Windows Scanning Inspector has been released. This is a new feature from Sysdig for scanning Windows containers.
Note: This is currently a standalone scanning engine. There is no centralized UI, management, or historical data. These features are planned for a future release.
See also: Windows Container Image Scanning [BETA].
Features
- Identify Windows container image vulnerabilities
- Windows OS CVEs
- Windows or Linux hosts
- Reports in JSON and PDF
- Policy support
- Severity
- Fix available
- Days since fixed
- Always inline
How customers are using this
As we see container adoption grow exponentially, we've started to see Windows containers be adopted and used more aggressively. Our customers want the same level of assurances and validation across their entire container estate, and that's the core benefit of introducing Windows Scanning support.
UI-Based Admission Controller Released
Kubernetes' admission controllers help you define and customize which requests are allowed on your cluster. An admission controller intercepts and processes requests to the Kubernetes API prior to persistence of the object, but after the request is authenticated and authorized.
Sysdig's Admission Controller (UI-based) builds upon Kubernetes and enhances the capacity of the image scanner to check images for Common Vulnerabilities and Exposures (CVEs), misconfigurations, outdated images, etc., elevating the scan policies from detection to actual prevention. Container images that do not fulfill the configured admission policies will be rejected from the cluster before being assigned to a node and allowed to run.
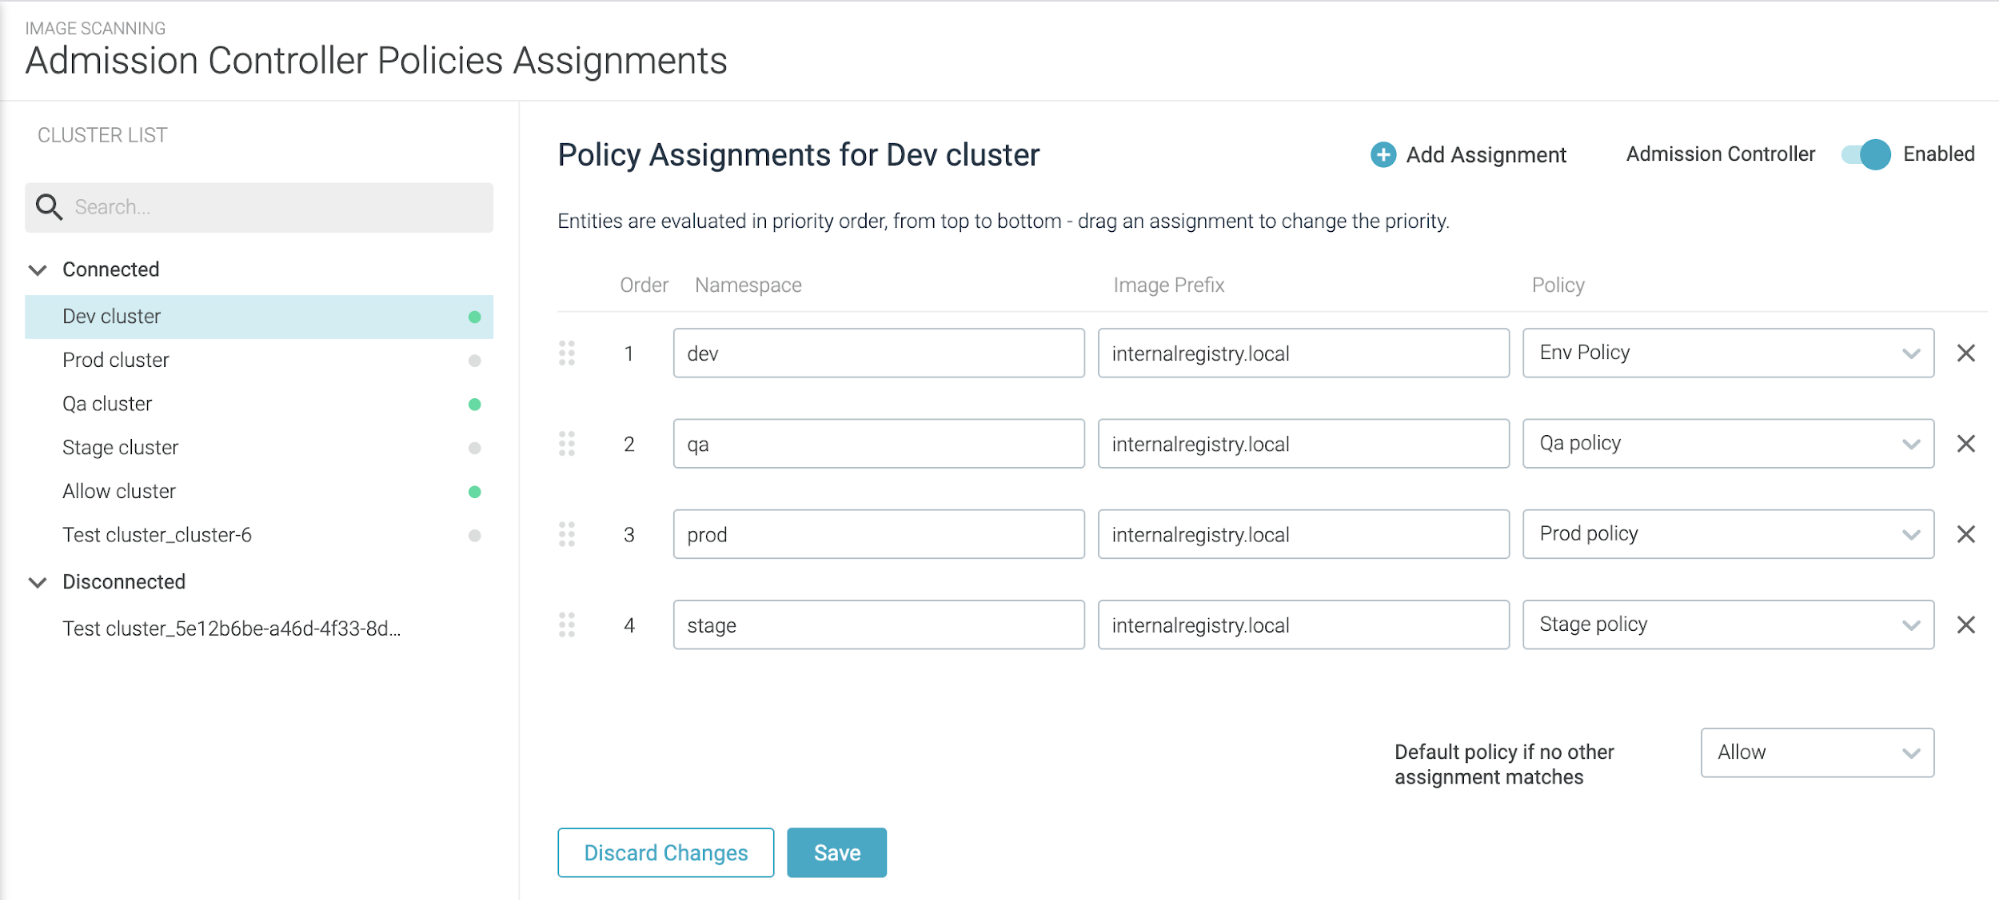
See also: Admission Controller.
Main Features
- Granular admission policies: Defining a global policy per cluster, but also at the level of particular namespaces or image paths (e.g., registries).
- Only allow images that pass the scanning evaluation criteria.
- Only allow images that have been evaluated recently.
- Only allow images that have been scanned before creation is requested to Kubernetes.
- Registry and repository whitelist.
- Scan unscanned requested images immediately (optional).
How customers are using this
Many of our customers have been using our first admission controller, but wanted to simplify the management of it. The new UI-based interface has allowed for both wider adoption, as well as better visibility into where the admission controller is being used. The feedback we received is that this gives more confidence that security and best practices are being adopted as part of the build face of the container lifecycle.
Image Scan Results Improvements
We've added improvements to the scan results UI to make it easier to understand and quicker to get to the important information. Our customers were asking for a cleaner view so they could focus more quickly on the important top-level information. The top-level scan results page has been updated to quickly highlight which scanning engine has performed the scan. This is a great way of identifying where in the application lifecycle the scan has been conducted and security policies applied. Additionally, users can quickly filter by registries; many of our customers have multiple registries and want a quick snapshot of each, or filter the relevance based on the image source.
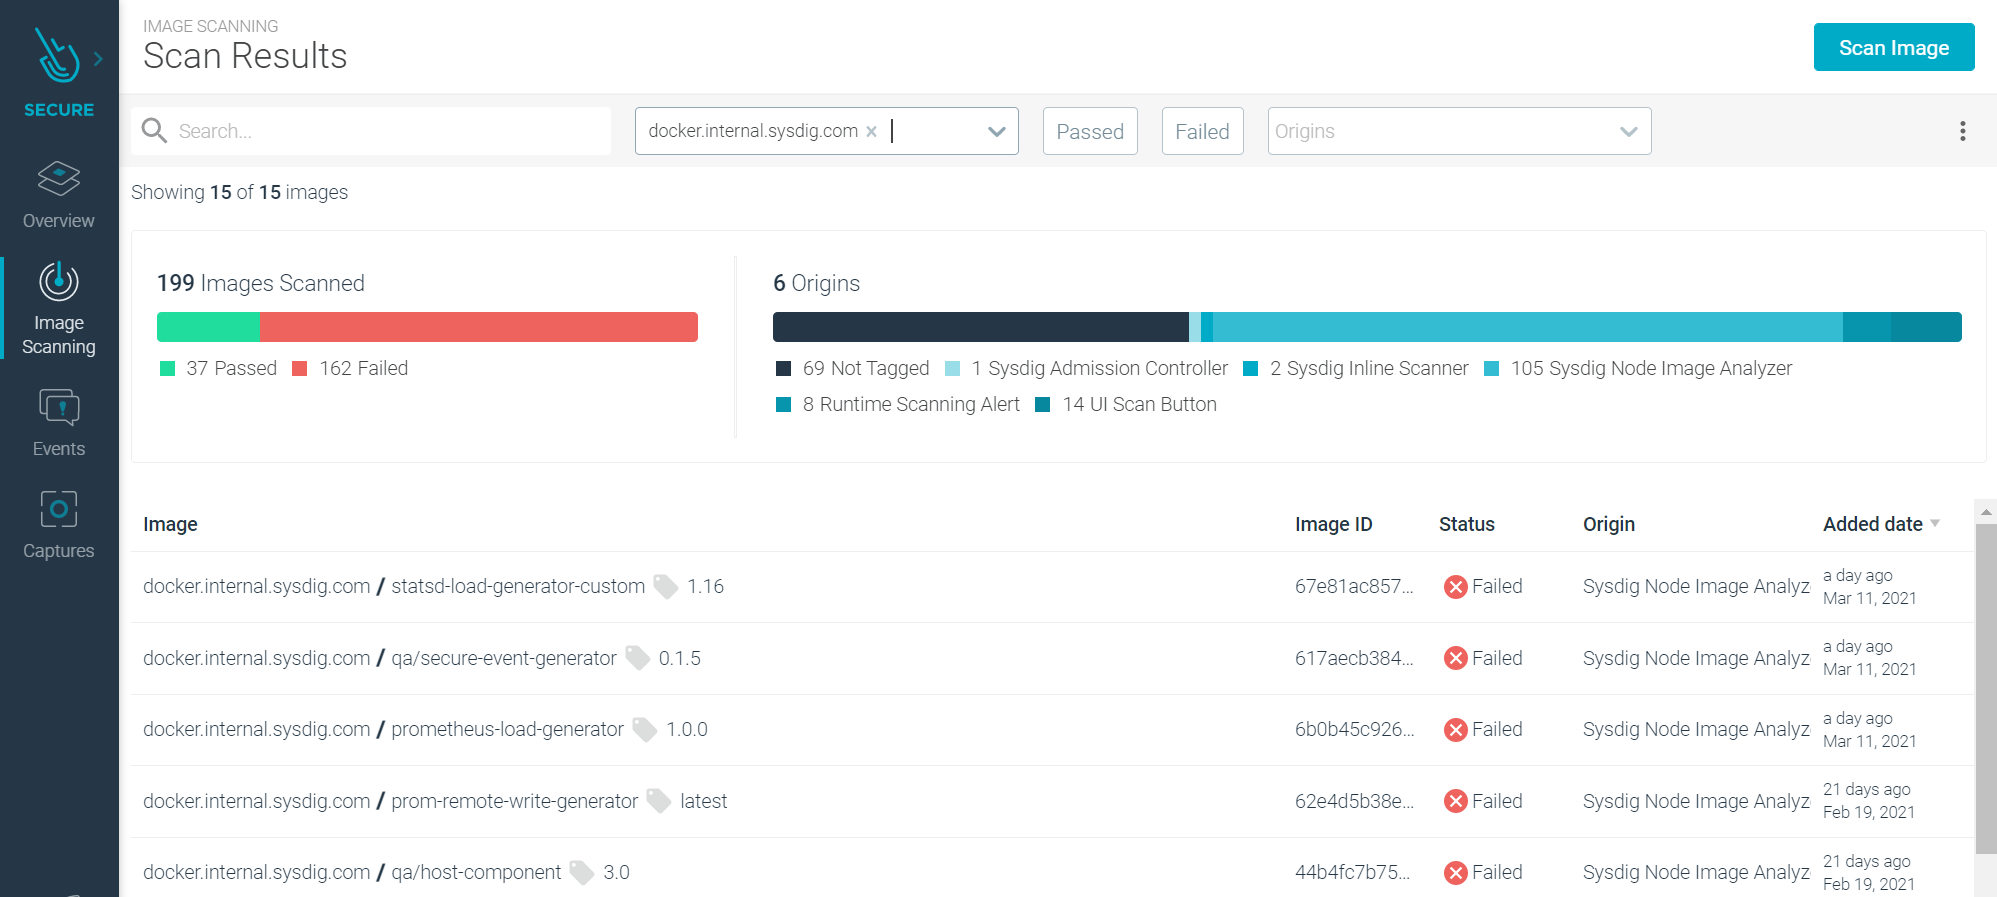
The summary charts at the top of the page are dynamic, so as you change the filters and narrow the scope, these stats change. This helps quickly answer common questions like: "How many failed images are there per scanning engine?". Digging deeper into the individual image scan results, looking at the discovered vulnerabilities, and we've again made improvements to the usability to help focus the attention on the key information and metadata. This helps to focus the attention more easily on the critical areas that need attention.
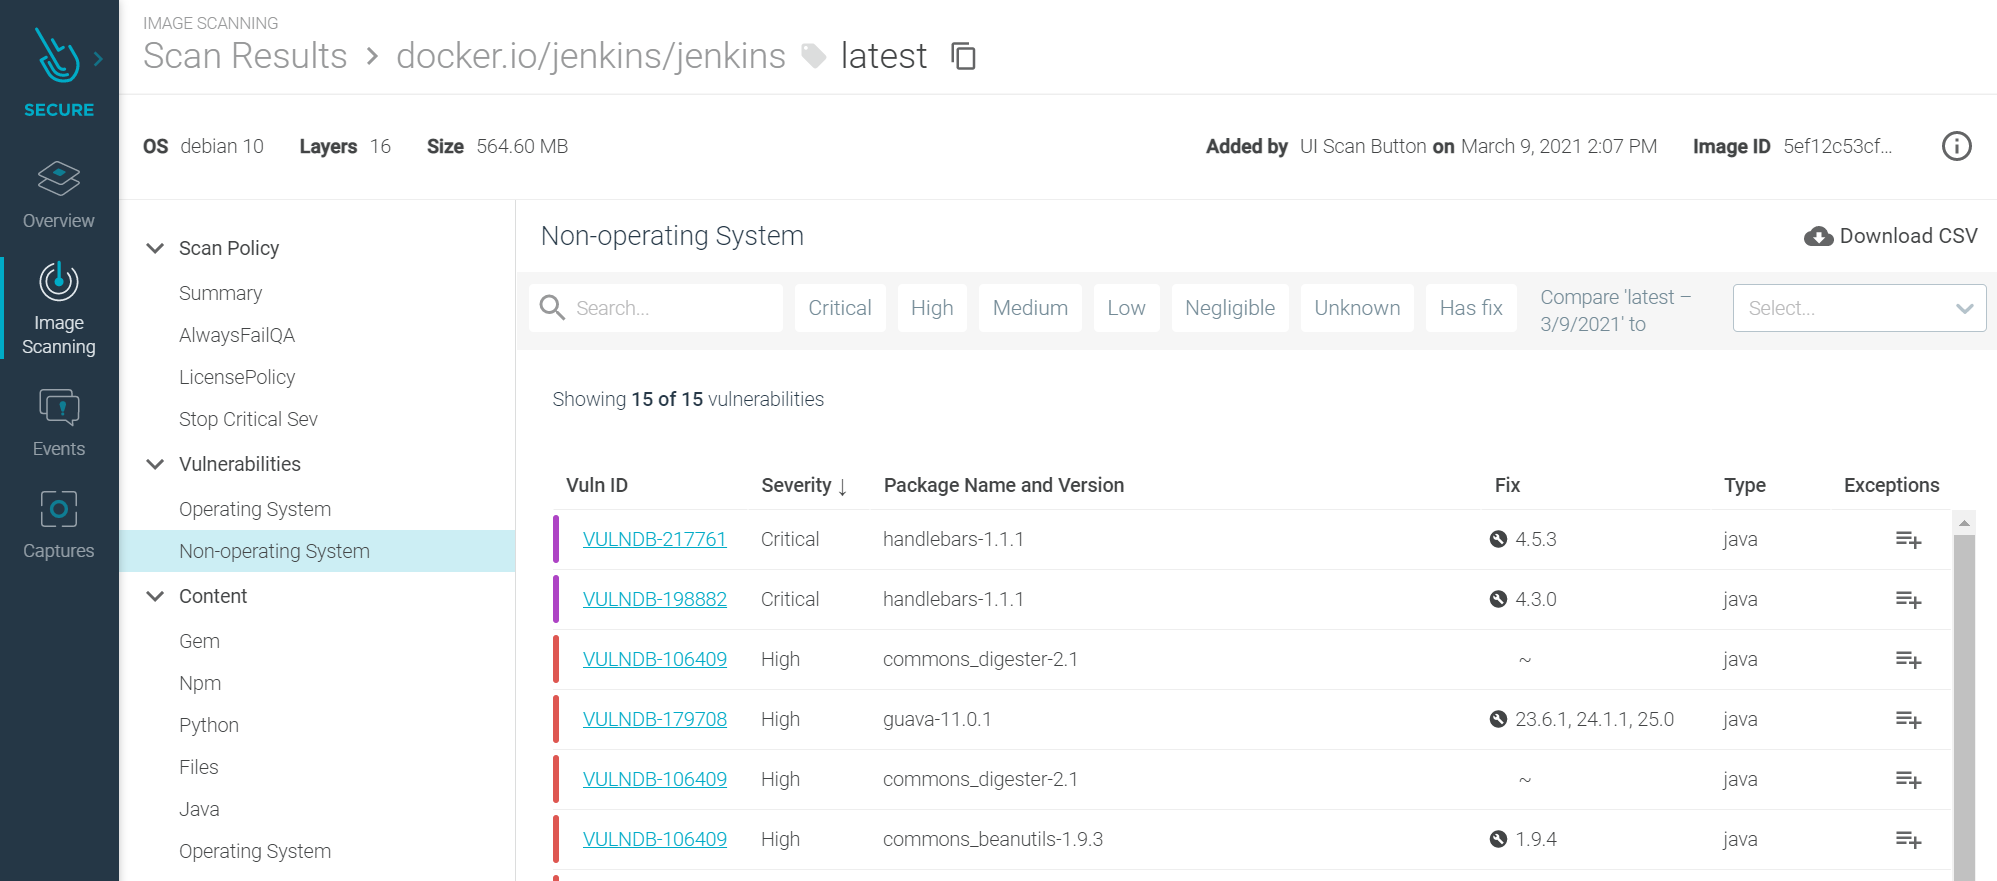
Using the quick filters at the top makes it quick and easy to filter the information, again quickly getting into what's important and most critical to take your attention. When ready, simply click to drill into more detailed information and get further details on a particular vulnerability. Now in the details, you can see the description of a vulnerability, as well as the source, both were common requests from our customers.
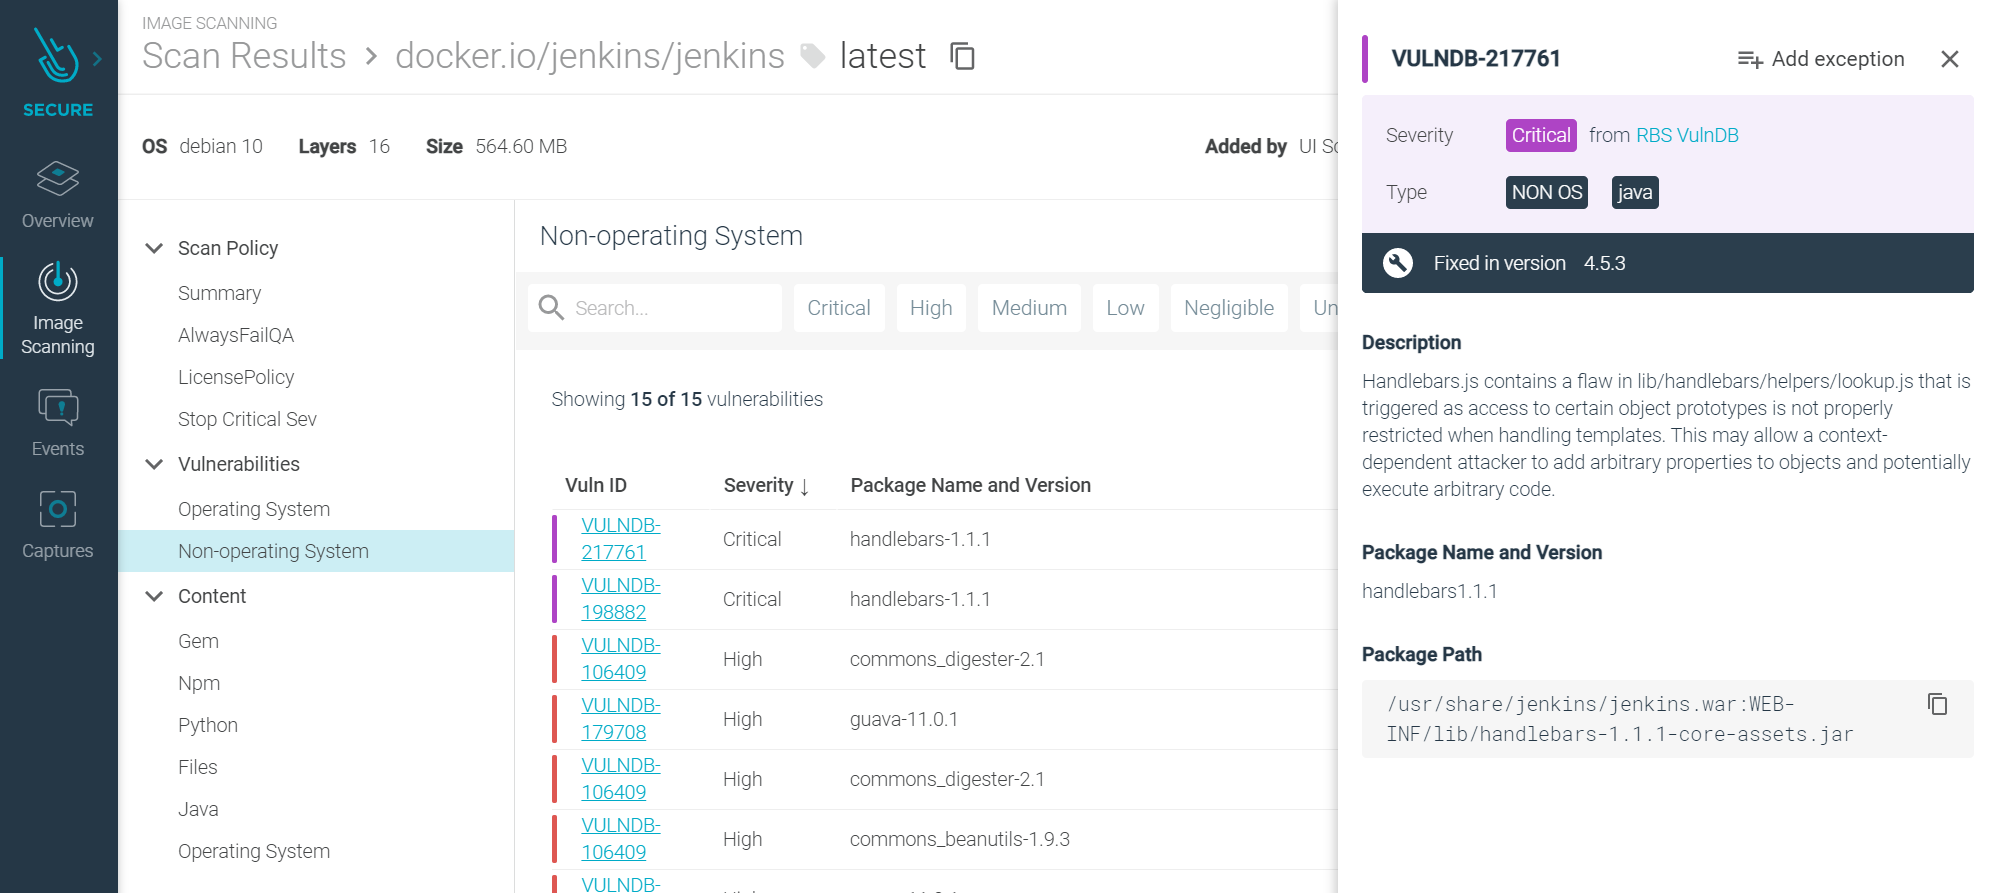
How customers are using this
For many of our customers, the sheer volume of vulnerabilities when doing an initial analysis can be overwhelming. Our customers tell us that being able to quickly filter and drill into the additional information when they need to focus on particular vulnerabilities has been important in prioritizing the fixes and mitigations.
Falco Rules
v0.10.5 is still the latest ruleset, which we covered last month.
Sysdig Monitor
PromQL Query Explorer
PromQL Explorer helps you understand metrics and their labels and values, and create queries faster before using them in Dashboards and Alerts. PromQL can be used not only with metrics collected from Prometheus endpoints, but also with Sysdig native metrics collected by the agent.
For more information, see Import Prometheus Alert Rules.
How customers are using this
We know many of our customers love Prometheus, and those that have already invested in PromQL dashboards have found it easy to migrate to and adopt Sysdig dashboards. But the more applications are instrumented with Prometheus, the more metrics are generated. Our customers have been telling us about the efficiencies they've seen by being able to quickly explore and compare different metrics, and then with a single click, convert the discovered metrics and queries into dashboard panels or alerts. This has simplified the adoption of Sysdig and allowed more users to get useful insights without big time investments.
IBM Cloud Functions
You can now use IBM Cloud Functions as a notification channel in Sysdig Monitor. Sysdig supports automatically sending alert notifications to an IBM Cloud Function Channel. You generally use it for the following use cases.
- Configure an IBM Function as a new notification channel in Sysdig Monitor.
- Pass extra parameters to an IBM Function.
- Modify an IBM Function.
- Delete an IBM Function.
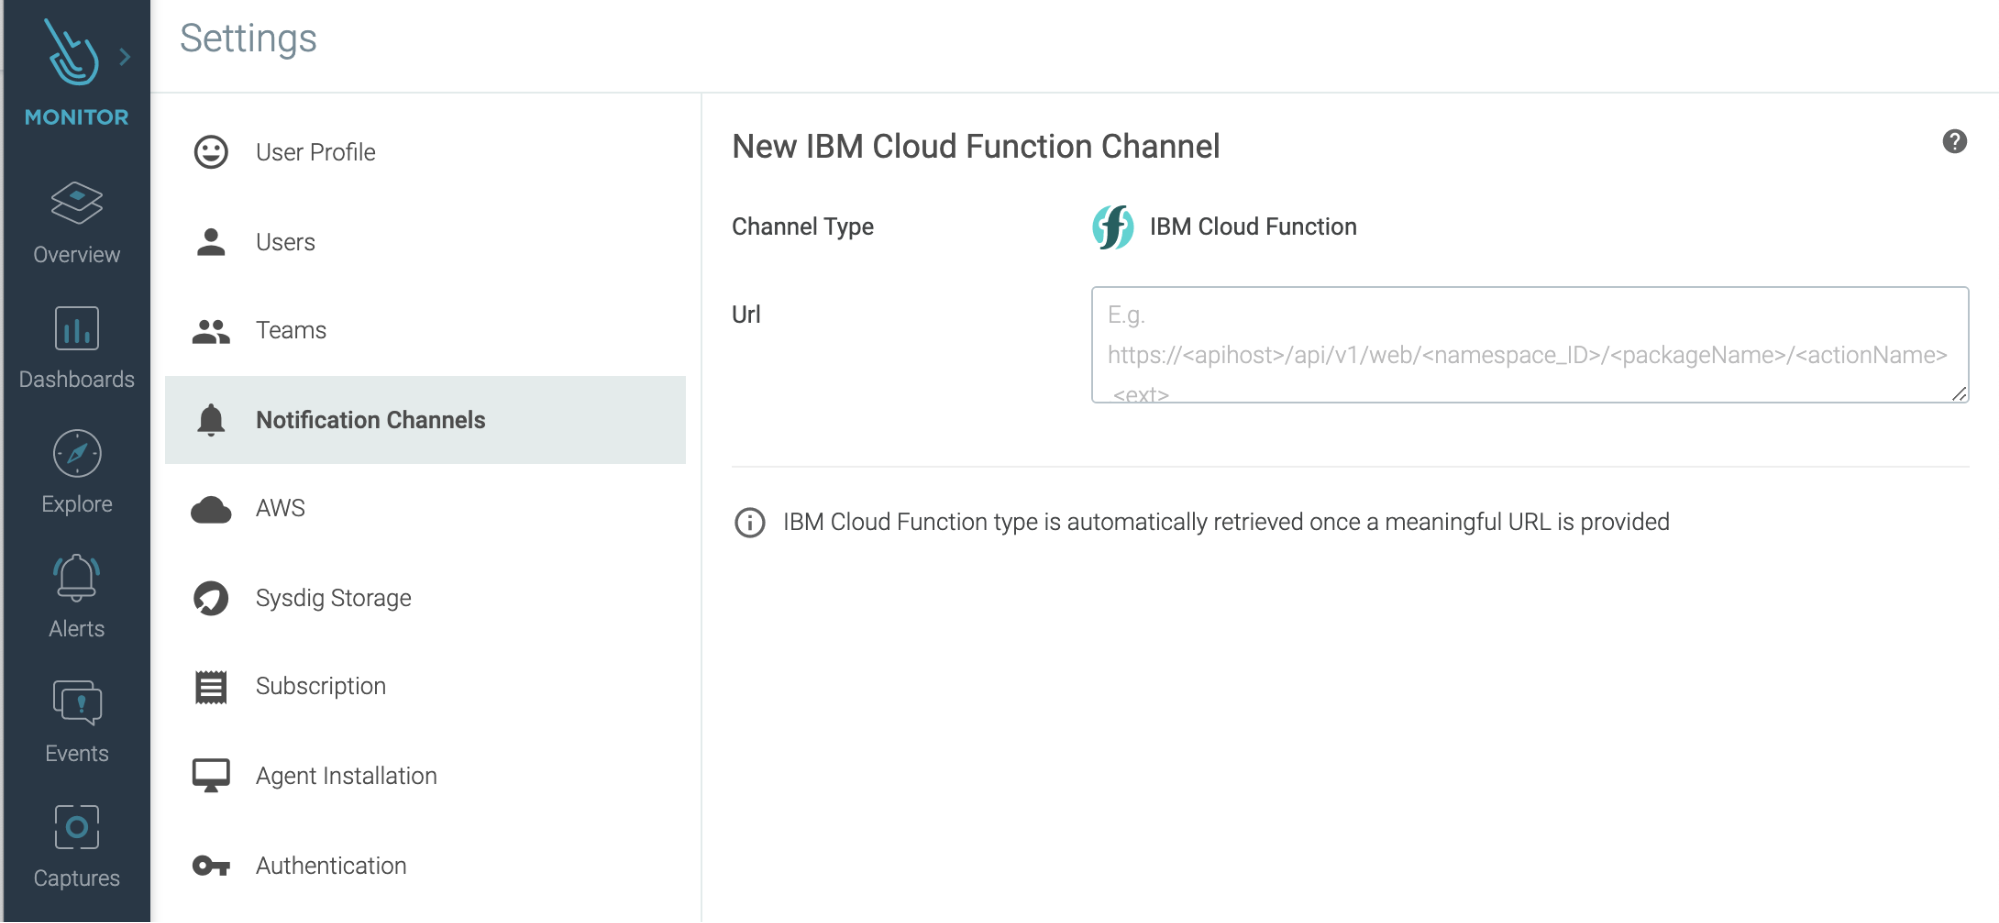
How customers are using this
This has allowed several of our customers to start implementing more advanced routing for notifications (configuring decision-making based on notification content in the IBM Cloud Function) and automated actions. Without a doubt, more use-cases will come out for this integration.
SAML Single Logout
Sysdig supports SAML Single Logout. This feature enables you to configure automatic logout from the Identity Provider when users log out of Sysdig. This feature is currently available for SaaS regions US-West and EU-Central.
For more information, see Configure SAML Single Logout.
How customers are using this
Many of our customers have central security governance on how different systems operate. By supporting SAML Single Logout, they can extend the standard policies of forcing logout across all SAML authenticated applications to now include Sysdig.
Enhanced Dashboard Scope Session
A small but useful update: when returning to a previously visited Dashboard, the UI retains your last used scope.
Sysdig Agents
Sysdig Agent
The latest Sysdig Agent release is 11.0.0. Below is a diff of updates since 10.9.1, which we covered in our last update.
Thin Cointerface to Reduce Memory Usage
Thin cointerface reduces the memory required to handle the Kubernetes metadata on both the agent and the Kubernetes API Server. The reduction in memory usage is significant for Kubernetes clusters with a large number of pods (in the range of 10,000 or more) or clusters that heavily use Replication Controllers.
Using this feature returns the same data to the Sysdig backend and does not affect any Sysdig features. The thin cointerface feature is disabled by default.
Also see: Reduce Memory Consumption in Agent.
File Logging Capability
Per-component file logging capability for an additional set of agent components has been enabled.
For more information, see Manage File Logging for Agent Components.
Reduce Agent Memory Consumed by Prometheus
The number of Prometheus time series ingested has been limited to reduce agent memory consumption. This limit is applied after Prometheus relabeling rules are applied but before the agent's metric filter and metric limit.
Missing Metrics Due to Aggregation in Agent Fixed
Fixed an issue where processes with certain names were improperly aggregated, which in turn caused missing metrics in certain situations.
Cointerface Fix
Fixed an issue that caused the agent's cointerface process to restart continuously while processing kubernetes label selectors.
Sysdig Agent – Helm chart
The Helm Chart 1.11.7 is the latest version. Below is a diff of updates since v1.11.3, which we covered in our last update.
- Update Node Image Analyzer to 0.1.10 by default.
- Fix VERIFY_CERTIFICATE setting for Node Image Analyzer.
- Add tolerations configuration item to Node Image Analyzer.
- Use the latest image from Agent (11.0.0).
Node image analyzer
Version 0.1.10 was released and contains the following diff updates since v0.1.9, which we covered in our last update.
- Improved handling of more variations to Tomcat Java packages.
Node image analyzer can be installed as part of the Sysdig Agent install.
Inline scanning engine
Version 2.3.2 was released and contains the following diff updates since v2.3, which we covered in our last update.
- Trailing slash on
--sysdig-urlis now automatically trimmed if present. - Custom annotation(s) are now correctly sent to Sysdig backend.
Also see: Integrate with CI/CD Tools.
SDK, CLI and Tools
Sysdig CLI
v0.7.5 of the Sysdig CLI is the latest release. Below is a diff of updates since v0.7.4, which we covered in our last update.
- Fix displaying panel list for dashboards with text panels. Solves an error while executing sdc-cli dashboard panel list for dashboards with Text Panel.
Python SDK
v0.14.13 is still the latest release.
Terraform provider
v0.5.12 has been released. Below are the diff changes from v0.5.11, which we covered last month. You can take a look at the documentation.
Bug Fixes:
trigger_after_pctnot handled correctly insysdig_monitor_alert_downtimeresource.
Falco VS Code extension
v0.1.0 is still the latest release.
Sysdig Cloud Connector
Sysdig Cloud Connector v0.5.1 was released. Here's a diff of updates since v0.4.4, which we covered last month:
- Enhance scope info for CloudTrail events.
- Create an independent rules-validator.
- Allow to set secure url from env variable.
- Notify events in Secure using policies information and honoring its scope.
- Added ECS exec rule.
- Rule hot reloading every five minutes.
- Load rules honoring policies from Sysdig Secure.
- Evaluate an event atomically. You will notice some performance improvements.
- Add Google Cloud Storage rule provider.
- Add HTTP retry strategy with backoff.
- Return errors on validator when syscall and k8s fields are present for aws_cloudtrail rules.
- Added
Terminal Shell in ECS Containerrule. - Add telemetry for retrieving product metrics.
- Add CloudTrail Terraform module.
- Add Terraform Module deployment.
- Honor policy severity when sending events to Secure.
- Show aws.user when an event comes from a role.
You can take a look at all the releases.
Sysdig Secure inline scan for Github Actions
v3 is still the latest version.
Sysdig Secure Jenkins plugin
Sysdig Secure Jenkins Plugin v2.1.4 was released. Below is a diff of updates since v2.1, which we covered last month.
- Add the new
forceScanoption to backend scanning, forcing rescan of the image even if the tag is already known in the backend. - Automatically set the
forceScanoption when Dockerfile is provided. Otherwise, the backend API call will fail for existing images. - Invalid JSON parsing error when running the plugin with debug logging enabled.
- Add support for
DOCKER_HOST,DOCKER_TLS_VERIFY, andDOCKER_CERTS_PATHvariables, allowing you to use Docker-in-Docker or Docker with TCP. - Allow overriding inline-scan default container images, for air-gapped environments or pinning a fixed version.
- Fix missing outputs in console when using the latest inline-scan container version.
- Hide a leaked
exceptionmessage in the console log that shouldn't be shown, as it is handled correctly.
New website resources
Blogs
- ECS Fargate threat modeling
- Running commands securely in containers with Amazon ECS Exec and Sysdig
- Getting started with PromQL – Includes Cheatsheet!
- Detecting and mitigating Apache Unomi's CVE-2020-13942 – Remote Code Execution (RCE)
- Top 20 Dockerfile best practices
- Write Prometheus queries faster with our new PromQL Explorer
- Detecting MITRE ATT&CK: Privilege escalation with Falco
- Sysdig contributes Falco's kernel module, eBPF probe, and libraries to the CNCF
- Sysdig achieves Red Hat Vulnerability Scanner Certification
- Kubernetes admission controllers in 5 minutes
- Shielding your Kubernetes runtime with image scanning on admission controller
Webinars
- Accelerate your FedRAMP journey for container security with Anitian & Sysdig
- Consistent Container Vulnerability Scanning with Red Hat & Sysdig
- Accelerate Threat Detection Across Clouds and Containers
- Supercharging Kubernetes Labels And Metrics