Since our last release notes, Sysdig team has been working hard and summer season hasn’t slowed the release of awesome features. We’re really excited to round up all the great stuff we’ve done into our Fall Release notes.
Let’s do a quick run-down on the most important features and where possible we will link you to deeper information on how to use the features.
Making troubleshooting easier
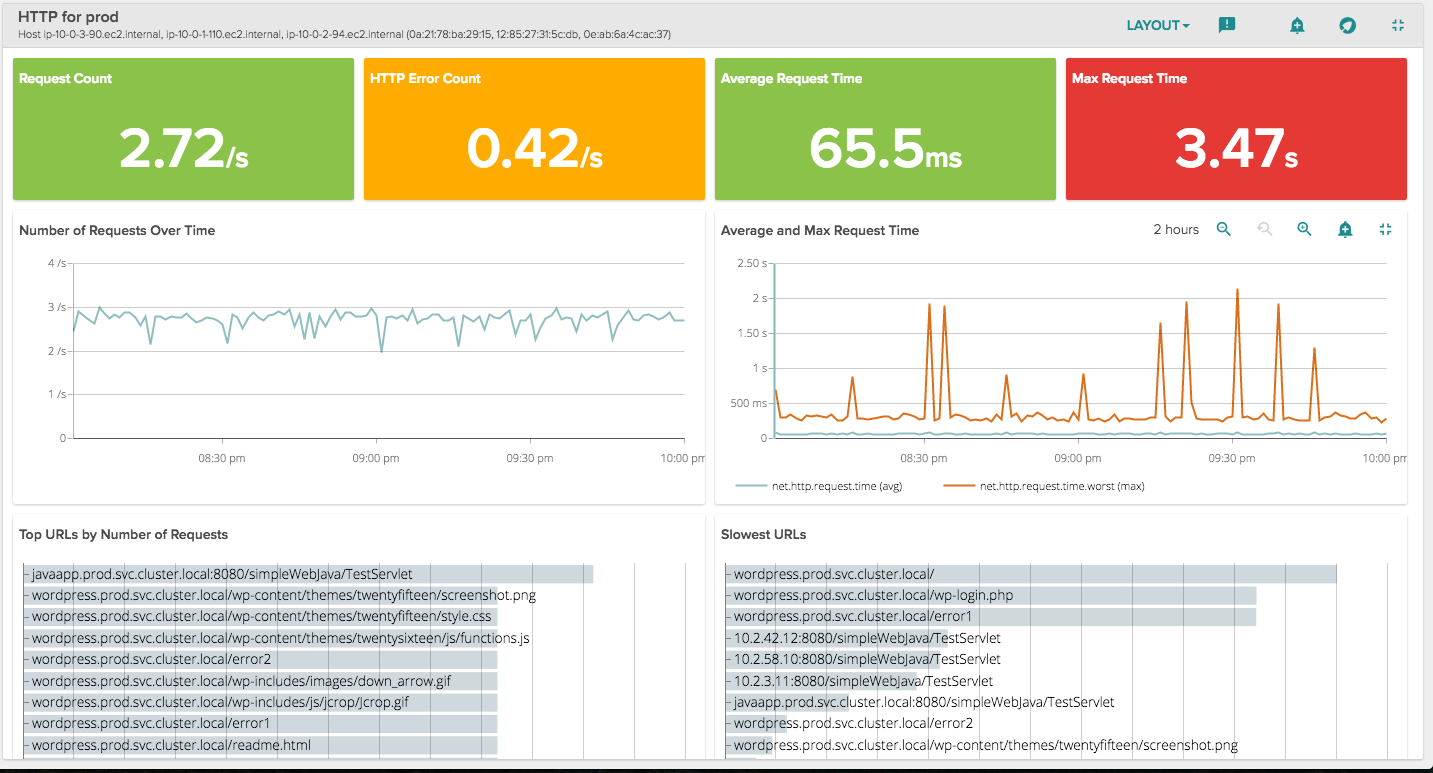
New Service ViewsWe’ve created new views that allow you to assess the health of a service at a glance. Simply select a row in the Explore table, and then search for the service views within the view panel below. Use the
HTTP Overview dashboard to visualize performance metrics and decoded HTTP requests, including top and slowest requests. Either if you use Nginx, Apache, HAproxy or web endpoint in your NodeJS or Java app, we will give you a great out of the box HTTP performance dashboard.
Other pre-built service dashboards views are HTTP Top Requests, Overview by Service, Service Bottlenecks or Service overview. Read more on New Views for Monitoring Microservices.
Compare to nowWe’ve always provided the ability to compare data
in the past to now. But we’ve made it simpler to compare data around an event. Simply go to the Events tab and select an event. Click on Compare to now and see the event in historical context as well as right now, in the same view.
We now support additional Kubernetes metadata for deployments, replicaSets, and daemonSets. Use them just like you would any other tag within Sysdig.
Additionally we’ve further improved our Kubernetes master monitoring and installation through better detection of ports and auto-selection of the correct sysdig agent to monitor with. We recommend that Kubernetes users update their install. Read on how to install Sysdig on Kubernetes or how to monitor Docker and Kubernetes, following WayBlazer advice.
Google Container Engine (GKE) supportUsing Google hosted Kubernetes? In just a few clicks you can get Sysdig agents deployed across your cluster and metrics flowing into your favourite troubleshooting platform. Just sign in with Google single-sign on, authorize Sysdig to get your pertinent info, and choose a GKE project and cluster. And, that’s pretty much it! Read full announcement
Sysdig is now in the DC/OS UniverseDC/OS users are now able to deploy the sysdig-agent container to each slave node by simply providing your Sysdig Monitor API key and other optional information within the DC/OS UI.
WebhooksDoes your DevOps team enjoy automating all the things? Now you can dispatch alerts to generic HTTP callbacks known as Webhooks and handle alerts your own way. Read on
New multi-channel alertingYour alerts are too good for just one Slack channel, or one email address. Now configure fine-grained alerting channels with as many notification endpoints as you like across multiple Slack channels, PagerDuty and VictorOps channels, email addresses, SNS topics, with OpsGenie coming shortly!
Auto-complete in alert scopesWe’ve made creating alerts a bit easier for you by adding auto-complete to alert scopes. After you select a tag and begin typing a value, we’ll use our super powers to give you the options that match. Go ahead and try it by creating a new alert right now!
SysdigBot for SlackDeploy SysdigBot into your Slack channels and start talking to your monitoring system. SysdigBot allows you to add a custom event to Sysdig via Slack, and even can listen on a channel and turn every message into a Sysdig Monitor event! Read more on
We launched Sysdig Tracers, our open source and inexpensive transaction tracing implementation. An APM that works in a similar fashion to Sysdig troubleshooting. Check out a few tracers use case examples.
Sysdig-Camp-Con-World-Fest-Summit, our first-ever community conference, taking place October 26th in San Francisco CA. One day event to rock out on container troubleshooting and Linux performance.Have you tried any of these new features yet? We would love to hear from you on
@sysdig, we love feedback and features request, help us to shape the future of container monitoring and troubleshooting!
Subscribe and get the latest updates
Thank You For Signing Up!
This form failed to load.
An ad blocking extension or strict tracking protection is preventing this form from loading. Please temporarily disable ad blocking or whitelist this site, use less restrictive tracking protection, or enable JavaScript to load this form. If you are unable to complete this form, please email us at [email protected] and a sales rep will contact you.

 Other pre-built service dashboards views are HTTP Top Requests, Overview by Service, Service Bottlenecks or Service overview. Read more on New Views for Monitoring Microservices.