


Falco Feeds extends the power of Falco by giving open source-focused companies access to expert-written rules that are continuously updated as new threats are discovered.

It's no secret that more and more teams nowadays live on Slack. Discussions, internal and external events, application notifications are examples of the many things that end up in Slack to help teams be more efficient.
\r\r
Our company is no exception: Slack is a central part of our workflow. As a consequence, it's natural for us to think that our products should be deeply integrated with this workflow. After all, a monitoring application like Sysdig Cloud is the window into your own applications and infrastructure and, as such, it can be far more effective if it is aware of what's happening in the rest of your organization.
\r\r
To put our money where our mouth is, we have recently taken a couple of steps. Step one was the integration of the Sysdig Cloud alerting system with Slack, now you can receive Sysdig Cloud notifications in an arbitrary Slack channel. That's pretty common these days.
\r\r
Step two is what I'm going to showcase in this blog post. It's is called SysdigBot and it gives you the ability to route your entire universe of relevant events directly from Slack to Sysdig Cloud.
\r\r
A Bit of Background: Correlating Events and Monitoring Metrics
\r\r
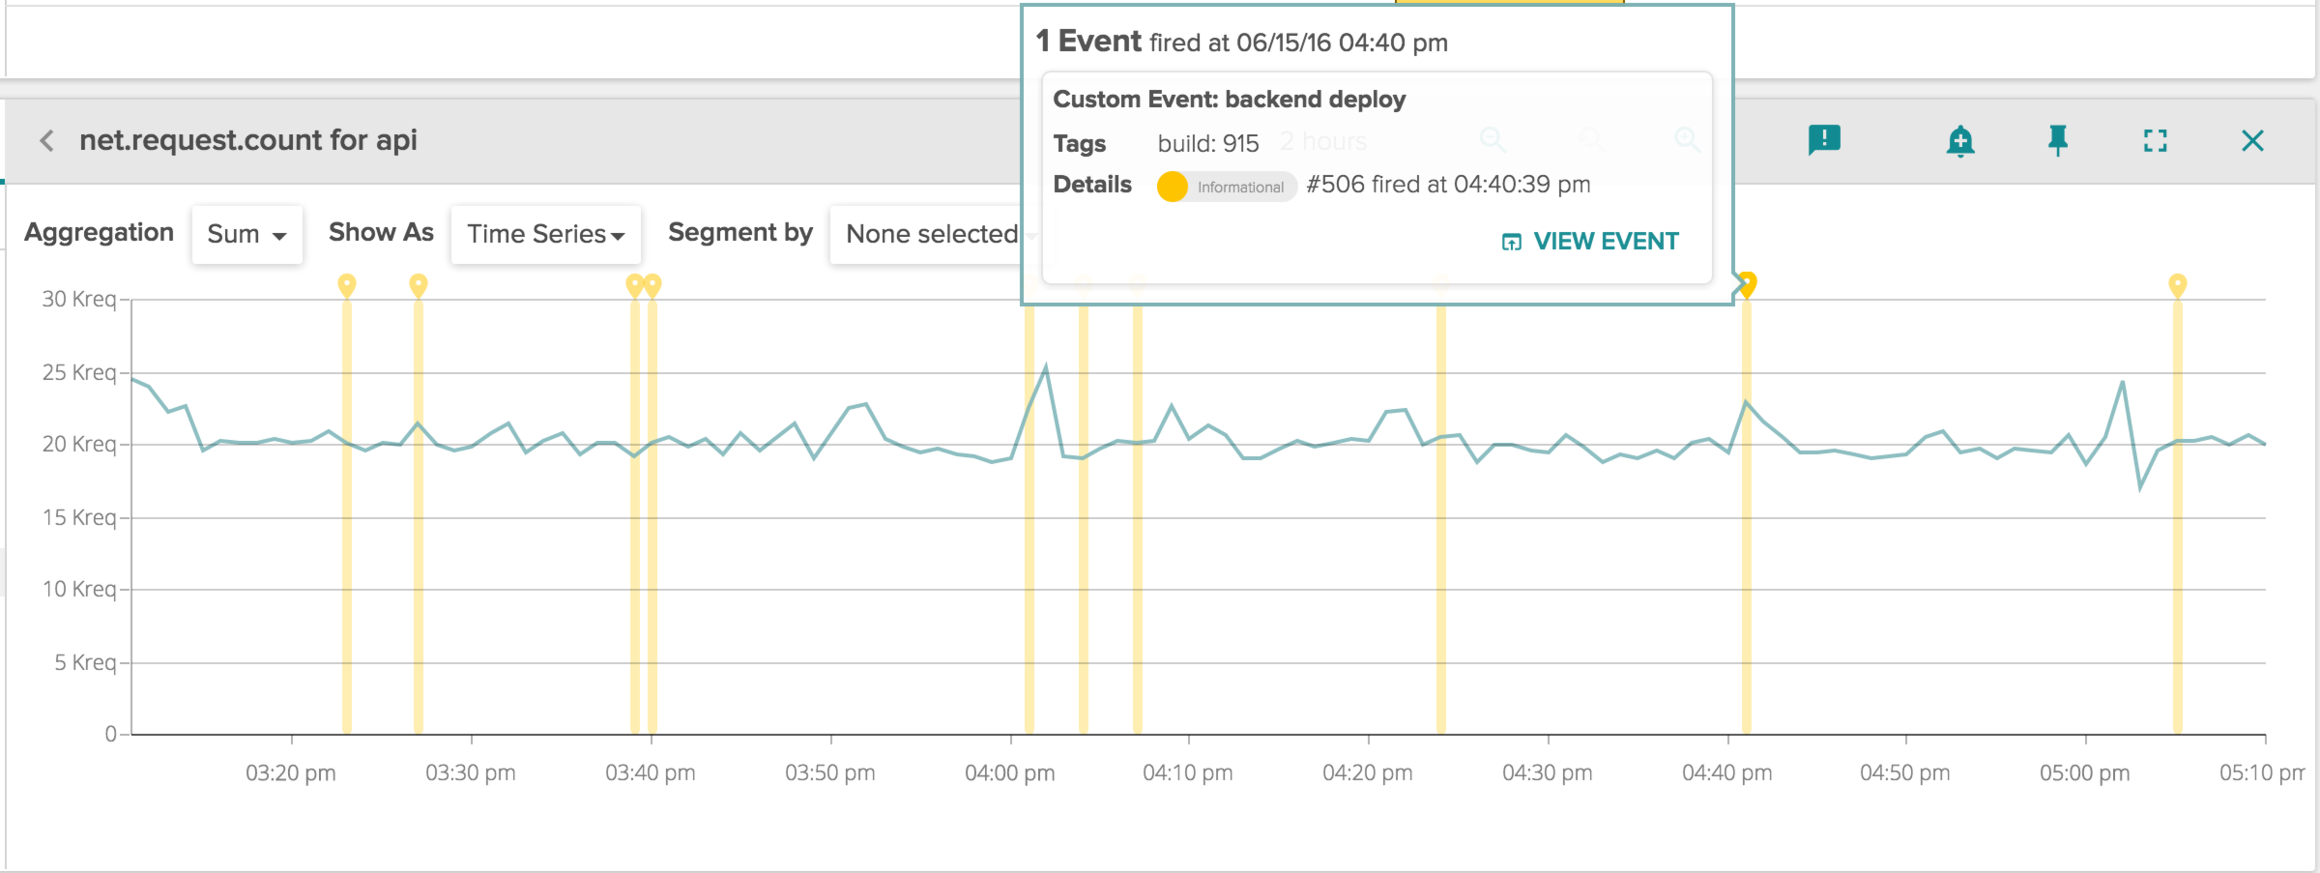
In addition to collecting a lot of metrics from containers, virtual machines, physical hosts, and the applications that run on top of them, Sysdig Cloud is also able to collect events. An event is any piece of contextual information that better helps you understand why your monitoring metrics are what they are. Events can come from almost any source – for example github or jenkins, kubernetes or docker, a log file, or even a manual input from a user. They can be searched, overlaid to charts or correlated to metrics. This picture shows an example of events overlay. (Soon we'll also allow you to alert off these events as well.)
\r\r
\r\r
Our monitoring agent collects some of these events automatically, for example when a Docker container is killed or when a Kubernetes pod is restarted. We also let you post arbitrary events using our API, so you can mark deployments, software releases, business events, days with too much coffee consumption, and so on.
\r\r
One of the cool things you can do with Sysdig Cloud is exploring an event, which means "rewinding" your infrastructure to explore your topology and your metrics around the time when the event happened.
\r\r
\r\r
Capturing your Slack Universe with SysdigBot
\r\r
SysdigBot lets you send events to Sysdig Cloud from Slack, using natural language as well simply by listening to anything happening in a channel.
\r\r
Let's install it first, and then show you a couple different things you can do with it. Click here just to skip past the install and see what SysdigBot actually does.
\r\r
SysdigBot is a python script and can be easily installed with PIP. For even greater simplicity, we also offer a containerized version that I'm going to use here. You can deploy it with this command line:
\r\rdocker run -d --name sysdig-bot -e SYSDIG_API_TOKEN=(sysdig_token) -e SLACK_TOKEN=(slack_token) sysdig/sysdig-bot\r\r
In order to run it, you will need two tokens: Slack and Sysdig Cloud.
\r\r
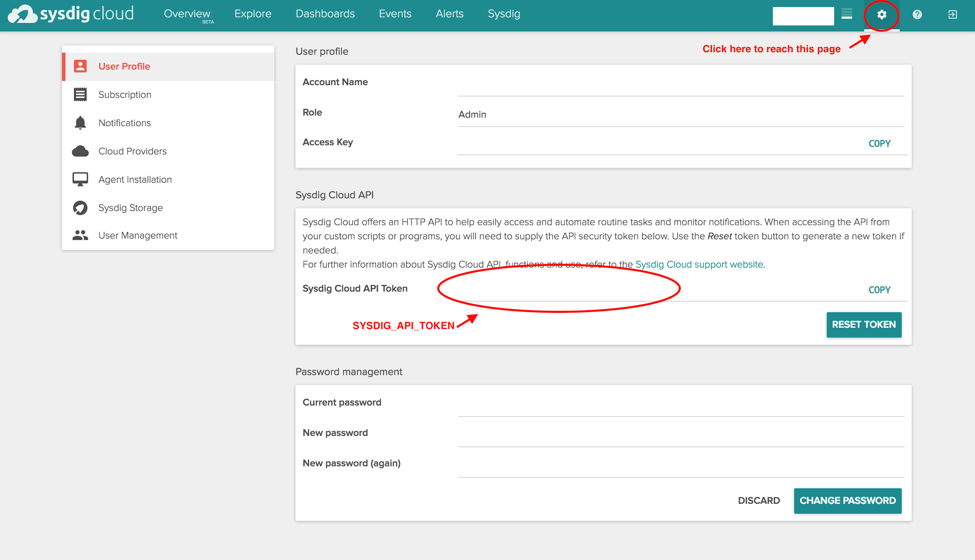
For the Sysdig Cloud token, just login on to Sysdig Cloud with your credentials and go to the setting page. The token you need is the one highlighted in the following image:
\r\r
\r\r
For Slack, after logging in to your slack team, open this url: https://my.slack.com/services/new/bot. It should lead you to this web page:
\r\r
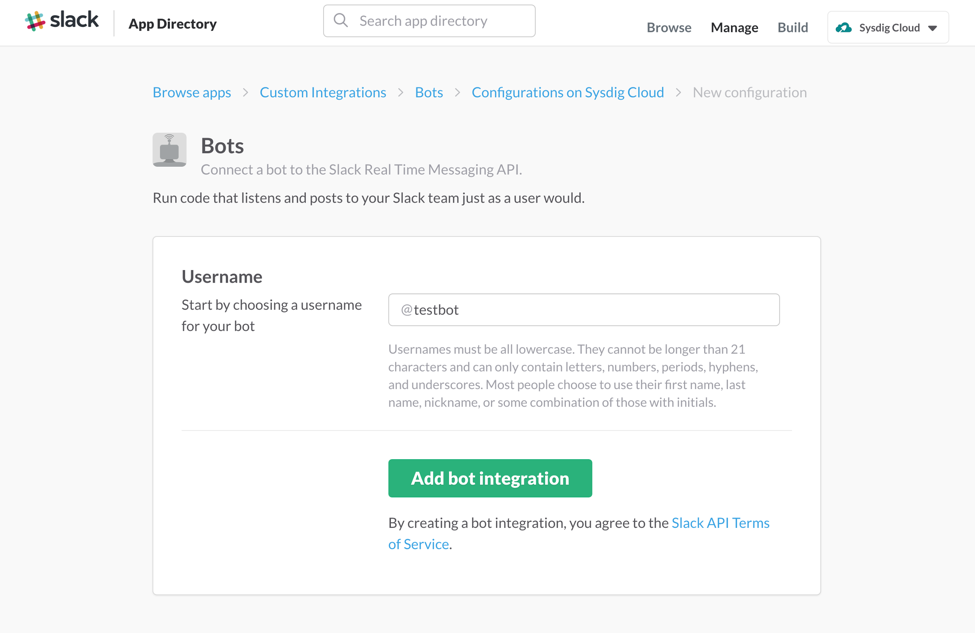
\r\r
Type a name for your bot (we suggest @Sysdigbot) and add it. The bot will be created, as well as the token needed to use Slack APIs. It's the one highlighted in the image below:
\r\r
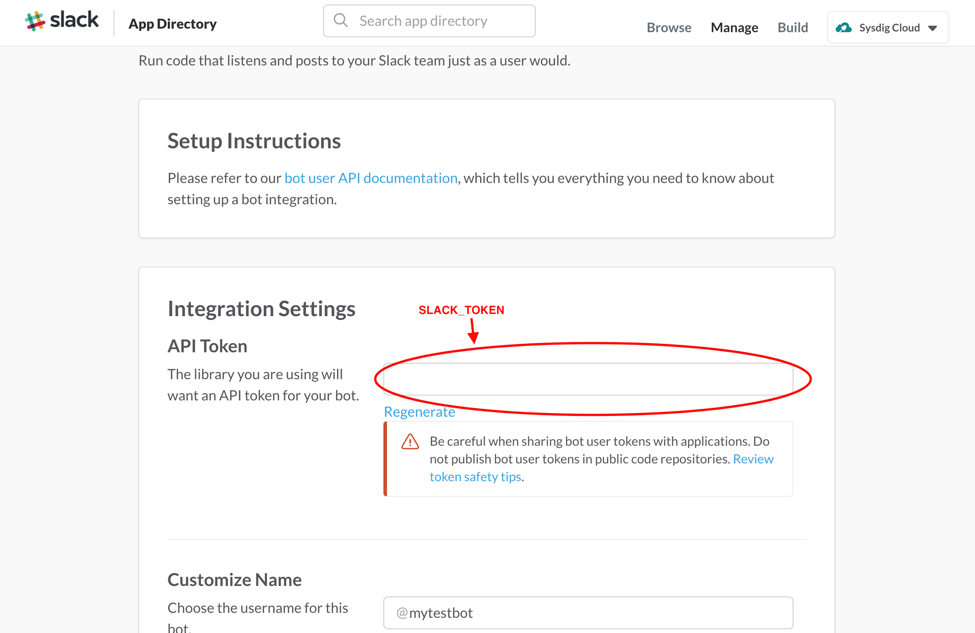
\r\r
And that's all you need. Now let's take a look at a couple of useful things you can do when Slack and Sysdig Cloud are linked.
\r\r
\r\r
Talk to Your Monitoring System
\r\r
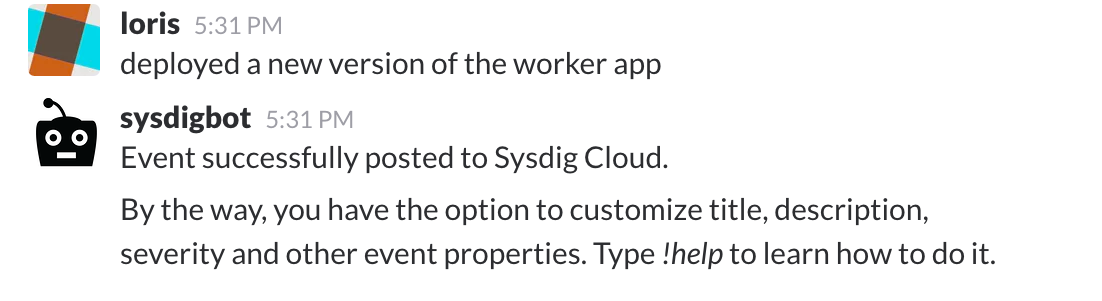
The simplest thing you can do with SysdigBot is chat with it!
\r\r
\r\r
After few seconds, the message appears in the Sysdig Cloud events list, properly categorized and ready to be searched and correlated with any metric. Nothing easier.
\r\r
\r\r
Routing Your IT Universe Into Your Monitoring System
\r\r
Things get much more interesting when you add SysdigBot to a channel.
\r\r
Ideally, you want your monitoring system to ingest events from any of your IT tools. Source code commits, code deploys, bug reports, tickets, business events, security alerts. All of these inputs, and more, can be important when monitoring your performance or hunting the root cause of an outage.
\r\r
Many monitoring tools offer integrations to collect some of these signals. As I can tell you from first hand experience, no monitoring tool has the resources to integrate with everything you need, especially because some of the integrations are specific to your own infrastructure and the code you've written.
\r\r
You could wait for your provider to write them for you, or you could write each integration yourself. However, nowadays every signal that is relevant already goes to a slack channel, so why not leverage that?
\r\r
Easy! Just invite SysdigBot to a Slack channel: it will listen to messages sent on the channel and "route" them to Sysdig Cloud. You can see this as universal event integration: if you can send something to Slack, you will also be able to seamlessly use it for investigation and correlation in your monitoring system. How cool is that?
\r\r
Let me give you a real world example.
\r\r
Leveraging SysdigBot to Handle Support Tickets Like a Pro
\r\r
Our cloud service now monitors tens of thousands of containers, so as you can imagine the health of our cloud backend is of primary importance. Support tickets involving its stability or performance need to be investigated immediately, with as much detail as possible. Here's an example of how we do it.
\r\r
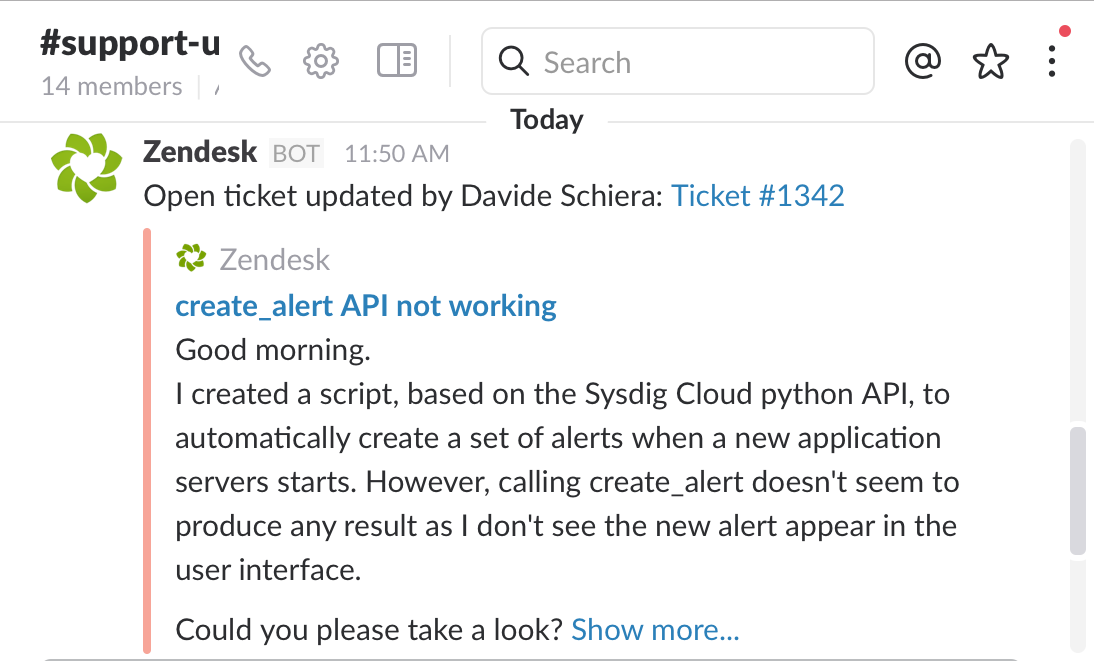
1) We use Zendesk as our customer support platform and, of course, we integrate it with Slack. Events go to a channel called support-updates. Here is a user reporting an issue with creating alerts using our python API:
\r\r
\r\r
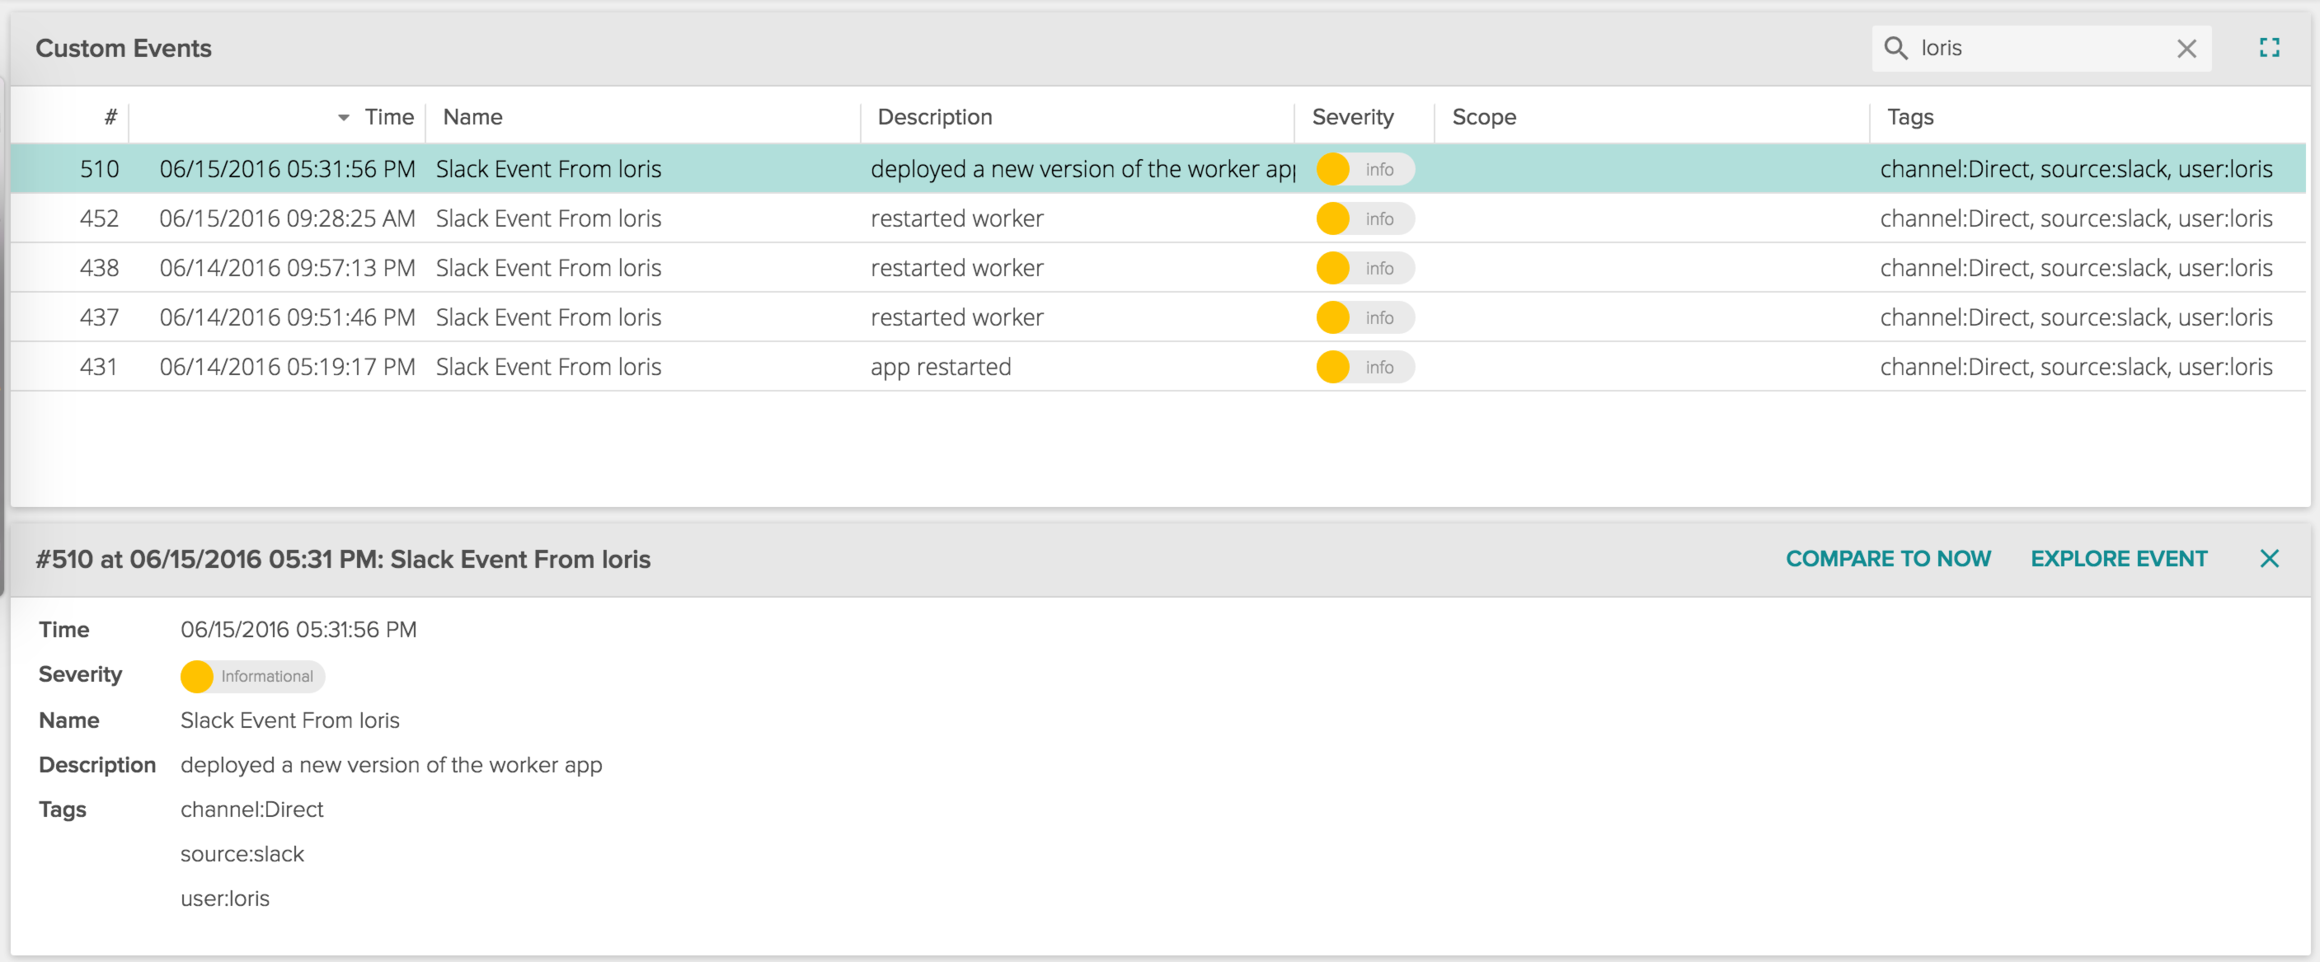
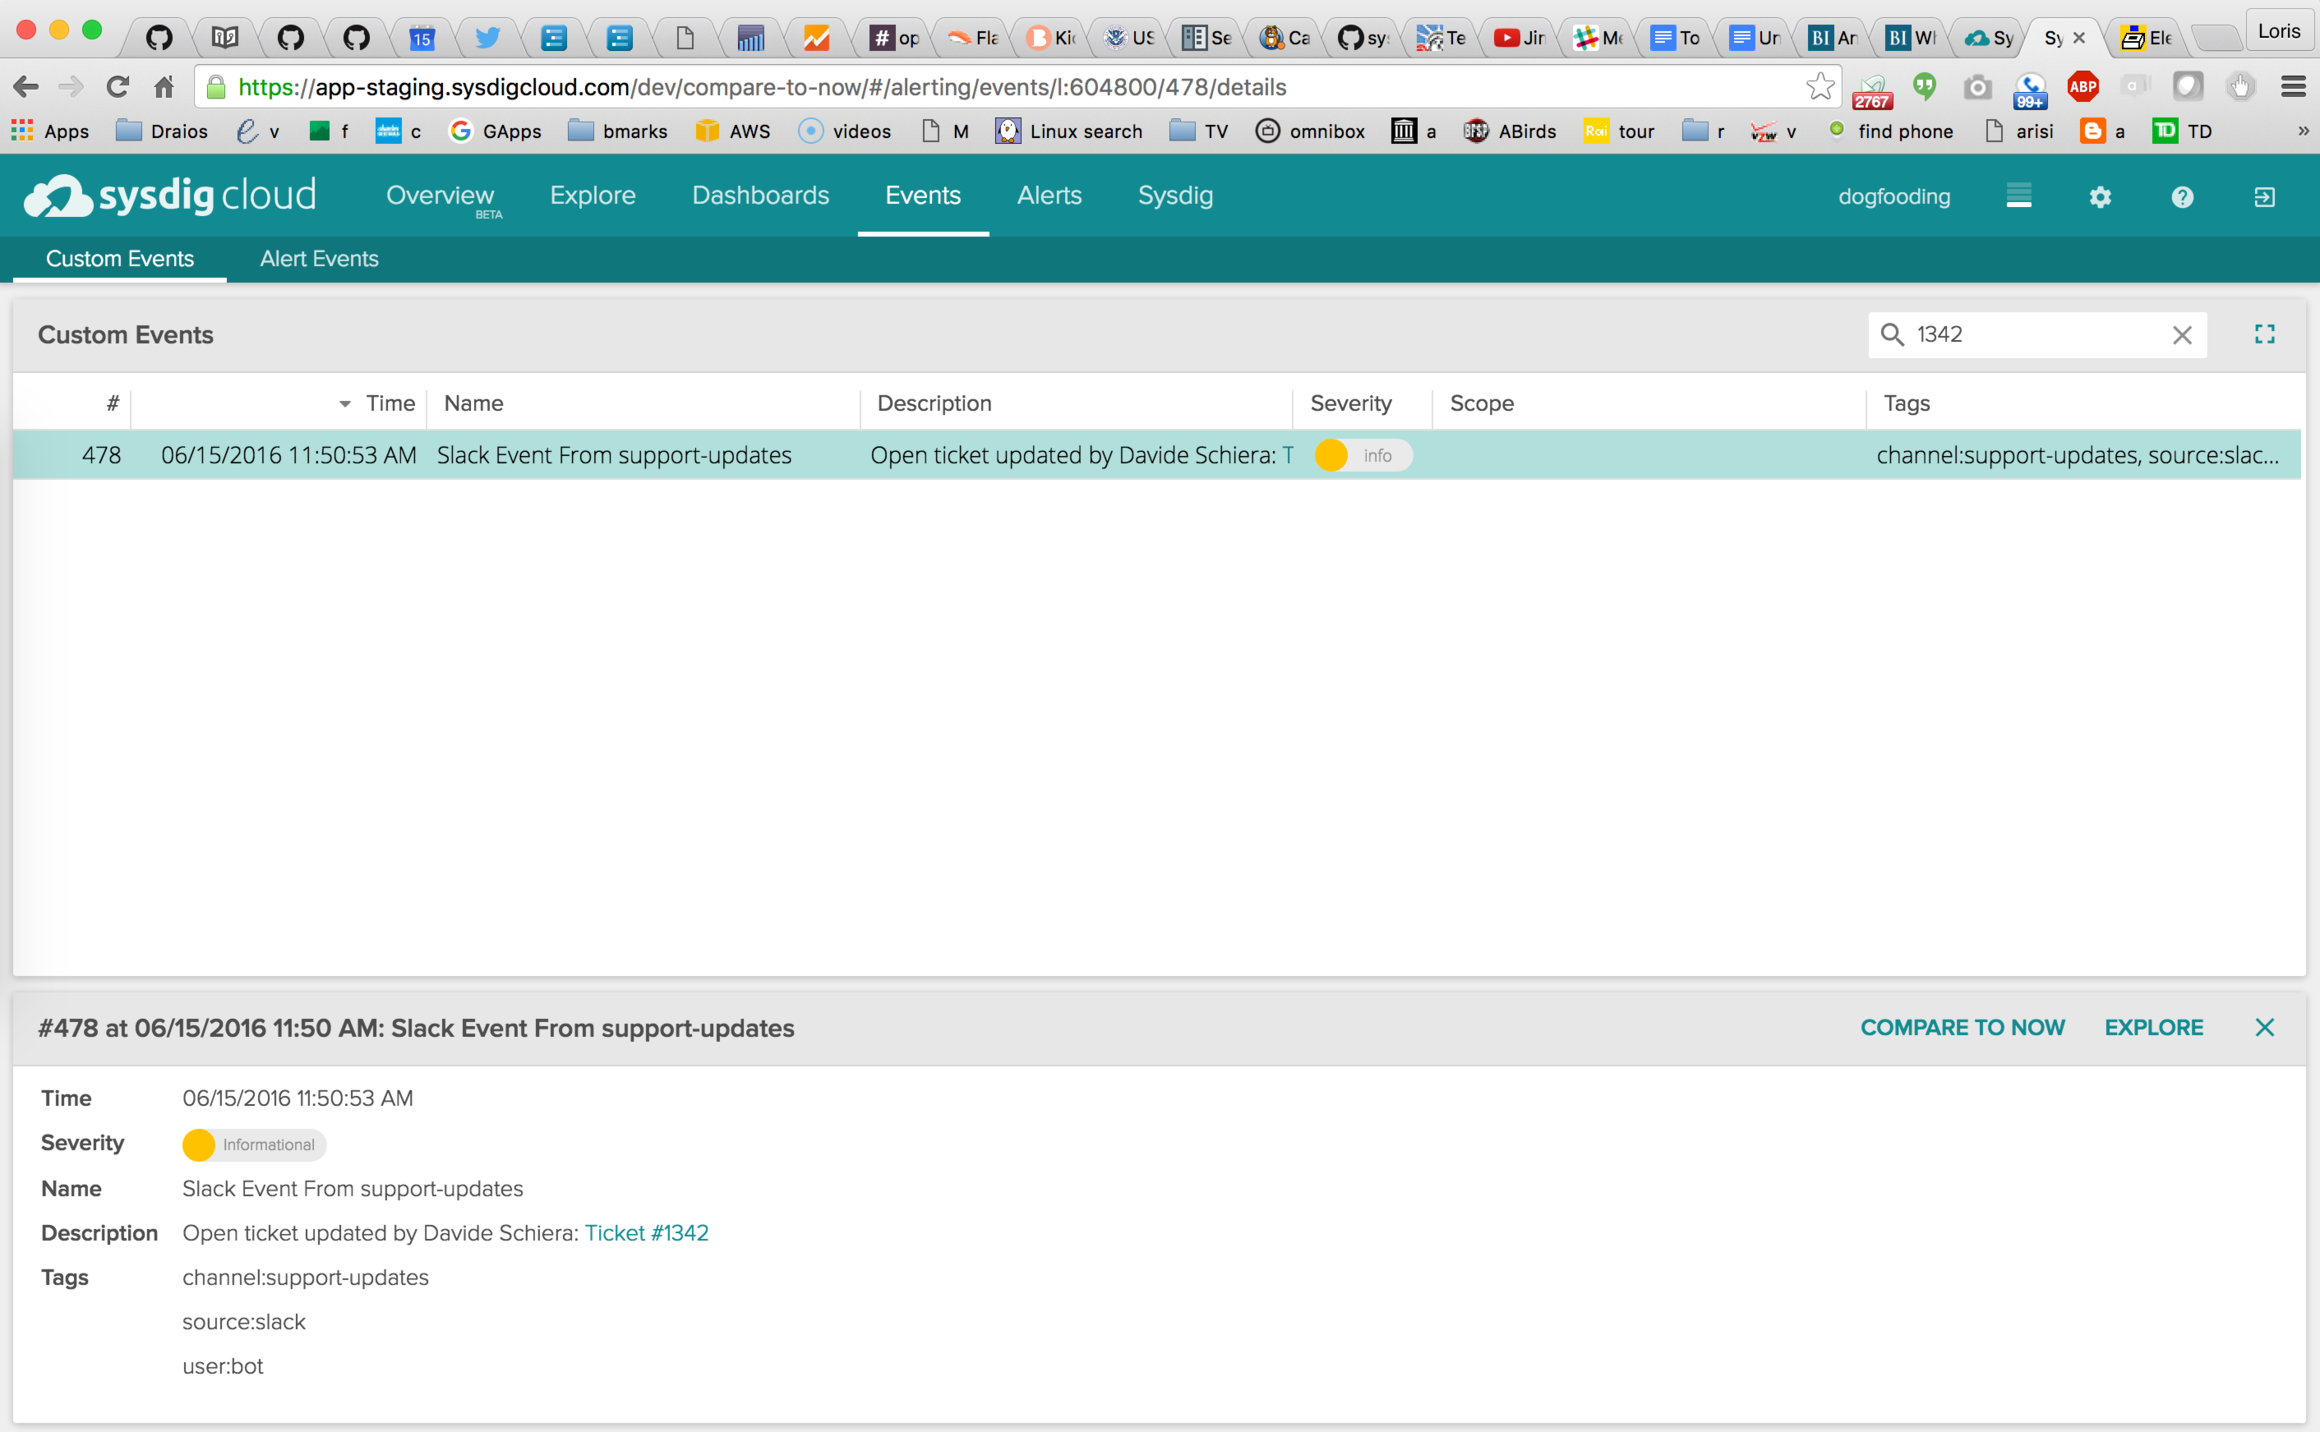
2) SysdigBot listens on that Slack channel, so this event is immediately posted to Sysdig Cloud, where I can easily locate it in the Events tab, filtering by ticket number.
\r\r
\r\r
Note how we can see the ticket details at the bottom of the page. Also, note how Sysdig Cloud understands the Slack link syntax, making the ticket number link directly to the original Zendesk page if required.
\r\r
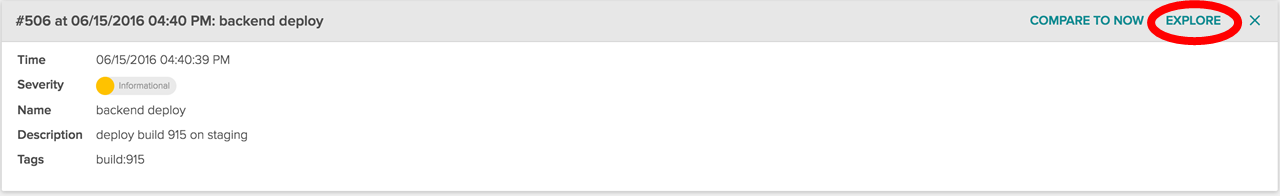
3) Once I select the event, I have two buttons: EXPLORE, to navigate in my infrastructure around the time when the incident was reported and COMPARE TO NOW, to analyze the differences between the time when the issue was reported and now.
\r\r
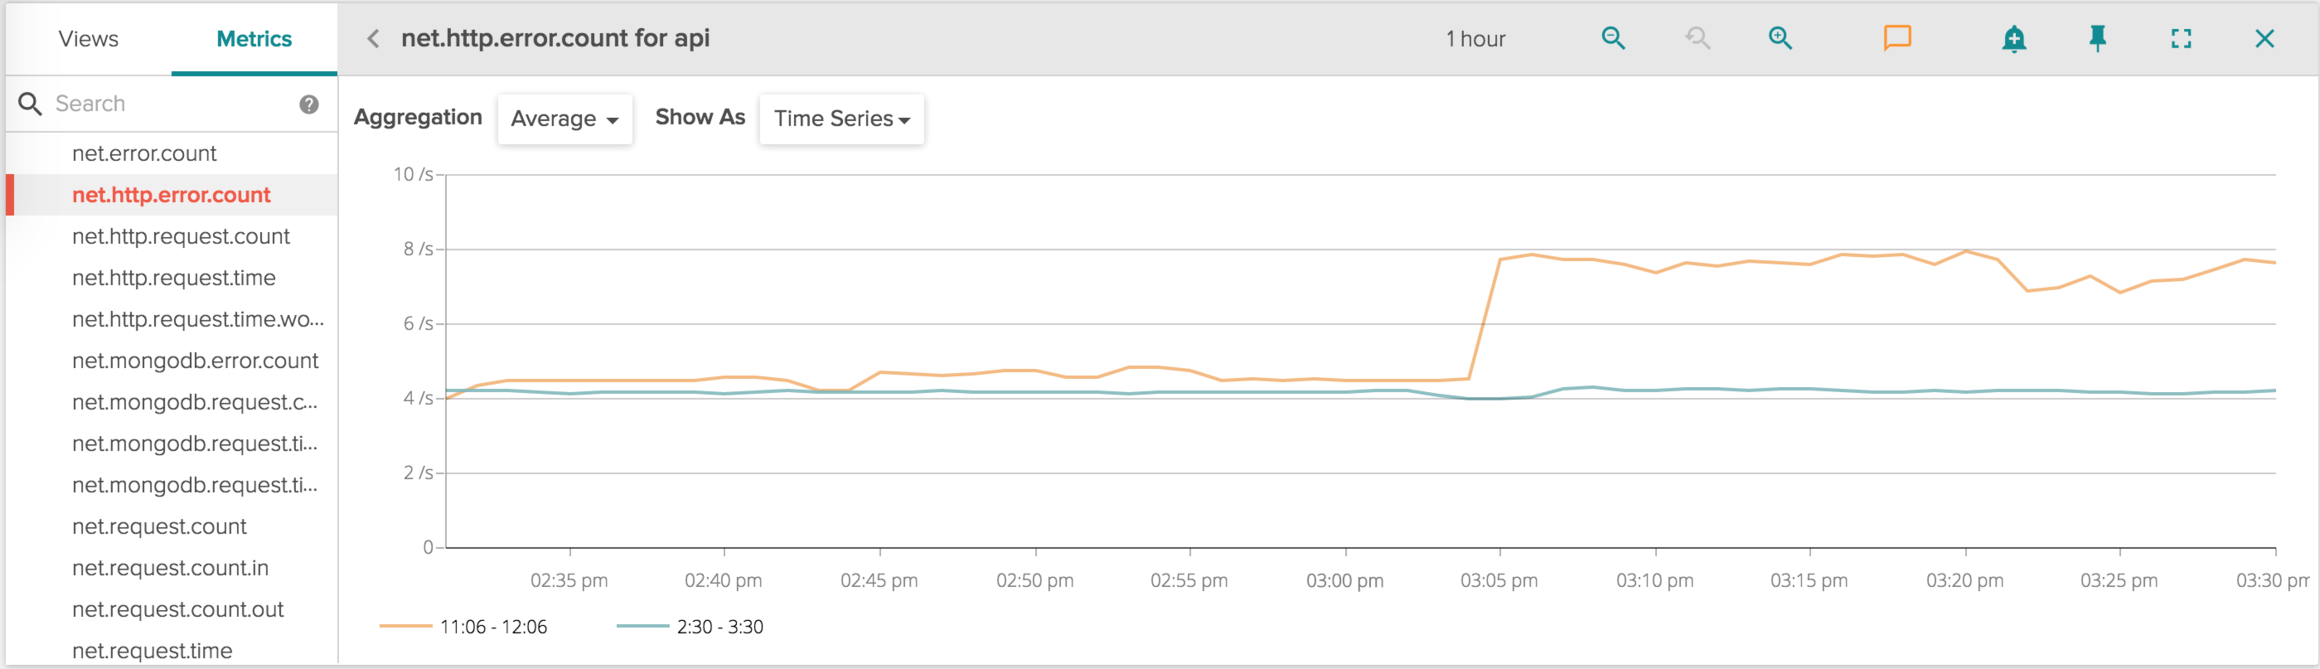
This time I'm clicking COMPARE, then I display the HTTP errors for the the API frontend service (this is one of the many metrics that Sysdig Cloud exports out of the box, with no instrumentation required):
\r\r
\r\r
The Blue line in the chart is the last hour, while the orange line is the hour interval around when the ticket was created.
\r\r
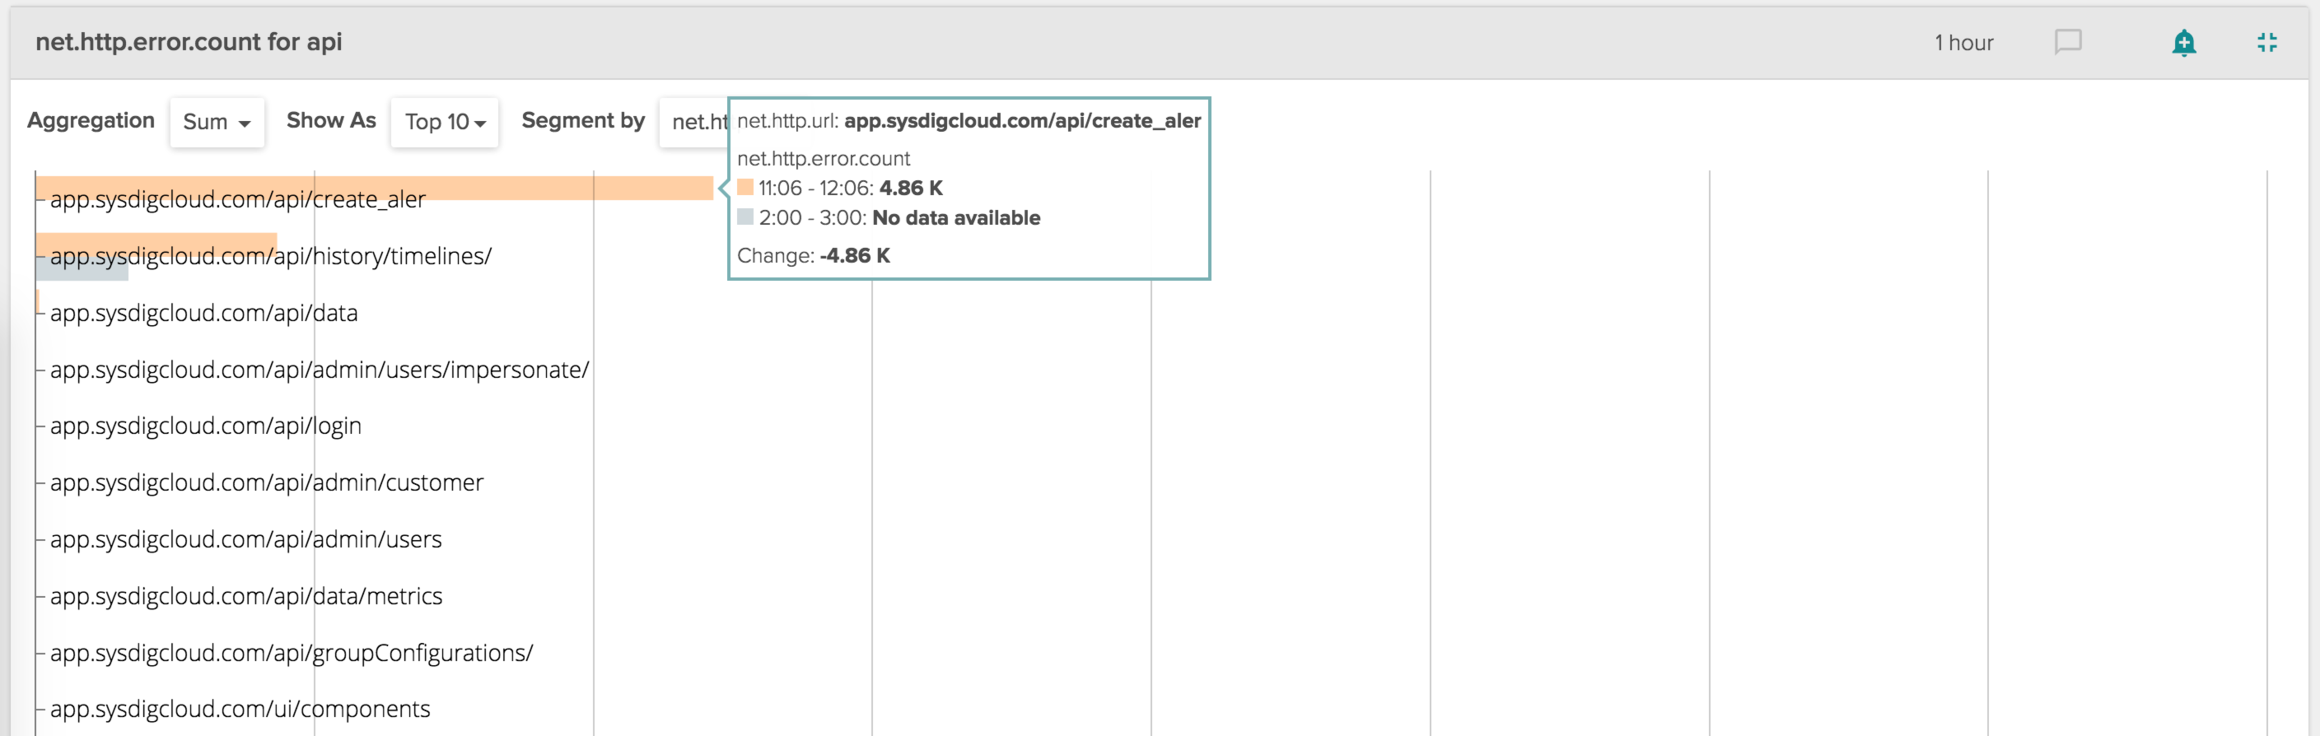
The orange line increase is definitely suspect. What's causing it? While staying in compare mode, let's segment this data by URL (again, this is all data that you get out of the box when you use Sysdig Cloud), and let's show it as a Top 10 chart.
\r\r
\r\r
You can clearly see how the majority of the delta in the HTTP errors can be attributed to api/create_aler, which is a misspelling of the correct endpoint, api/create_alert!
\r\r
Time to tell the user to fix his spelling, close the ticket and pat myself on the back. :-)
\r\r
Designed for Customization
\r\r
One thing that we recognized early on when working on SysdigBot is that this is the kind of tool that really benefits from the ability to be customized. You will likely want to filter what it listens to, add options, change the sentences it uses and in a general way tune it for your environment.
\r\r
This is why we decided to implement this as an independent module, written in python, and to release its source code. It's simple enough that you should be able to customize it without too much effort. It's all yours on github.
\r\r
Conclusions
\r\r
If you use Slack, you won't have to worry any more about which event integration Sysdig Cloud supports, because with Sysdigbot we support anything.
\r\r
Also, this is the very beginning. Expect more interesting ways to leverage slack in conjunction with Sysdig Cloud to come soon.
\r\r
If you want to try this by yourself, we offer a free 14 day trial, which you can start from here.