


Falco Feeds extends the power of Falco by giving open source-focused companies access to expert-written rules that are continuously updated as new threats are discovered.

In this article, we will explain how to monitor Amazon SQS with Prometheus. To monitor Amazon SQS, we will leverage the data offered by CloudWatch exporting the metrics to Prometheus using the YACE exporter (Yet Another CloudWatch Exporter). Finally, we will dive into what to monitor and what to alert.
Amazon SQS (Simple Queue Service) has gained popularity as a way to communicate and decouple asynchronous applications, specifically for its easy integration with AWS Lambda functions.
Having two decoupled applications allows you to implement and scale independently both extremes. To achieve this decoupling, the system must be prepared for producing and processing the messages between applications at a different rate. Any bottleneck can cause messages to not be processed on time, and hurt the overall performance of the system.
You need to monitor Amazon SQS queues closely to find bottleneck situations, properly scale the producers and consumers of messages, and detect errors as soon as possible.
But how do you monitor a managed service like this one?
And can you monitor it from the same place you monitor your entire infrastructure?
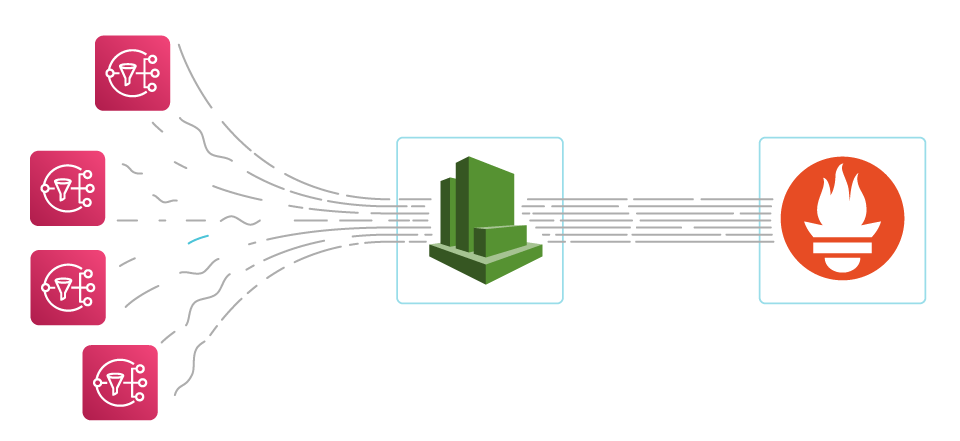
The relevant metrics for this service are all available in AWS CloudWatch. You can consult them via the web interface or through the API. To check these metrics from your Prometheus-compatible monitoring solution, you can use a Prometheus exporter.
Let's now dig into how SQS works in detail, how to monitor it with Prometheus, and what key metrics you should keep an eye on.
"📊 It is possible to monitor #AWS #SQS next to your cloud-native infrastructure. 💻 🤓 Learn how to leverage #Prometheus to extract #CloudWatch metrics 📈"
How do Amazon SQS queues work?
Let's settle a common ground on how Amazon SQS queues work, making it easier to later identify what's important to monitor and alert on.
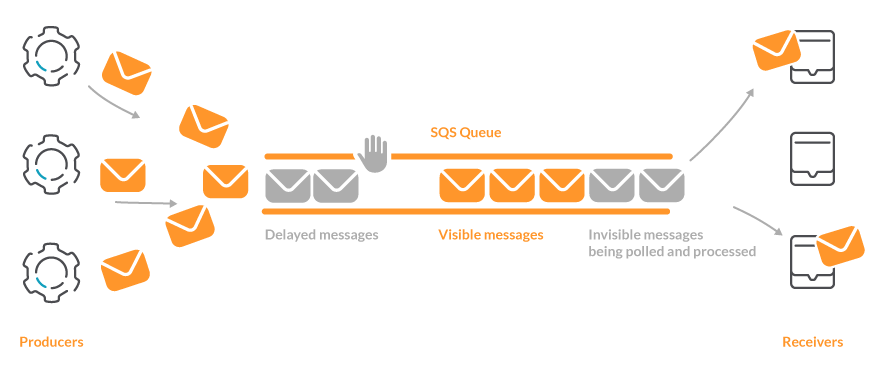
Here is the workflow of a message in a SQS queue:
- The message is created by a producer service and sent to the SQS queue.
- The message appears in the queue for all of the possible receivers as visible. This step can be non-immediate. For example, if you configure a 'delay' in the message, it will stay in the queue in a delayed state and will not be available for the receivers until the delay expires.
- One of the possible receivers makes a
pollingof the messages of the SQS queue. This operation retrieves the visible messages from the queue and switches them to aninvisiblestate, but does not delete them. This keeps other receivers from getting those messages if they execute a new polling. - When the receiver ends to process the message, explicitly removes it from the queue.
Now, what happens if a receiver ends the processing of a message and does not remove it from the queue?
After a configurable delay, the message is marked again as visible so other receivers can get the message and process it.
Wow, that sounds interesting. If you get a message that generates an error in the receiver, shortly after, another receiver will get that message and process it again.
And what if that other receiver also suffers an error? And all of the others after that?
That's a tricky question.
To prevent these old messages from populating the queue and recurrently appearing in the polls, Amazon SQS allows you to configure another queue as a dead-letter. A dead-letter queue is where the messages end after being polled a number of times. This helps developers and site operation engineers detect these messages and treat them in an appropriate way.
Monitor Amazon SQS with Prometheus metrics
Now that we understand how SQS queues work, let's see how we can get metrics to address all of the possible situations that we can find while working with them.
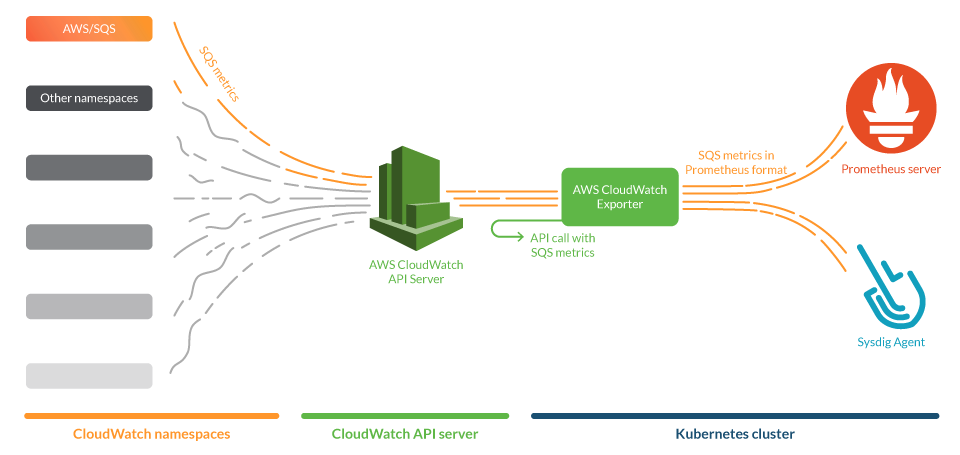
Amazon SQS emits certain metrics that can be gathered by the CloudWatch service under the namespace AWS/SQS. We'll now see how to extract those metrics to be able to monitor Amazon SQS with Prometheus.
Prometheus is a leading open source monitoring solution, which provides means to easily create integrations by writing exporters. With Prometheus, you can gather metrics from your whole infrastructure which may be spread across multiple cloud providers, following a single-pane-of-glass approach.
Prometheus exporters gather metrics from services and publish them in a standardized format that both a Prometheus server and the Sysdig Agent can scrape natively. We will use one of these exporters, specifically the YACE exporter (Yet Another CloudWatch Exporter), to get metrics from AWS CloudWatch. We contributed to this exporter to make it more efficient and reliable.
In this use case, we will:
- Deploy the CloudWatch exporter in a Kubernetes cluster.
- Configure it to gather metrics of SQS in AWS.
This exporter will be conveniently annotated with Prometheus tags, so both a Prometheus server and the Sysdig agent can scrape it.
Installing and configuring Prometheus CloudWatch exporter
Setting up permissions to access CloudWatch metrics
The exporter will connect to the AWS CloudWatch API and pull the metrics, but to get them we need to grant the right permissions.
First, you will need to create an AWS IAM policy that contains the following permissions:
Configuring the AWS IAM policy
You will also need to supply the credentials for an AWS IAM account to the CloudWatch exporter. This can be done in a standard manner, in the $HOME/.aws/credentials file.
Configuring the AWS IAM account in the $HOME/.aws/credentials file.
You can either assign the IAM policy directly to the IAM account or to a IAM role to grant the permissions to the exporter.
Configuring the exporter
The YACE exporter has images for its stable version ready to be deployed in Kubernetes. So, we just need to:
- Specify what to scrape from CloudWatch in a
config.ymlfile. - Create a deployment file.
- Deploy in a Kubernetes cluster.
Let's focus on the configuration file. Here, you'll define:
- Which metrics the exporter will scrape.
- From which region.
- What dimensions you'll ask CloudWatch to make the aggregations with.
Here is an example config.yml configuration file:
Please be aware of the following caveats:
- If you wish to add an additional metric, be sure to read up on Amazon SQS metrics to use the correct statistic.
- CloudWatch offers aggregations by different dimensions. The YACE Exporter automatically selects
FunctionNameas the default dimension to aggregate the metrics by. - Gathering CloudWatch metrics may incur a certain cost to the AWS bill. Be sure to check the AWS Documentation on CloudWatch Service Quota limits.
The last step is to actually deploy the YACE exporter. To make things easier, you can put the IAM account credentials and the configuration in a file, like this:
Note that leaving your AWS credentials inside a deployment file is not the safest option. You should use a secrets store instead, but the example was simplified to keep the focus.
In this file, we can find:
namespace: yace- The
kind: Deploymentwith the exporter. Note theannotations:with the Prometheus tags for scraping, and the scraping port. This deployment also has two volumes: one with the configuration file, and another with the credentials. kind: ConfigMapwith the contents of the config.yml file.kind: Secretwith the credentials of the IAM account.
Now, you just need to deploy like you usually do:
Is it working?
Let's do a quick test throwing an HTTP request to the exporter port. To do it, you can use a web browser or curl in a console. As we set the port 5000 in our example pod yace-sqs, we would do:
If everything is OK, you should see a web page with metrics of this kind (output truncated due to size):
Monitoring AAmazonS SQS: What to look for?
Amazon SQS queues have a simple design, so there isn't much to monitor. However, depending on how you are using them, you will want to monitor a different set of metrics.
Let's explore some scenarios and their relevant metrics.
Simple producer-consumer
For this approach, we will consider that you only have producers and consumers processing the messages. We will not cover delayed messages or dead-letter queues.
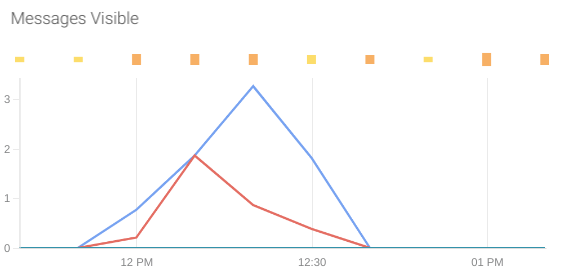
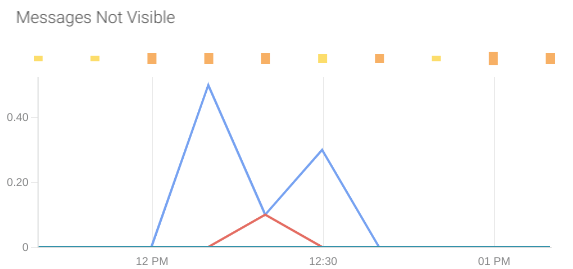
Visible messages: This metric will give you information about the saturation of the system.
Visible messages are the ones that are ready to process, but not yet polled and deleted by a receiver. It would be a good indicator of how many pending messages you have in the queue.
The metric that offers this information is aws_sqs_approximate_number_of_messages_visible_average.
Not visible messages: This metric is a good indicator of the messages that are being processed at each moment.
Not visible messages are the ones that have been polled by a receiver but were still not deleted.
The metric that offers this information is aws_sqs_approximate_number_of_messages_not_visible_average.
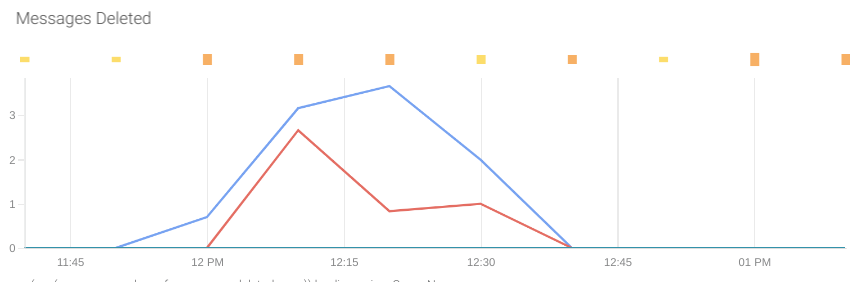
Deleted messages: This metric is a good indicator of the number of messages actually processed by the receivers.
Remember, when a receiver processes a message, it manually deletes the message from the queue.
The metric that gives this information is aws_sqs_number_of_messages_deleted_sum.
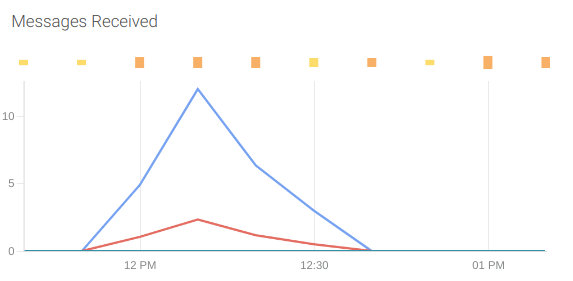
Received messages: The received messages are the number of messages that went out of the queue. Take into account that a message can be received by a consumer several times if the message was not deleted from the queue.
The metrics that give this information is aws_sqs_number_of_messages_received_sum.
Empty receives: This metric allows you to detect how many empty requests have been made in order to optimize the way your application makes the requests.
Amazon bills SQS based on the number of requests made. A polling is a request, and in each one you can retrieve 1-to-10 messages for a maximum total payload of up to 256 KB.
The metric that gives this information is aws_sqs_number_of_empty_receives_sum.
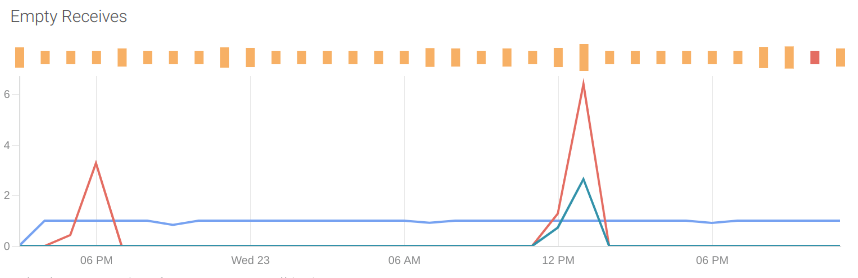
To optimize the billing, you can either reduce the request frequency or use long polling. This feature allows you to receive, for 10 seconds, the visible messages. Plus all of the messages that arrive in real time, reducing the number of requests.
Monitoring a producer that can delay messages
If you can estimate the time needed to process the messages, the producer can add a delay to the messages. Leaving time between messages can help alleviate possible bottlenecks caused by a high number of messages sent at the same time.
Some extra metrics worth tracking in this scenario are:
Delayed messages: This indicator can help you scale up or down the number of receivers to adequate the load of work coming in the next minutes.
You can have the number of messages delayed in the queue with the metric aws_sqs_approximate_number_of_messages_delayed_average.
If your producers are deployed in Kubernetes, you can use the Kubernetes horizontal pod autoscaler (HPA) and the Prometheus Adapter to adjust the number of pods depending on the value of this metric.
Total number of messages in the queue: The number of messages gives you an idea of the occupation and saturation of the pipeline.
To have an estimate of the number of messages that the senders produced and that are still waiting to be processed, you can sum the delayed messages, visible (ready to send to receivers) and not visible (currently being processed). If the processing of messages were immediate, this result would be zero.
The promQL that produces this value is:
Dealing with dead-letter queues
While dealing with dead-letter queues, it is important to monitor when a message arrives to the queue.
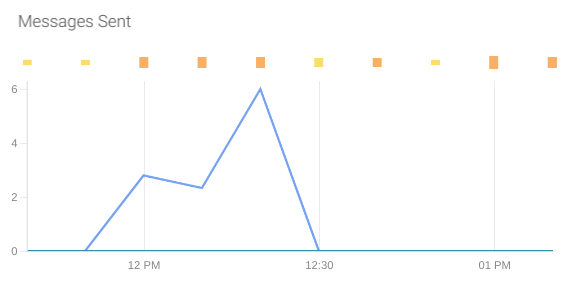
Sent messages: This can give an idea of the errors or messages that could not be processed by the receivers.
The metric that gives this information is aws_sqs_number_of_messages_sent_sum.
Monitoring Amazon SQS: What to alert?
High number of messages in queue for a long time: The total number of messages in the queue is an indicator of the saturation of the pipeline. You can set a limit (e.g., 100 messages) and receive an alarm if the number of messages is higher than that for an extended period of time.
This alert can also detect messages that are recurrently sent back to the visible state if a dead-letter queue is not configured.
Oldest message in queue: This metric gives an idea of the age of the oldest message of the queue, which is a good indicator of the maximum latency of the pipeline. This alert will trigger when the maximum age is higher than five minutes (300 seconds, you can adjust as you wish).
For this alert to work properly, you have to be sure to configure a dead-letter queue to prevent messages from recurrently being sent to visible state.
Recurring empty receives: You can detect when your application is recurrently trying to fetch new messages from an empty queue. This can help you adjust your polling frequency or the number of receivers to lower the costs of your infrastructure.
Received message in a dead-letter queue: You can detect if a new message has arrived to a dead-letter queue by alerting on the sent message metric. To filter on the dead-letter queues, you can follow different methods. For example, naming your dead-letter queues with a prefix, like dead-letter-.
This promQL will alert you when a message arrives to any of your dead-letter queues:
Getting the CloudWatch metrics into Sysdig Monitor
Sysdig agent setup
To scrape metrics using the Sysdig agent:
In the yace Deployment, remember to include the Prometheus annotations that configure the port of the exporter as a scraping port.
Also, in the Sysdig Agent configuration, make sure to have these lines of configuration that enable the scraping of containers with Prometheus annotations.
Monitoring Amazon SQS with dashboard and alerts
Once we have SQS metrics in Sysdig Monitor, you can use the Amazon SQS dashboard to have a full overview of your queues. In the dashboard, you can filter by cluster and select as many SQS queues as needed. This is especially useful when you need to correlate an SQS queue with its dead-letter queue.
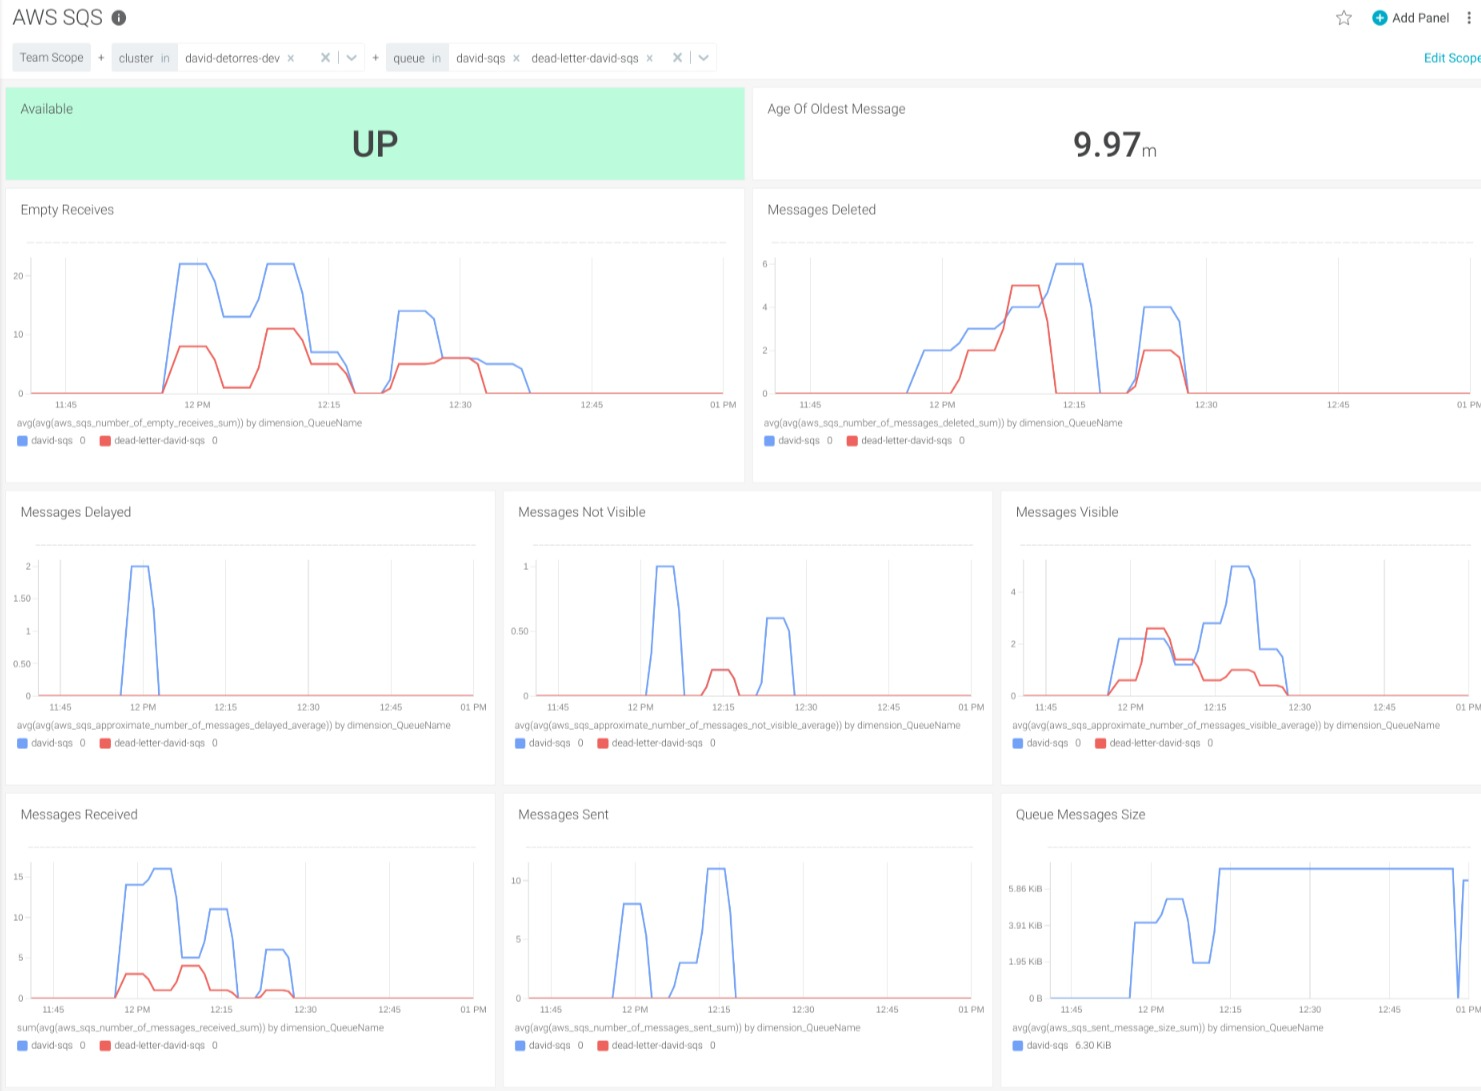
Sysdig Monitor. Amazon SQS Dashboard
In PromCat.io, you can find instructions on how to install the exporter, along with ready-to-use configurations to monitor Amazon SQS. There, you will also find the dashboards that we presented in both Grafana and Sysdig format, as well as examples of alerts for your services.
Conclusion
It is possible to monitor Amazon SQS in the same place you monitor your cloud-native infrastructure. Thanks to Prometheus offering a standardized interface, you can leverage existing exporters to ingest Prometheus metrics.
If you would like to try this integration, we invite you to sign up for a free trial in Sysdig Essentials directly from the AWS marketplace.
You can find out more about our Prometheus integration in our documentation or by reading our blog.