


Falco Feeds extends the power of Falco by giving open source-focused companies access to expert-written rules that are continuously updated as new threats are discovered.

In this blog post, we're going to explain how to monitor Open Policy Agent (OPA) Gatekeeper with Prometheus metrics.
If you have deployed OPA Gatekeeper, monitoring this admission controller is as relevant as monitoring the rest of the Kubernetes control plane components, like APIserver, kubelet or controller-manager. If something breaks here, Kubernetes won't deploy new pods in your cluster; and if it's slow, your cluster scale performance will degrade. But let's start from the beginning:
Discover how to monitor Open Policy Agent (OPA) Gatekeeper with Prometheus metrics. Click to tweet
What is Open Policy Agent?
Open Policy Agent, OPA in short, is a general purpose policy engine. It uses a declarative language known as Rego and can be used to answer the following:
- Admission control: Ensure only container images without vulnerabilities can be deployed
- API authorization: Can user X perform operation Y on source Z?
- SSH & sudo authorization: Only on-call team members can SSH into production
- Data protection and data filtering
OPA has integrations with many cloud-native projects, including Kubernetes and Istio, or Sysdig. If you are looking at how to allow or deny scheduling pods based on image scanning results, check out our blog, performing image scanning on Admission Controller with OPA.
OPA Gatekeeper, a Kubernetes admission controller
Gatekeeper is a subproject of OPA that provides a customizable Kubernetes admission controller to audit and enforce policies such as what users can do in Kubernetes (at a more fine-grained level than RBAC), and ensure clusters are compliant with organization policies.
Gatekeeper embeds OPA constraint framework for policy evaluation. This allows you to compare objects in your Kubernetes against one another, create constraints (stored in CRD), and audit against them or create constraint templates to reuse things. We won't get into the details of how Gatekeeper works, but a few key concepts you need to know in order to understand how to monitor Gatekeeper can be seen in the following request workflow:
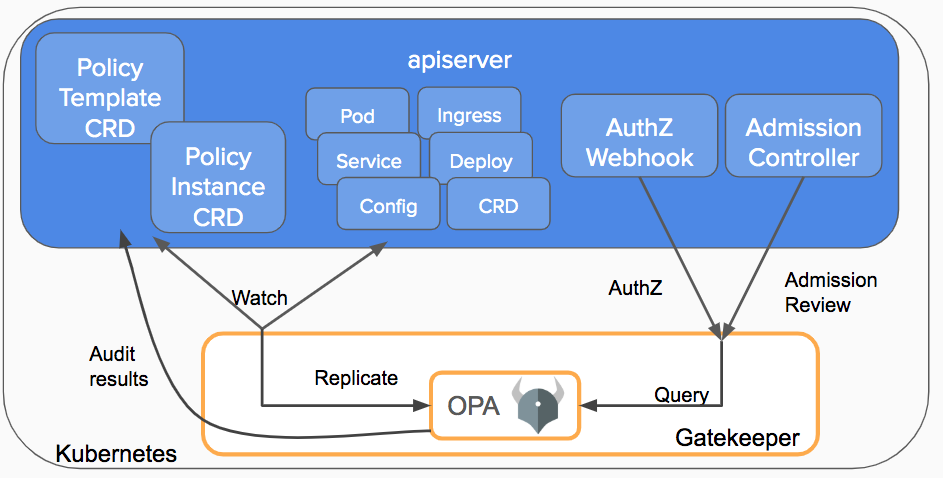
- The Kubernetes API server will trigger the Gatekeeper admission webhook to process the request (whenever an object is created, updated or deleted). The API server will respond based on the policy executed by OPA inside Gatekeeper.
- A constraint or policy instance is a declaration of the desired object definition. These are written in Rego, OPA's declarative policy language.
- A constraint template is required to declare a constraint. Each template describes the Rego evaluation logic and the schema for the constraint, including the CRD and the parameters passed into the constraint.
- The audit functionality periodically evaluates objects against the constraints, detecting pre-existing configurations. Results are known as violations.
If you want to learn more about Gatekeeper, check out this Kubernetes blog or the project page.
Scraping Prometheus metrics from Gatekeeper
Gatekeeper exposes a Prometheus metrics endpoint to provide metrics for monitoring service health and performance. Open Policy Agent also exposes a metrics endpoint when running as a server, but since Gatekeeper embeds OPA and we don't run it as a server, we won't be using it.
When installing Gatekeeper, you must either edit the Gatekeeper controller manager deployment or the service with the appropriate annotations for Prometheus scraping:
% kubectl edit deploy gatekeeper-controller-manager -n gatekeeper-system
[...]
spec:
[...]
template:
metadata:
annotations:
container.seccomp.security.alpha.kubernetes.io/manager: runtime/default
prometheus.io/port: "8888"
prometheus.io/scrape: "true"
[...]
Then, if you have configured your Prometheus server or your Sysdig agent for Prometheus metric collection, you should be already ingesting your Gatekeeper metrics.
Open Policy Agent – OPA Gatekeeper dashboard
Sysdig provides an out-of-the-box Open Policy Agent (OPA) Gatekeeper dashboard for security monitoring your Kubernetes cluster.
You can also find our Gatekeeper dashboard in our Prometheus integrations catalog: PromCat, compatible for both Sysdig dashboards and Grafana. You might even use Grafana against Sysdig Prometheus API if you prefer.
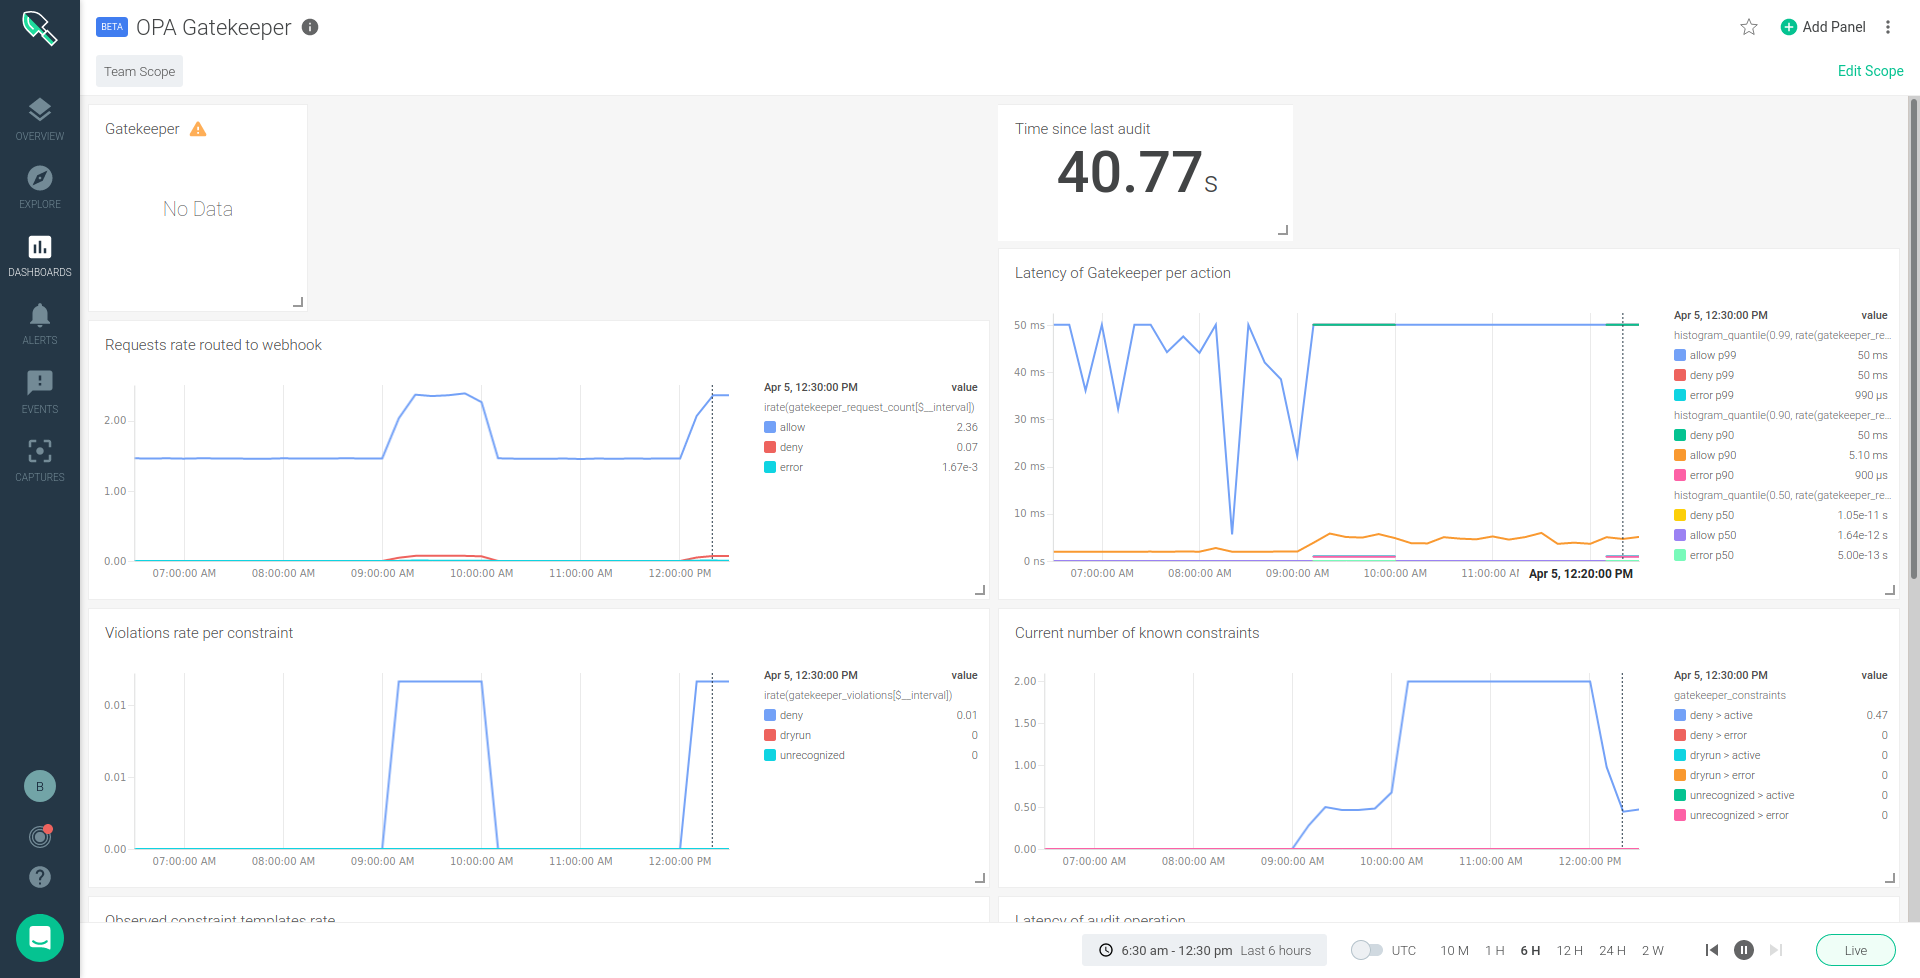
Understanding what each metric is and how to use it can be a little tricky, but let's walk through each of the metrics exposed by Gatekeeper that we include in the dashboard:
Monitoring OPA Gatekeeper Controller metrics
gatekeeper_constraints
Metric type: Gauge
Labels: enforcement_action [deny, audit, dry_run, unrecognized], status [active, error]
Description: Current number of constraints
Understanding this metric: Gatekeeper subscribes to a watch on all constraint resources. Whenever one is created or deleted on the cluster, this count gets updated.
gatekeeper_constraint_templates
Metric type: Gauge
Labels: status [active, error]
Description: Current number of constraint templates
Understanding this metric: Gatekeeper subscribes to a watch on all ConstraintTemplate resources. Whenever one is created or deleted on the cluster, this count gets updated.
gatekeeper_constraint_template_ingestion_count
Metric type: Counter
Labels: status
Description: The number of constraint template ingestion actions
Understanding this metric: When Gatekeeper is notified of a new constraint template, it loads the resource from etcd to after OPA. This metric counts how many ingestions took place. If there is a compilation error, the metric is not updated.
gatekeeper_constraint_template_ingestion_duration_seconds
Metric type: Histogram
Labels: status
Description: Constraint Template ingestion duration distribution
Understanding this metric: When Gatekeeper is notified of a new constraint template, records the time from when it has loaded the resource from etcd to after OPA successfully returns from compiling the code. If there is a compilation error, the metric is not updated.
Monitoring OPA Gatekeeper Admission webook metrics
gatekeeper_request_count
Metric type: Counter
Labels: admission_status
Description: The number of requests that are routed to admission webhook from the API server
Understanding this metric: This metric counts how many times the admission webhook is called. It tags the measurement with the results of the call to OPA.
gatekeeper_request_duration_seconds
Metric type: Histogram
Labels: admission_status
Description: Admission request duration distribution
Understanding this metric: Whenever the admission webhook is called, records the time from the start of the function to right before it returns (e.g., via golang defer). It tags the measurement with the results of the call to OPA.
Monitoring OPA Gatekeeper Audit process metrics
gatekeeper_violations
Metric type: Gauge
Labels: enforcement_action
Description: The number of audit violations per constraint detected in the last audit cycle
Understanding this metric: During each run, the audit sums up all of the violations that it finds and reports these counts per-enforcement-mode.
gatekeeper_audit_last_run_time
Metric type: Gauge
Labels:
Description: The epoch timestamp since the last audit runtime
Understanding this metric: At the end of each run, the cron job reports the epoch of when the job ended, given as seconds in floating-point.
gatekeeper_audit_duration_seconds
Metric type: Histogram
Labels:
Description: Audit cycle duration distribution
Understanding this metric: Whenever cron job runs, it should record the time from the start of the audit function to completion.
Most of these metrics are described by Erik Kitson on Gatekeeper #157. Thanks to Erik for doing that, it really helped me gather this list.
Google Anthos also exposes these Prometheus metrics for Anthos Config Management as it embeds OPA Gatekeeper. And if you are using Anthos, don't miss monitoring and security on Google Anthos with Sysdig and our solution for securing Google Cloud Run.
Security monitoring for Kubernetes
With Sysdig Secure DevOps Platform, you can confidently run cloud-native workloads in production. DevOps teams can secure and monitor their container and Kubernetes environments using a single platform built on open source tools, with the scale and usability enterprises demand.
Monitoring your Kubernetes admission controller using OPA Gatekeeper is just one example of how security and monitoring are now part of the same DevOps workflow. Sysdig Prometheus monitoring capabilities allow us to collect Prometheus metrics and query them using PromQL for security monitoring, allowing DevOps teams to reduce risk and resolve issues faster, regardless if there are performance or security incidents.
Haven't tested Sysdig yet? Sign up for a free trial now!