


Falco Feeds extends the power of Falco by giving open source-focused companies access to expert-written rules that are continuously updated as new threats are discovered.

Here's a bold thought: We think the era of telling your monitoring software what to look for is over. Instead, it's time for your software to proactively tell you what there is to see. That's what our new Sysdig Monitor capability, Spotlight, is all about.The moment in time when everything is running smoothly in your environment is joyous. You may reward yourself with a high-five, a cup of coffee, or a longer-than-usual break. In an imperfect world, however, it's usually not long before new concerns and frustrations resurface. That's fine. It's why we get paid. But, how can you quickly identify the good and the bad so you can get back to that well-earned break?Consider these common challenges:
- Your infrastructure: In the chaos of deployments, kills, new apps and new releases, a lot of things may coming, going, and changing in your environment. How do you quickly discover what's been added? How can you see a service or container has gone down?
- Your team: Growing your team from a handful to dozens or more teammates can be as frustrating as it is rewarding. How do you or other new monitoring operators and admins get up and running quickly? Are you set up with all the right alerts and data? How can you proactively empower new users with baseline info about the environment?
To help with these scenarios and more, we're thrilled to introduce Spotlight, a new Sysdig Monitor feature that will be instrumental in your day-to-day efficiency.
Infrastructure Scan: Surfacing need-to-know environment details
If you're running Docker and orchestrating your environment with a tool like Kubernetes, your apps are continually moving, pods are restarting, and container locations are shifting. At the same time, as a critical part of running your environment, your monitor software may need some maintenance. Spotlight helps you save time by notifying you of changes and things that need attention.
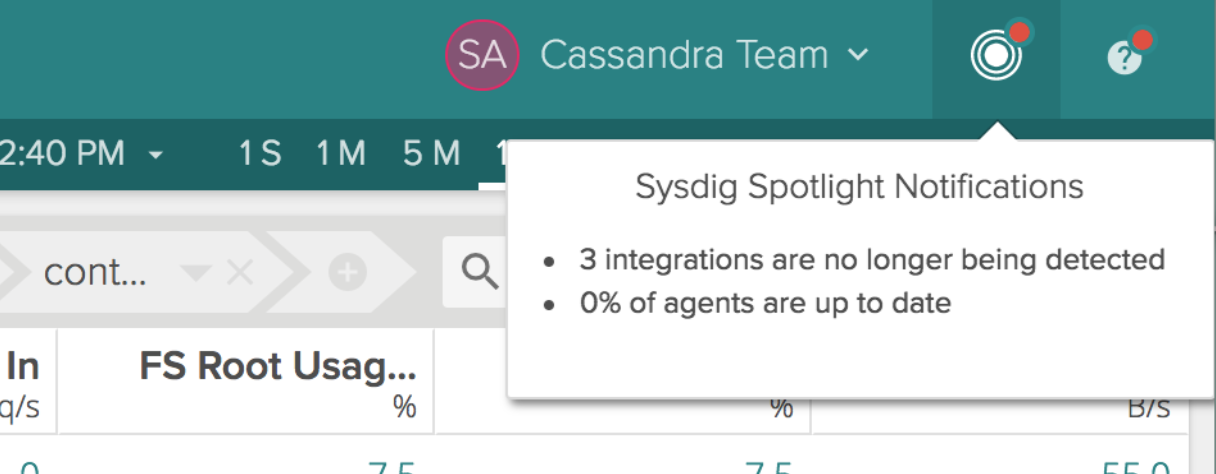
With Spotlight, if there's something you need to see, you'll be notified by a red dot that appears on our new Spotlight icon in the user settings section (upper right-hand corner of the app). Click on the icon and the Infrastructure Scan panel opens to provide a roll up view of the latest status of hosts, containers, orchestrator and platform tools, and applications. It also gives you a quick summary of administrative items related to your Sysdig Monitor deployment.For each integration discovered in your environment, you'll see a representative panel icon. In addition, Spotlight will also notify you over time of any new integrations that are added on a per-team basis and automatically create a dashboard for it. This means less work for both admins and team members. For each icon, a health indicator in the upper right corner tells you at-a-glance if things are OK – or not.
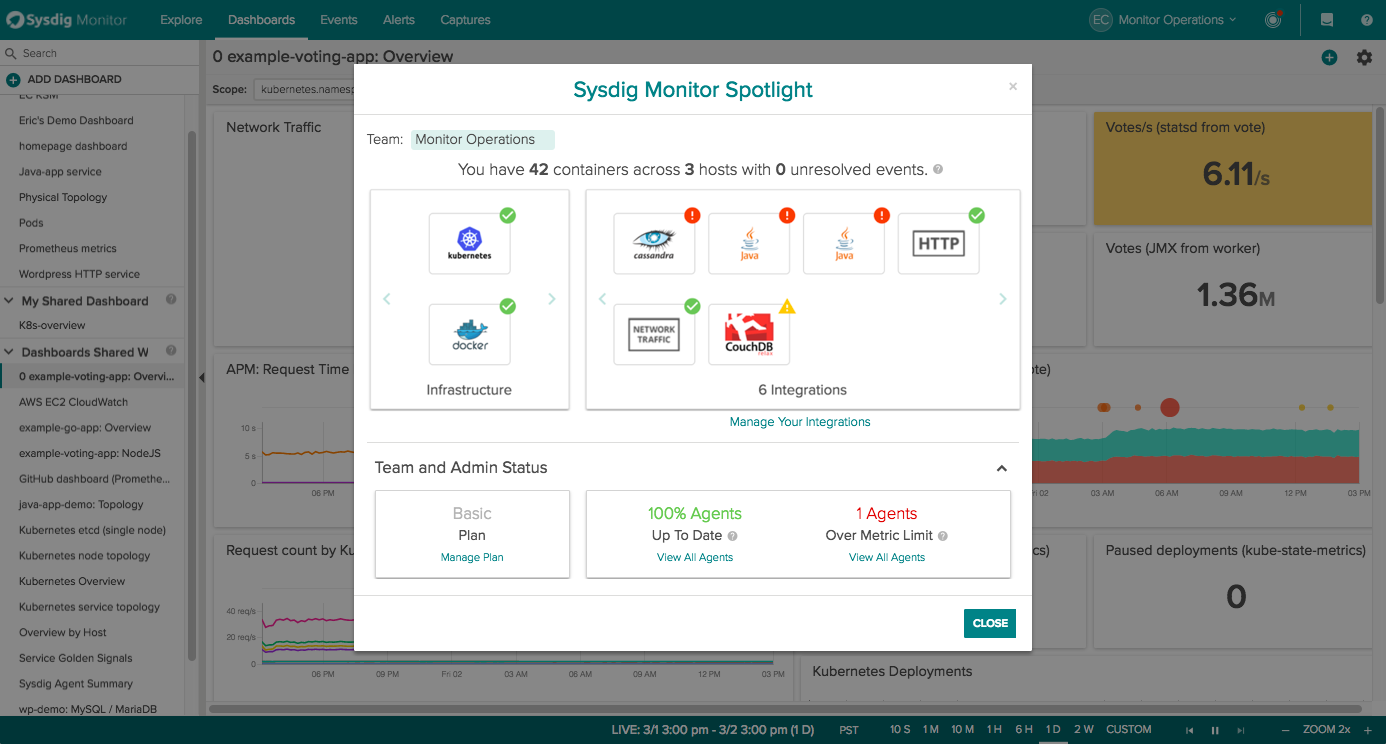
In the example above, we see the three broken integrations surfaced. If you hover over any of these app icons a pop-up box presents suggestions for possible solutions, such as viewing a dashboard for more context or checking documentation.The Team and Admin Status section is intended to helps you keep track of any needed agent updates or metric throttling, in addition to details about your SaaS subscription plan. If any agents are out of date, we'll let you know here. In our example, 100% of our agents are up to date. We do however, have one agent that is over it's metric limit. To see the details of this issue and determine if any metric throttling is required, you can click 'View All Agents' to see the details.
Does your monitoring software inform you of infrastructure changes? @sysdig does! Click to tweet
Getting started quickly – easy onboarding for team members
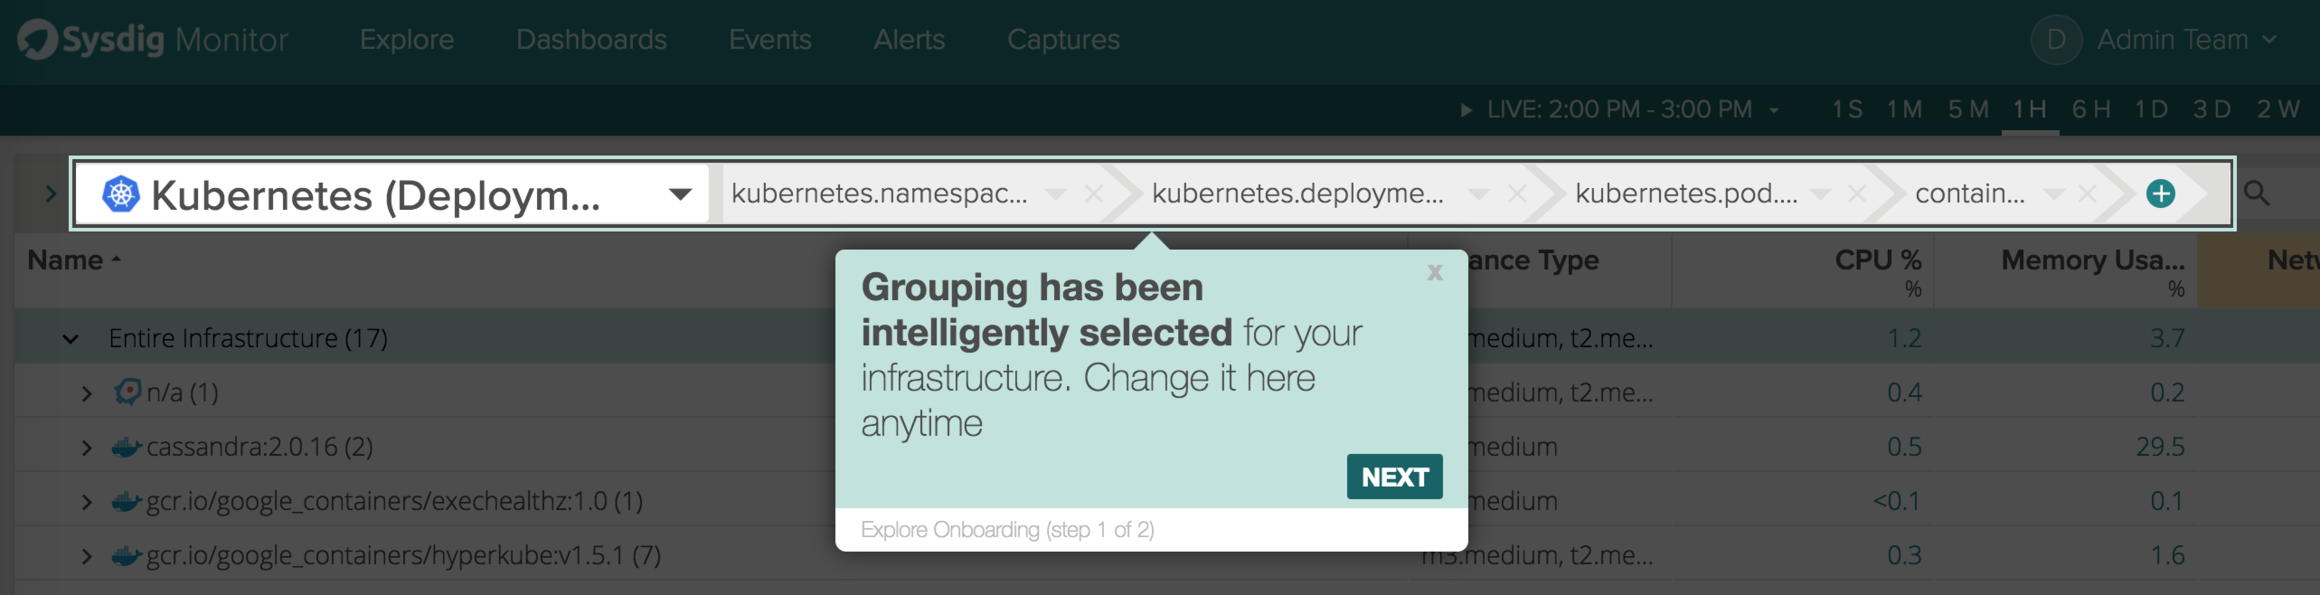
How robust is your process to onboard a new devops team member or developer into your monitoring system? Drop them in and see if they can swim? Or a generous 15 minute tour around your 2,000 prometheus metrics and a, "let me know if you can't find what you're looking for?"Whether you're the second or hundredth person to join a team, it's crucial to be on the same page as your colleagues and to be using the same processes. With Spotlight, when you log into Sysdig Monitor for the first time or are entering a new team, you'll see the Infrastructure Scan panel that automatically lets you know the details and status of your environment. You can use it as a guide for understanding key components such as hosts, containers, orchestrations and platform tools, and applications. In addition, you'll be able to see the health icon to know if things are OK in your environment before entering it.
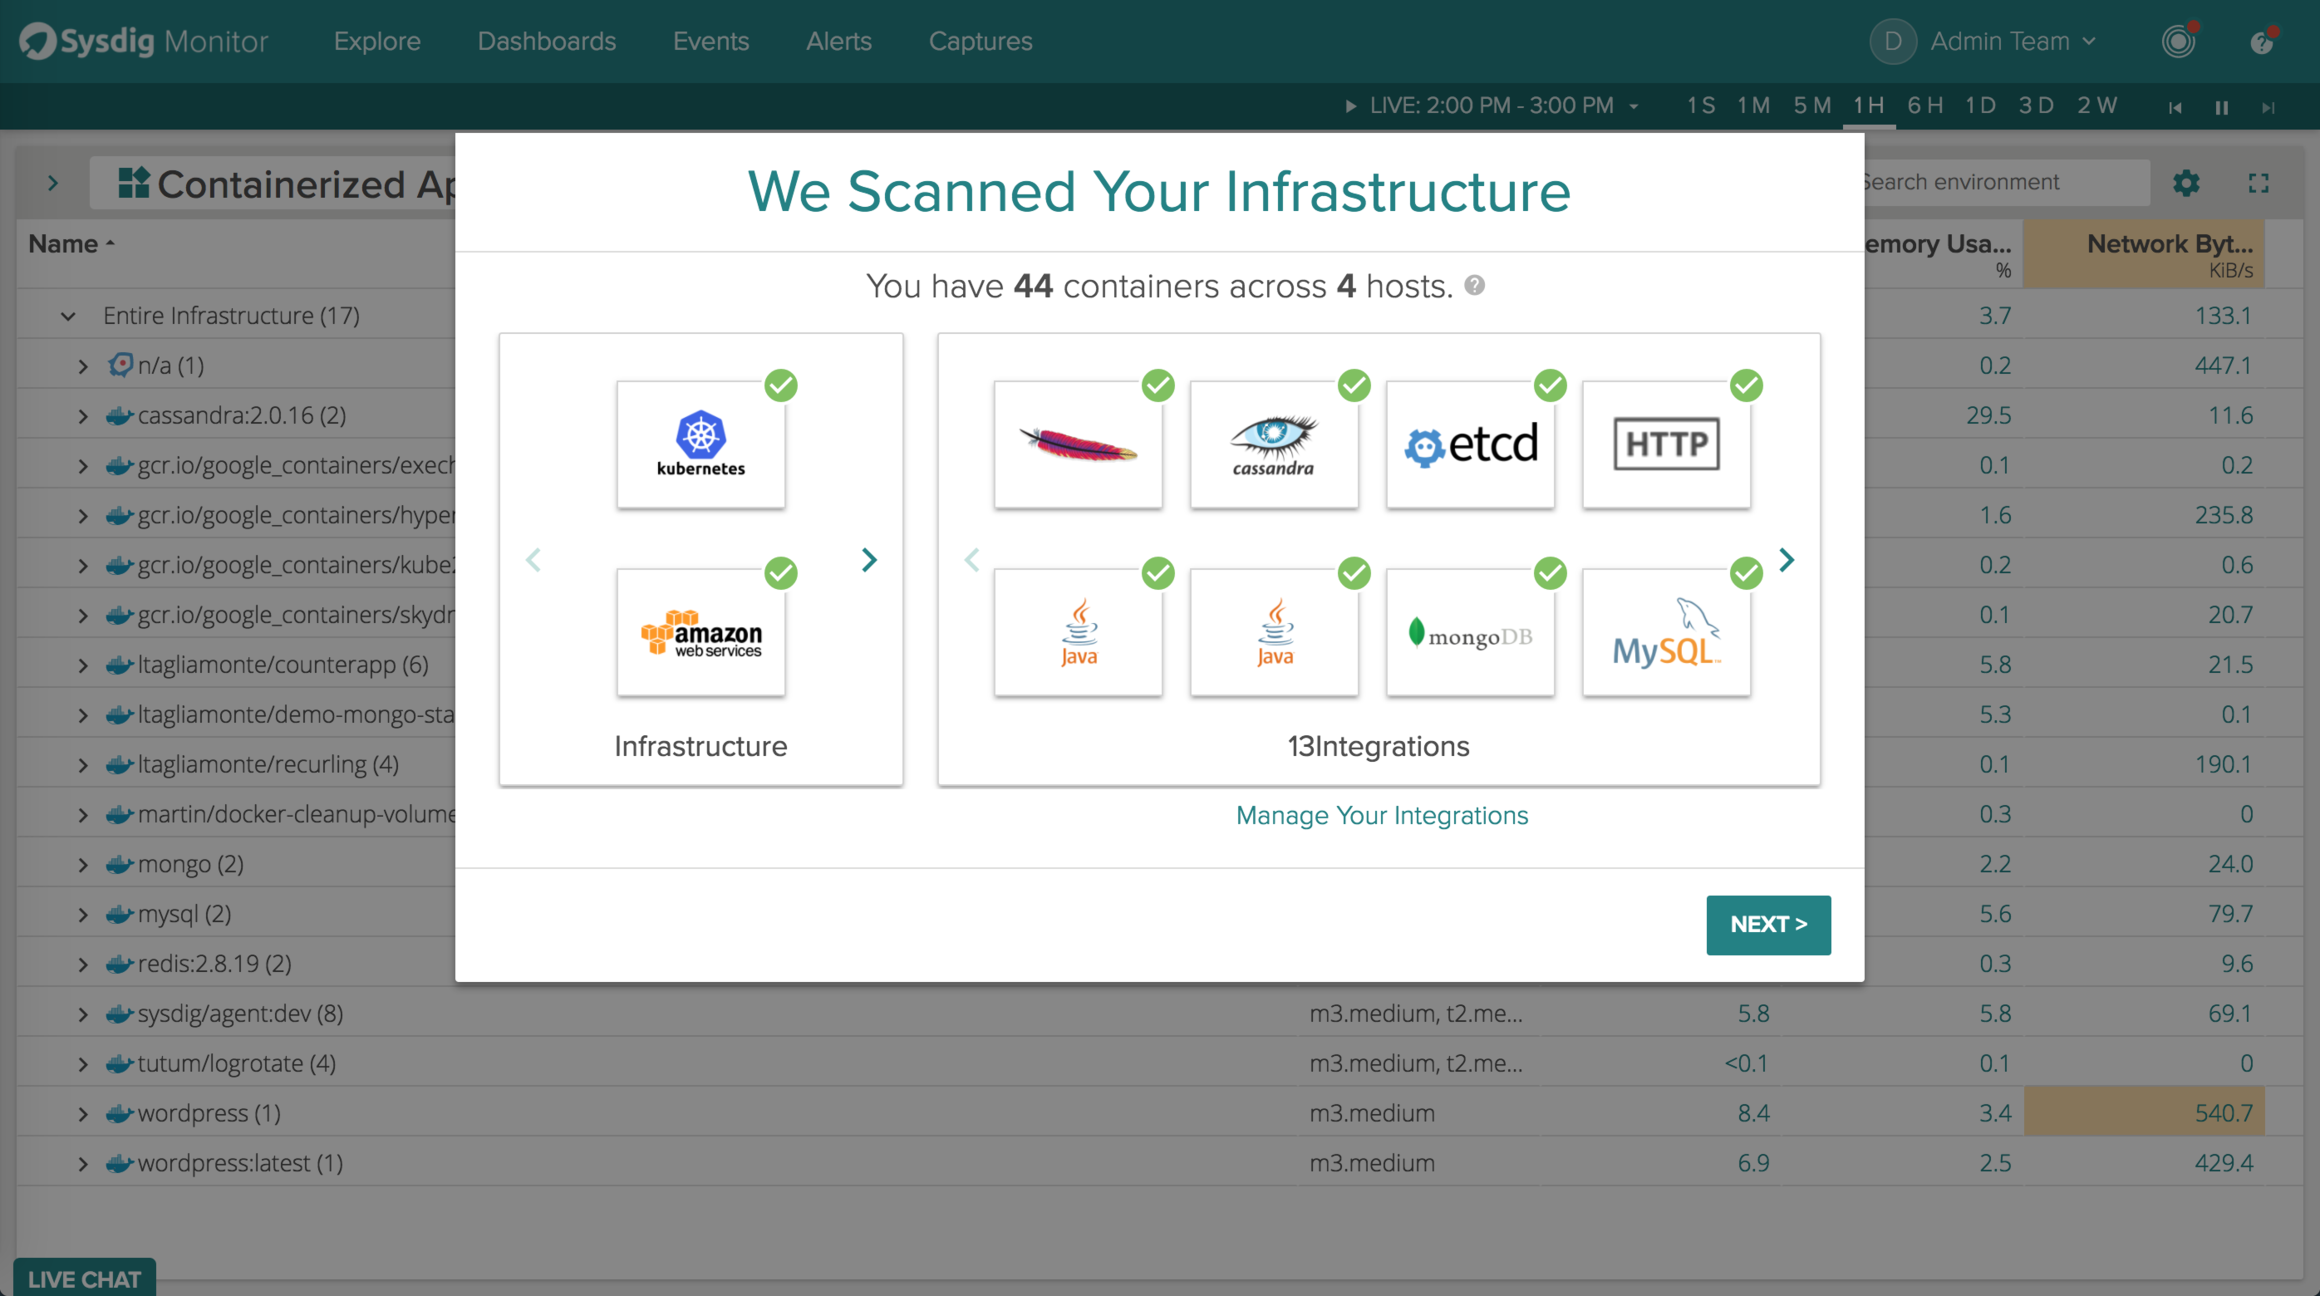
Infrastructure Scan in action
Click next and you'll see how many metrics, dashboards, and alerts are immediately available for your team. This is super helpful because it saves you precious time. Why spend effort importing or creating metrics, dashboards, and alerts when Sysdig can do it for you? Admins, anything you create for a team prior to them entering the application will also be surfaced here.
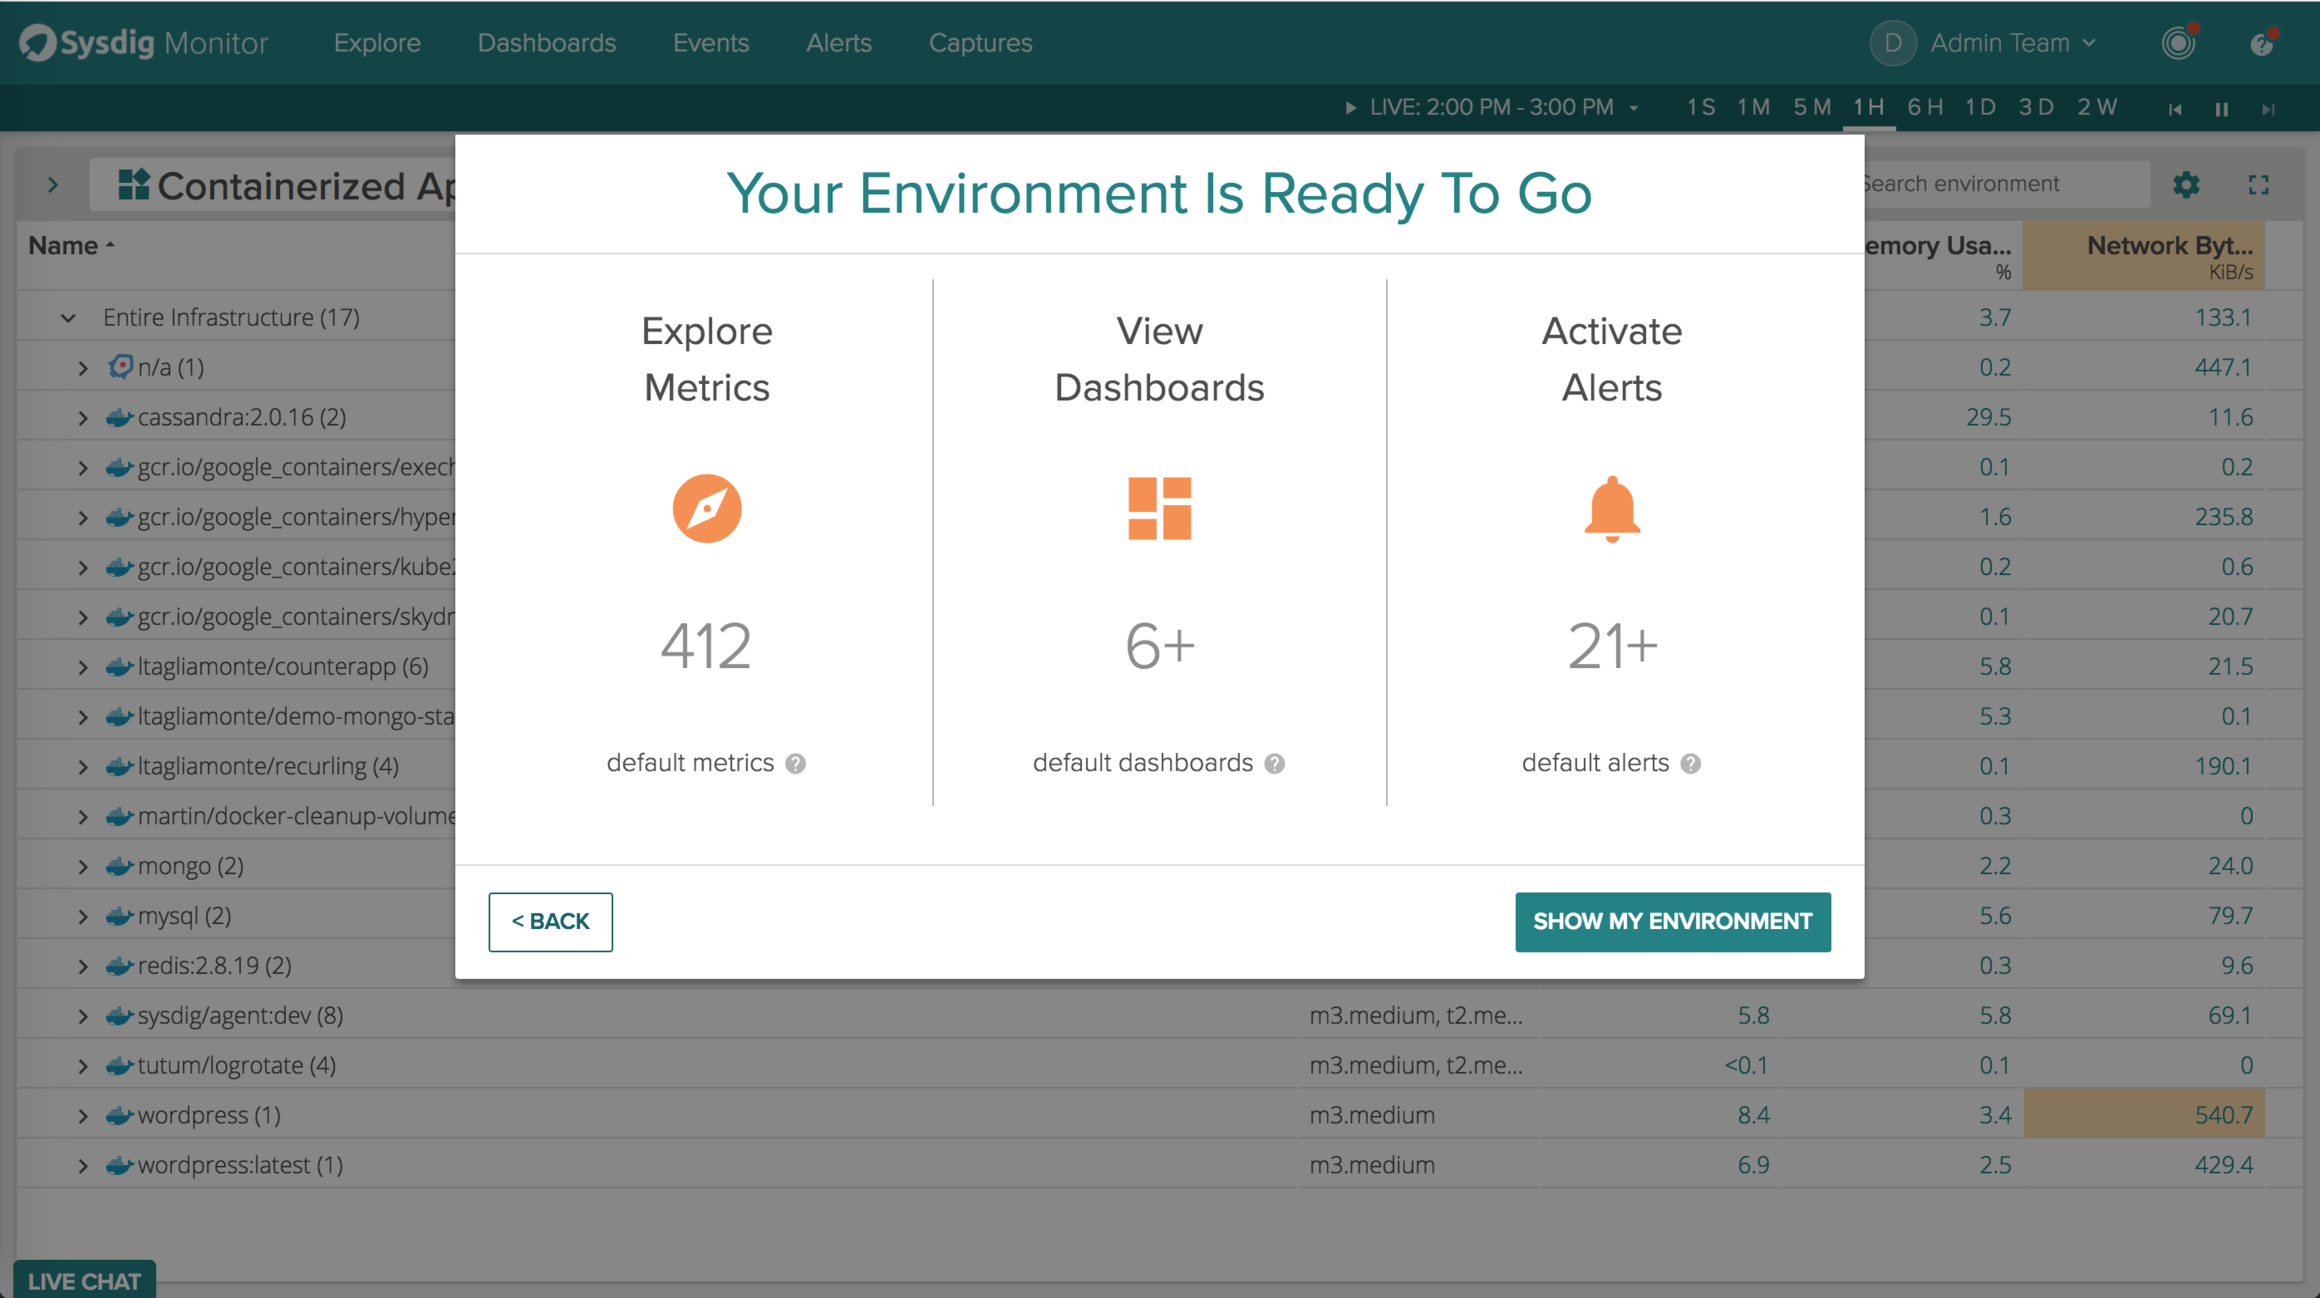
Metrics and dashboards and alerts, oh my!
Lastly, after being dropped into your new environment, you can take a walk through of our most powerful page, Explore. If you need help, you can watch tutorials for each of Sysdig Monitor's pages by clicking Walkthroughs under Help.
Learn the basics of troubleshooting with our walkthroughs
And that's it!
Spotlight's analytics, health checks, and information surfacing are here to help you through every point in your Sysdig Monitor journey. Like it? Love it? Think something's missing? Let us know what you think. Chat us through the app, via Slack, or drop us a line at @sysdig. Happy digging!