


Falco Feeds extends the power of Falco by giving open source-focused companies access to expert-written rules that are continuously updated as new threats are discovered.

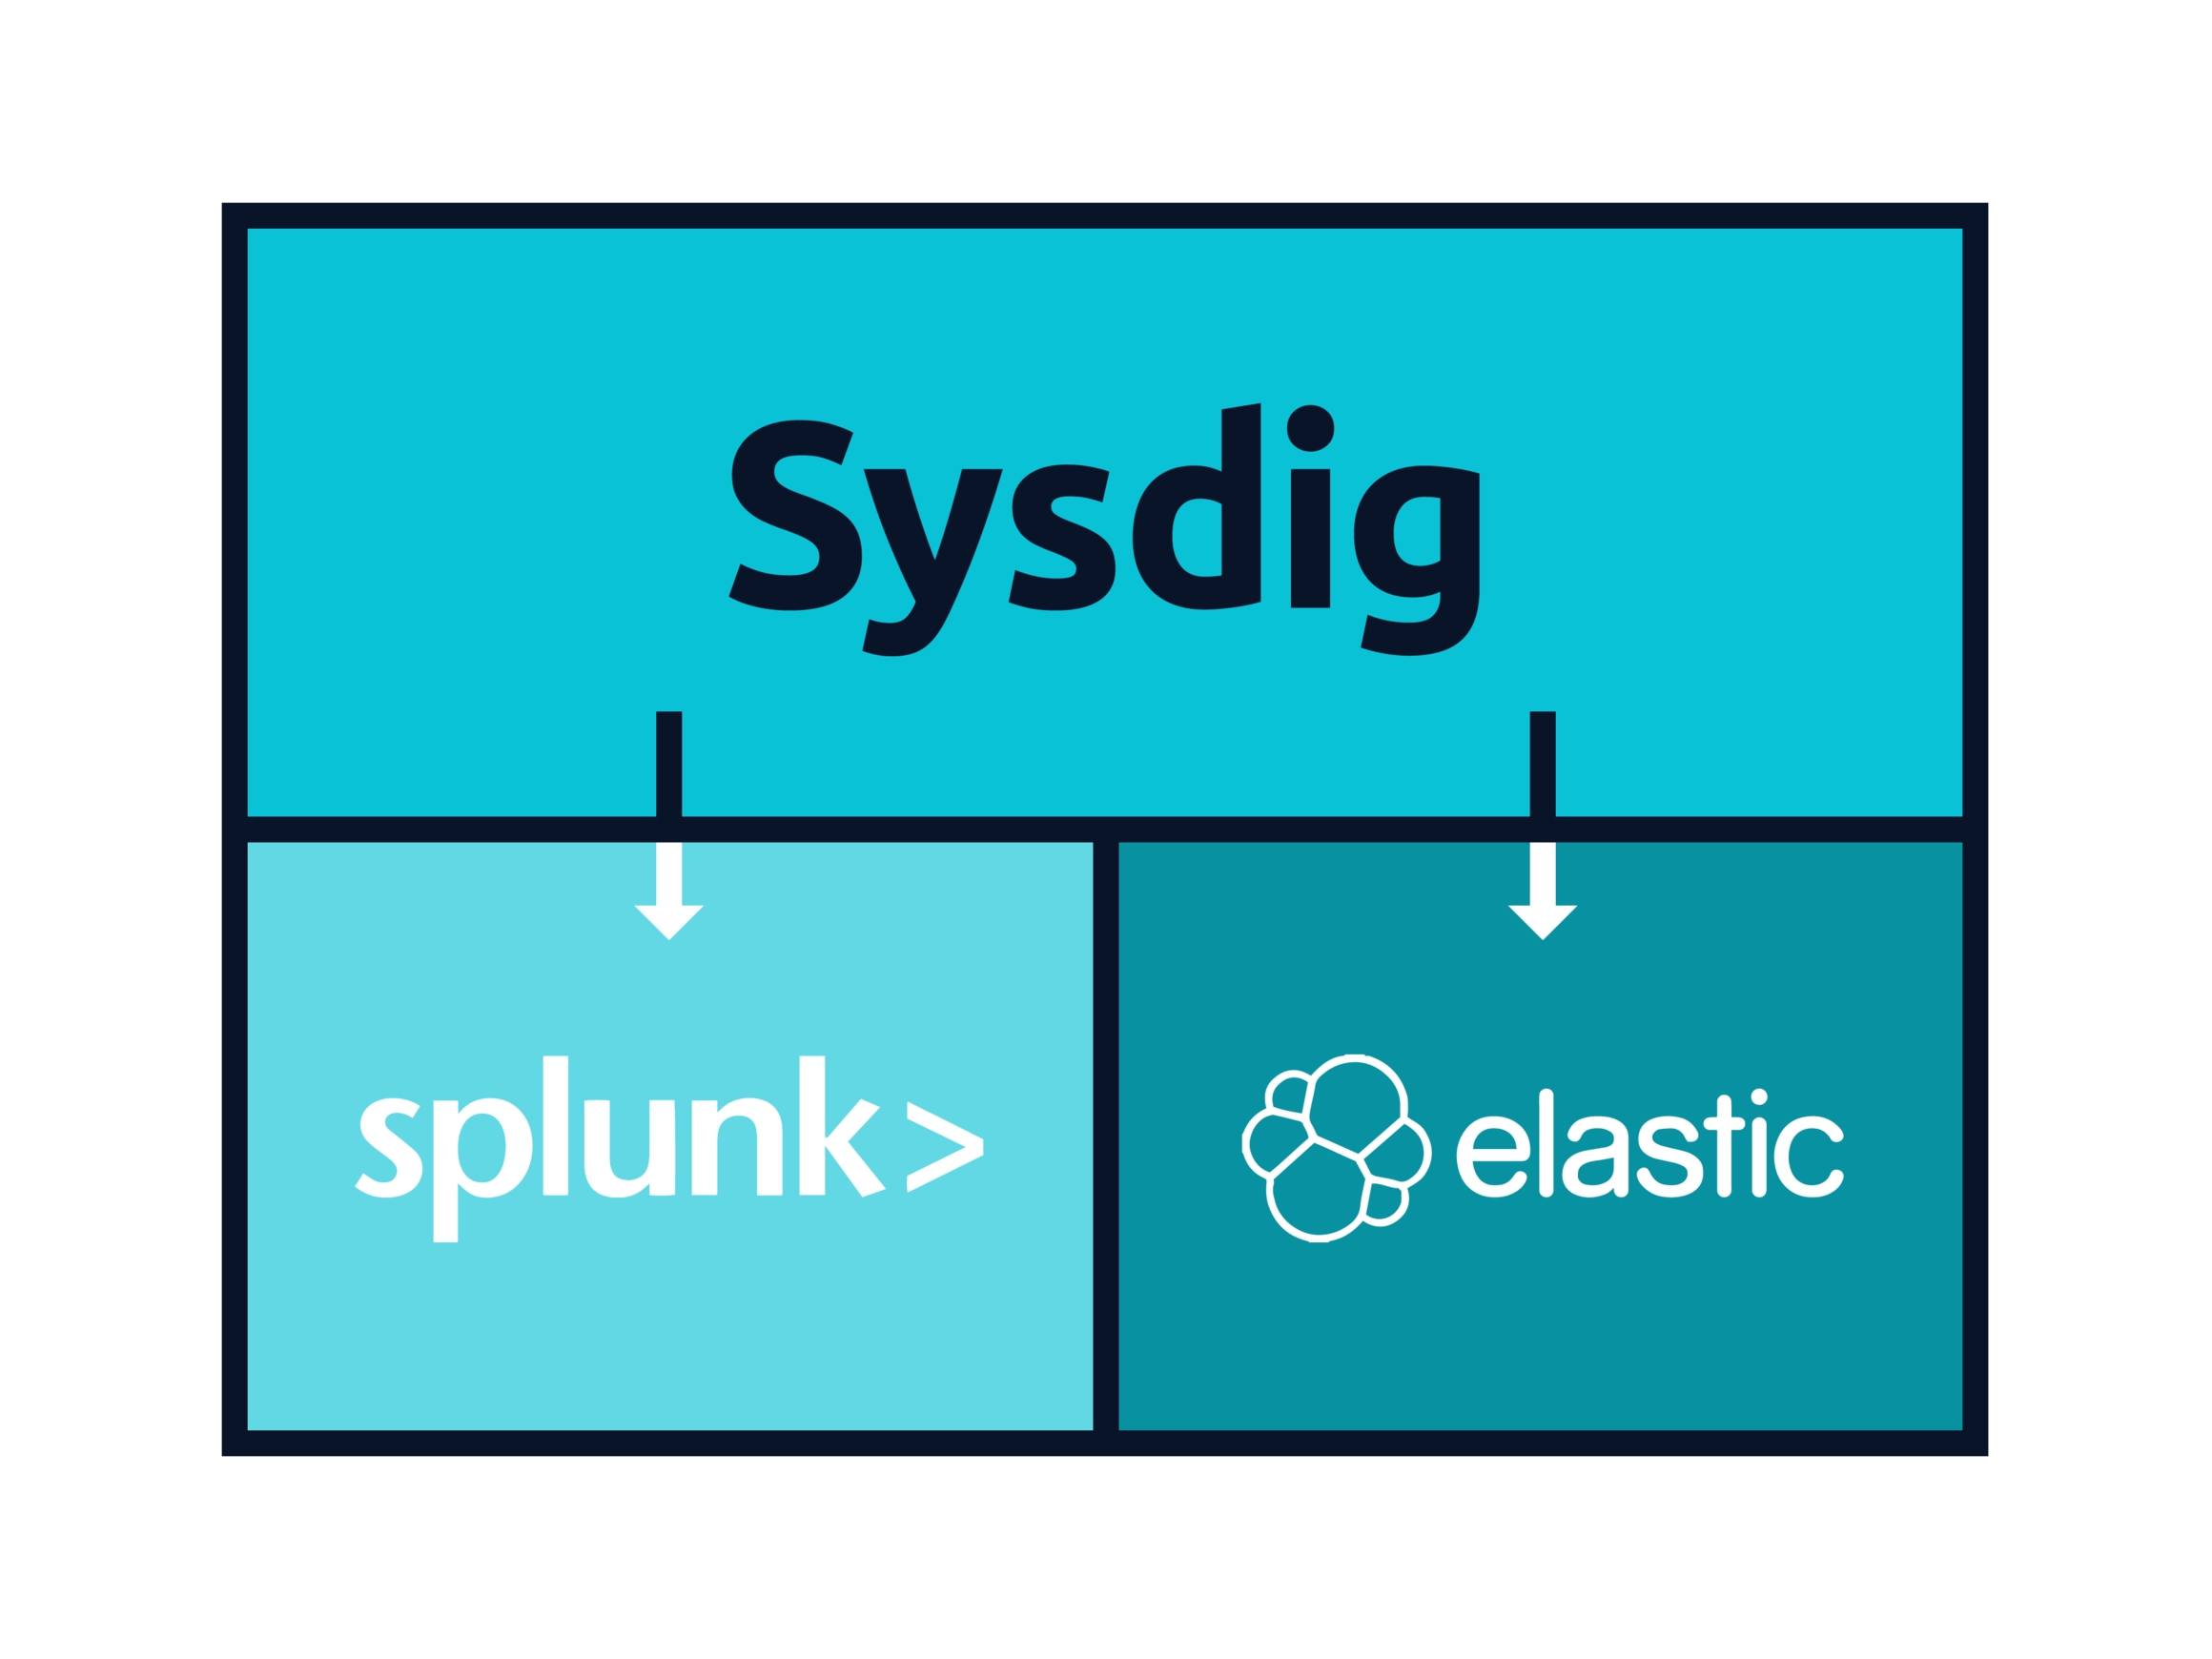
In this article we are going to see how to aggregate Kubernetes / Docker events and alerts into a centralized logs system like Elasticsearch and Splunk.
Logging engines are a great companion of Kubernetes monitoring like Sysdig Monitor. Typically responding to an incident begins by looking at the relevant metrics and then finding out if there are any related log entries.
In the context of security, bringing together events from different sources can shed some light on the reach of the breach. Sysdig Secure can emit secure policy violation events, but also block the attacks and enable post-mortem analysis and forensics.
Comparing events notification channels
Both Sysdig Monitor and Sysdig Secure provide powerful semantics and notification channels to define the events and alerts that you want to monitor.
If you access the Notifications section of your profile on Sysdig Secure or on Sysdig Monitor, you will find the list of integrated notification channels. For any alert on metric threshold, event or security incident you can configure one or more of these notification channels:
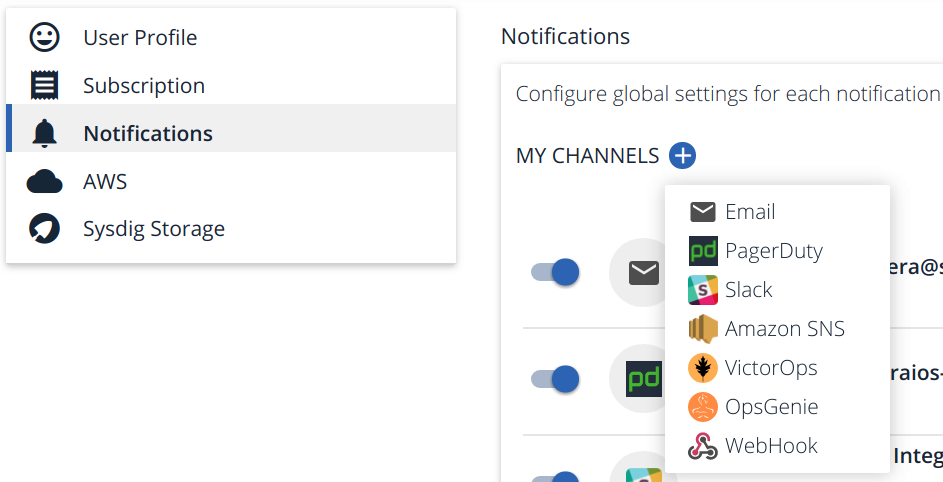
- Email: Old school notifications. Goes directly to your inbox and doesn't need any other additional requirements. Email has its own limitations (no delivery guarantees, no acknowledgment, or integration with other software for escalation channels, rotation, etc). Still very used due to the low entry barrier.
- PagerDuty: SaaS commercial product for incident response platform specifically tailored for IT and support teams.
- Slack: Having informal notification channels in your enterprise messaging platform is increasingly popular, it encourages agile issue discussion and team awareness.
- Amazon SNS: Cloud-native Amazon Simple Notification Service (SNS), a pub/sub messaging and mobile notifications service, typically used when you build your own events / alerts management service.
- VictorOps: SaaS commercial product for DevOps oriented incident management solution. Focused on "on-call" IT engineers and best practices to minimize downtime.
- OpsGenie: Another commercial product for alerting, on-call management and incident response orchestration solution.
And, if you need to integrate with anything else… then you have the ubiquitous WebHook: a user-defined HTTP callback.
Sending #Kubernetes & #Docker events to #Elasticsearch and #Splunk using @Sysdig Click to tweet
The IT world has been trying to standardize over a platform agnostic remote procedure call protocol for a long time. Just to name a few, you have SOAP, CORBA, and lately, very often used in the Docker and Kubernetes ecosystem: gRPC.
The WebHook mechanism is one of the most popular and common on the web, due to its inherent simplicity and predictability:
- It builds over well known languages and protocols HTTP and JSON.
- Can be exposed and processed using commonplace web servers.
- Data manipulation and retrieval verbs usually follow the REST design patterns.
Let's create a WebHook callback to send Sysdig events to Elasticsearch and Splunk as an example!
Configuring Elasticsearch and Splunk WebHook integration
These two platforms accept regular HTTP calls with JSON body content as one of their data input mechanism, making forwarding from Sysdig easy enough.
We can add a new WebHook notification channel on Sysdig with your Elasticsearch or Splunk URL.
- For Elasticsearch, we follow the URL convention /index/type. You can see in the example below that we specify the host and port and then use the index sysdigsecure and document type event. Elastic provides plenty of documentation on how to index documents and how to send data to the engine.
- Give it a name and also define if you want to send over trigger off and resolved notifications.
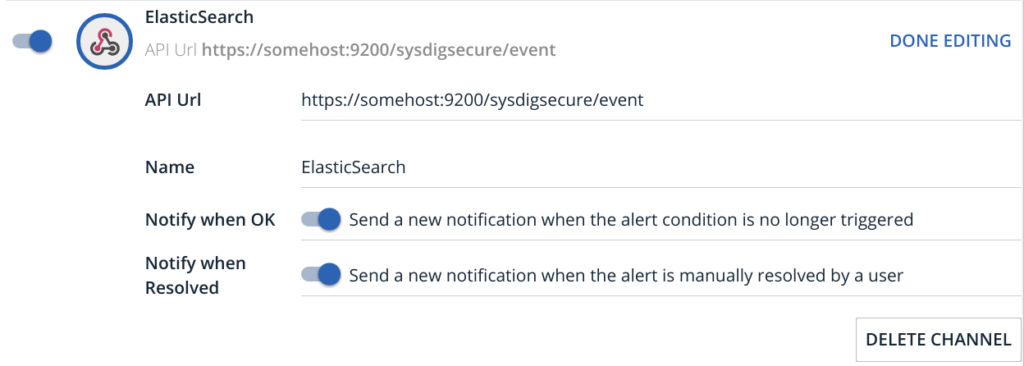
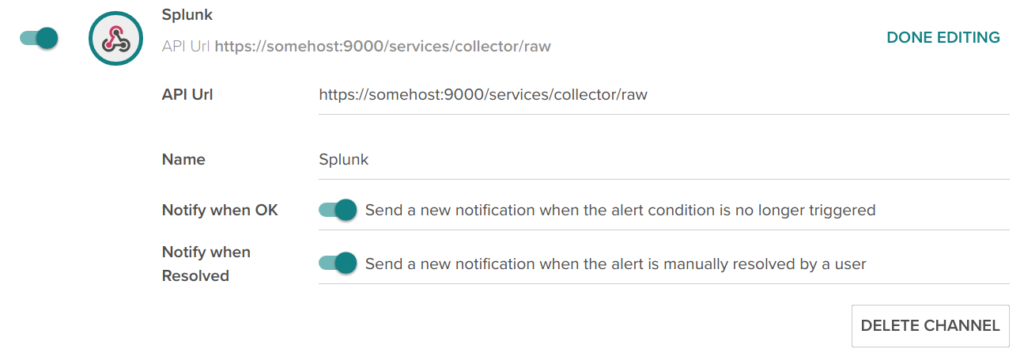
- For Splunk, we have created an HTTP event collector or HEC. Splunk events have their own JSON schema, we used the "raw" endpoint services/collector/raw so we can keep the original Sysdig formatting and semantics.
There are, however, two more details that you need to adjust for this to work as intended: authentication and value mapping / preprocessing.
WebHook authentication using headers
It's highly recommended not just sending data over HTTPS but also to configure WebHook authentication using custom headers on your HTTP requests.
In order to define these custom headers, we will use the Sysdig API to modify the previously created notification channels:
First, get your API Token for this operation on Sysdig Monitor or on Sysdig Secure.
Second, retrieve the list of configured notification channels (BEARER-CODE is the API Token we just mentioned):
And locate the channel you want to modify in the JSON output description
OK, so for this example we want to modify the channel 14787, version 17.
Third and last, let's update with our authentication header. We will use the Splunk HEC token and auth header format for this example:
Note that I copied the field values from the original channel, adding the additionalHeaders dictionary.
Retrieving the available channels again you should get:
This update bumped the version to 18, adding the HTTP Authorization header.
Elasticsearch and Splunk data preprocessing for Kubernetes & Docker events
Every data analytics engine has its own data formatting preferences and conventions. You will probably need to configure some preprocessing to adjust incoming data.
Elasticsearch mapping and ingest nodes or Splunk field extraction are huge topics, out of scope for this article, but just as an example, consider this Sysdig Secure event instance:
Note that time-related fields are formatted as 'microseconds since the epoch time', you will probably need to adapt this to the standard date format used by your engine.
For example, you can define a pipeline and field mapping for Elasticsearch. Elasticsearch accepts a maximum time resolution of milliseconds, this pipeline will create an additional estimestamp field, preserving the original data:
And now we define a mapping declaring the estimestamp field as a date in 'milliseconds since the epoch':
First, make sure that the WebHook is correctly configured and the data is flowing to your aggregation engine where it is being preprocessed and indexed.
Then, it's time to use all your data analysis expertise over that Docker / Kubernetes data processed by Sysdig as events, alerts and security policy violations.
Elasticsearch / ELK dashboards for Kubernetes and Docker
Now you are ready to build your own dashboards in Elasticsearch / ELK using Kibana. These are some of the examples we built:
Elasticsearch + Kibana, raw data search:
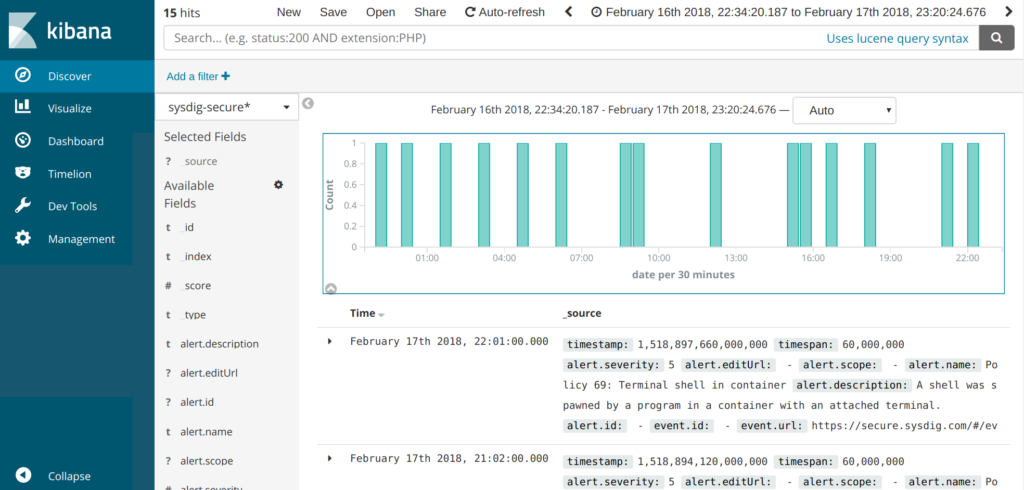
First, we create a Kibana Index Pattern and Discover the raw data to verify that: * Source event fields are correctly mapped * We have the expected number of items and * The timestamps are also correctly parsed by the engine.
Elasticsearch + Kibana example Sysdig Monitor Dashboard:
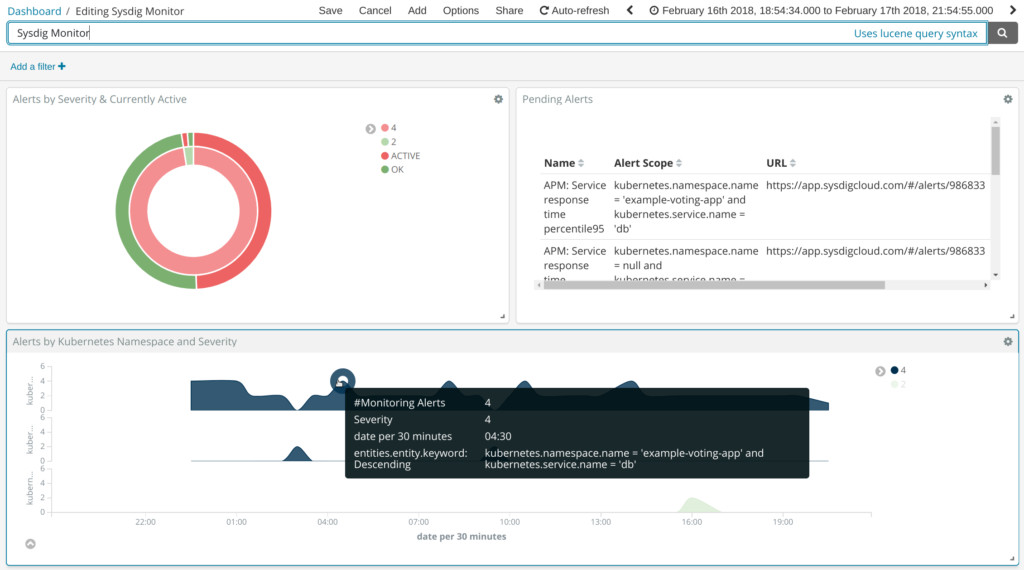
In this example we have classified Sysdig Monitor alerts by severity and whether or not they are still active (pie graph), on the top-right table we are displaying the text information together with the alert name and HTTPS link to visualize directly on Sysdig Monitor. At the bottom, we have a time series graph segmented by Kubernetes namespace.
Sysdig events give you plenty of Docker / Kubernetes metadata to configure your container-specific data mining.
Elasticsearch + Kibana example Sysdig Secure Dashboard:
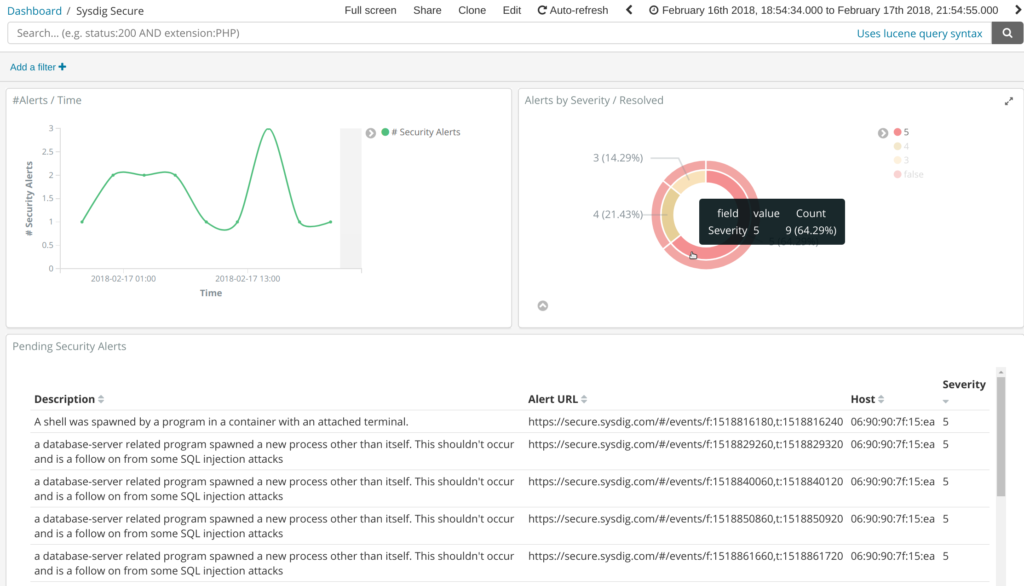
This dashboard is very similar to the last one, but in this case, using Sysdig Secure events. We also have a time distribution, severity / resolved pie and a data table, ordered by the severity of the security event.
Splunk dashboards for Kubernetes and Docker
Splunk, raw data search:
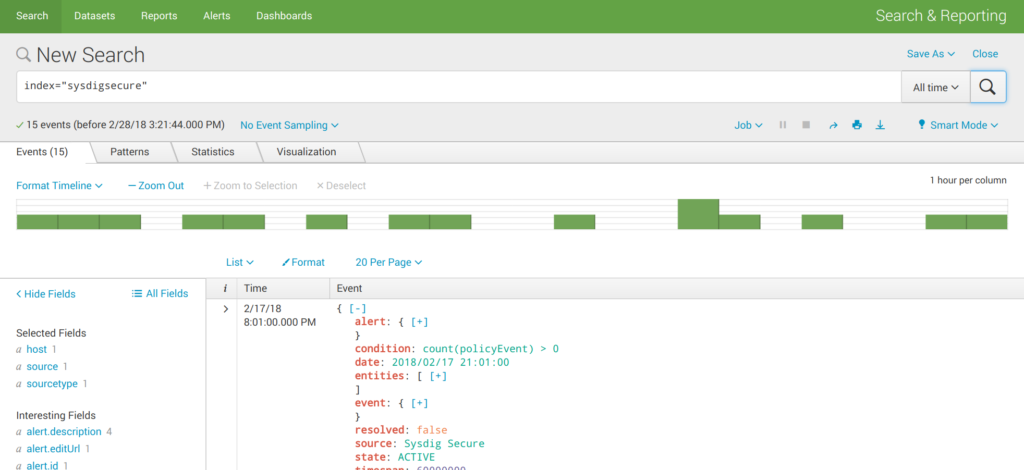
First, we dump all the data choosing "All time" period and just the configured index sysdigsecure to check if the engine is correctly receiving and interpreting the JSON input stream.
Splunk example Sysdig Monitor Dashboard:
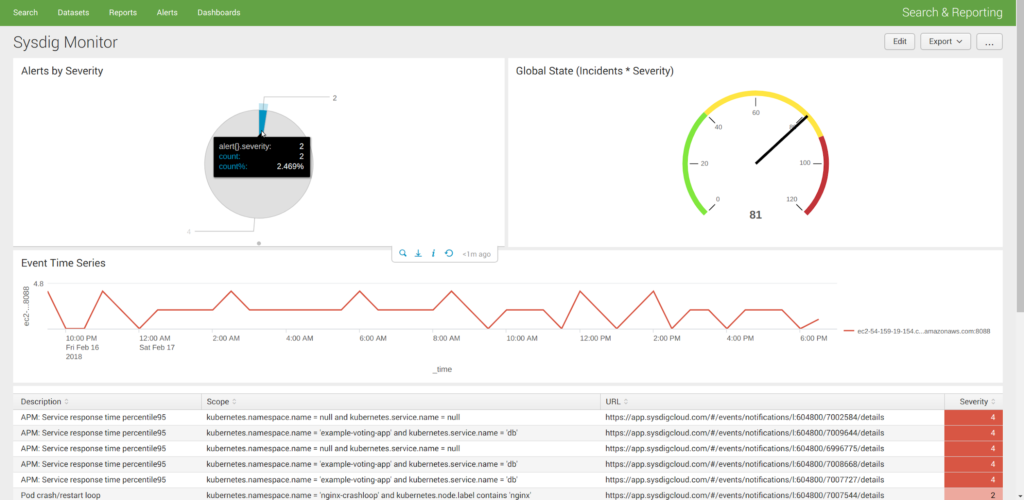
This is a prototype Sysdig Monitor dashboard, featuring an alert severity pie, a global state gauge (# of active alerts * severity), frequency of events time series and text information table at the bottom.
Splunk example Sysdig Secure Dashboard:
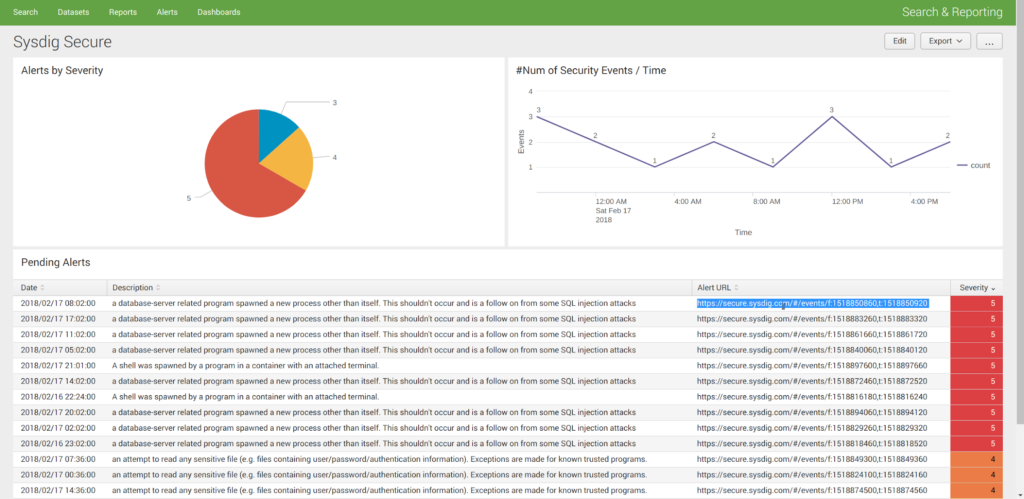
… and the Sysdig Secure dashboard with roughly the same information as the one we created for Elasticsearch.
Further thoughts
- We would love to know how you collect, store and visualize your Docker and Kubernetes events and alerts, are you using Elasticsearch / ELK, Splunk or something else?
- Which other logging or tracing systems do you run alongside your monitoring tool?
Let us know through Twitter to @Sysdig or on our Sysdig community Slack!
PD: You can also get event data in and out Sysdig using the Sysdig REST API or Python libraries.