Before the release of Java 9 and 10, there were several limitations to deploying and monitoring Java in Docker. This post explores how the latest versions of Java address the most common of these limitations, and includes examples of how to make the most of monitoring Java in Docker.
Common limitations with Java in Docker containers
Spawning a complete JVM for every container
The Java JVM can be shared between any number of Java processes in the same OS. In bare-metal or VM deployments where you only have to spawn this process once to support multiple Java applications, the initial cost is negligible. However, containers typically involve multiple instances of the same image that are destroyed and recreated, which can be expensive in terms of memory, CPU shares, and cold starts.Container isolation blindness
Java 8 and earlier aren’t aware of container isolation. Instead, containers “see” the total amount of memory or CPU cores available in the system. Without the proper context of containers and limits, this could lead to incorrect sizing decisions including spawning too many threads. In turn, your Java processes may be killed because they are out of memory (OOM) or are expending too much CPU time handling the synchronization of the oversized number of threads.Inconvenient monitoring
For the monitoring aspect, it is more of an inconvenience that a limitation. When using containers, you must expose the metrics ports using TCP/IP and a given port. Unfortunately, the “local JVM autodetection” feature in tools such as JConsole and VisualVM will not be available anymore. Sysdig can come in really handy if you don’t want to manage metric scrapings over the network. Using #Java 10 and #Sysdig for container visibility, Java inside #Docker containers is a breeze! Click to tweetAddressing container limitations with Java 9 and 10
Multiple JVM instances are unavoidable, but still lightweight
Having to spawn a complete JVM per container is still inevitable. However, take a look at a modern version of Java that’s running on a container with a simple application on top…docker run -d --name simple_stats mateobur/javatroubleshooting3
 Sure, it’s not going to be your lightest or fastest image, but even a node with just modest hardware will be able to handle a large number of these images without suffering much load.
Container blind spots are cleared up
As for the issue of container isolation blindness, this has been mostly fixed by improved container-Docker integration in versions 9 and 10 of the JVM. In fact, there are several ways in which Java 10 specifically has been improved to integrate better with Docker overall:CPU detection
As we previously mentioned, the amount of CPU cycles a container can consume from the host is unlimited by default. But we can pass a Docker parameter at boot to restrict the available cores. Java 9 doesn’t recognize CPU limits:$ docker container run -it --cpus 2 --entrypoint bash openjdk:9-jdk
root@18f9f012c200:/# jshell
Nov 13, 2018 11:01:33 AM java.util.prefs.FileSystemPreferences$1 run
INFO: Created user preferences directory.
| Welcome to JShell -- Version 9.0.4
| For an introduction type: /help intro
jshell> Runtime.getRuntime().availableProcessors()
$1 ==> 8
$ docker container run -it --cpus 2 --entrypoint bash openjdk:10-jdk
root@eff3be081ed5:/# jshell
Nov 13, 2018 11:03:02 AM java.util.prefs.FileSystemPreferences$1 run
INFO: Created user preferences directory.
|  Welcome to JShell -- Version 10.0.2
|  For an introduction type: /help intro

jshell> Runtime.getRuntime().availableProcessors()
$1 ==> 2
Memory detection
The JVM documentation specifies that on a server-class machine with +2 CPU and +2GB of RAM or 64 bit JVMs, the JVM will run in server mode and the maximum heap size will be set to 1/4 of the physical memory. That will continue to be the case for a Java 8 container, even if we set a smaller memory limit:$ docker container run -it -m200M --entrypoint bash openjdk:8-jdk
root@c5a9d7b5e24f:/# java -XX:+PrintFlagsFinal -version | grep MaxHeapSize
uintx MaxHeapSize := 4137680896 {product}
openjdk version "1.8.0_181"
OpenJDK Runtime Environment (build 1.8.0_181-8u181-b13-2~deb9u1-b13)
OpenJDK 64-Bit Server VM (build 25.181-b13, mixed mode)
$ docker container run -it -m200M --entrypoint bash openjdk:10-jdk
root@37a3e007becb:/# java -XX:+PrintFlagsFinal -version | grep MaxHeapSize
   size_t MaxHeapSize                              = 104857600                                {product} {ergonomic}
openjdk version "10.0.2" 2018-07-17
OpenJDK Runtime Environment (build 10.0.2+13-Debian-2)
OpenJDK 64-Bit Server VM (build 10.0.2+13-Debian-2, mixed mode)
Effectively monitoring Java inside Docker is possible with Sysdig
To address the final issue of inconvenient monitoring with past versions of Java, we recommend using a container-aware monitoring solution when you update to Java 9 and 10. To illustrate, let’s create a Java container that will publish the ports to connect with the JVM (port 5000) and the web application (port 8080). We’ll define the environment variable “JAVA_TOOL_OPTIONS” with the desired parameters for the JVM:docker run --rm -p 8080:8080 -p 5000:5000 --name app -e JAVA_TOOL_OPTIONS="-Djava.rmi.server.hostname=0.0.0.0 -Dcom.sun.management.jmxremote -Dcom.sun.management.jmxremote.port=5000 -Dcom.sun.management.jmxremote.rmi.port=5000 -Dcom.sun.management.jmxremote.local.only=false -Dcom.sun.management.jmxremote.authenticate=false -Dcom.sun.management.jmxremote.ssl=false -XX:NativeMemoryTracking=summary" -e NMT_LEVEL_1="summary" tembleking/spring-boot-memory-blog
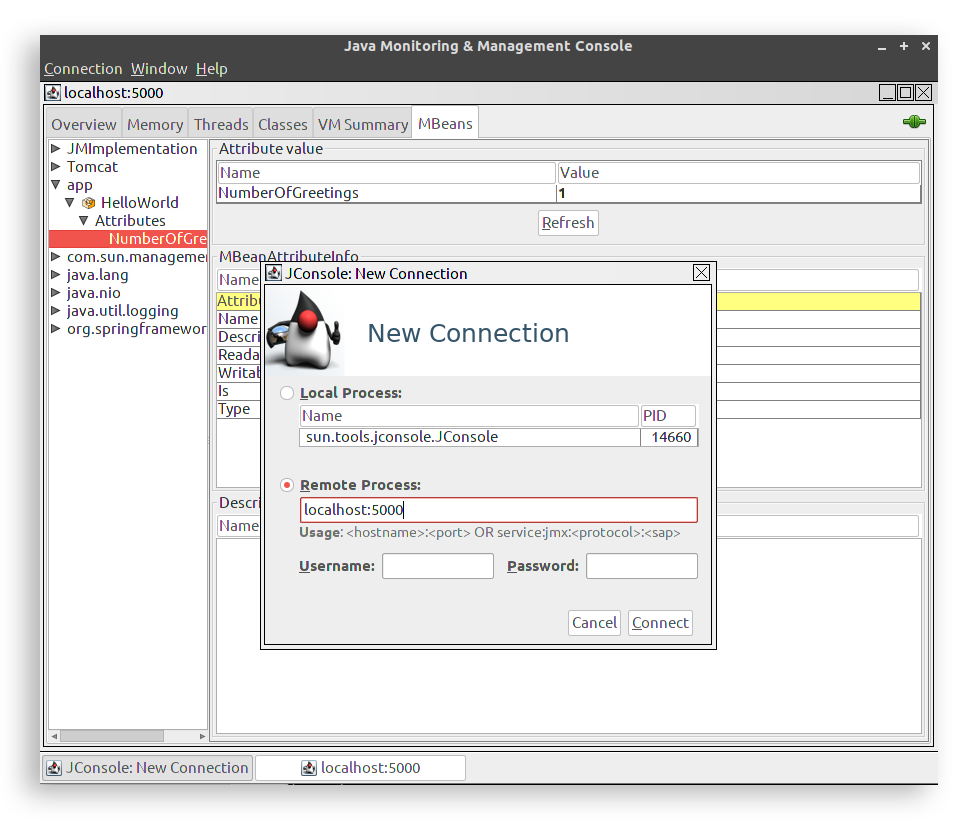 However, as you can see, passing the Java metric configuration parameters can be convoluted and difficult to scale using this process in the container world where new instances are being spawned and destroyed asynchronously.
But when you adopt Sysdig for monitoring Java, you’ll no longer need to configure the jmxremote network stack. Sysdig retrieves the metrics exposed by a container directly from the hosting OS and natively supports basic JRE and custom JMX metrics.
Let’s try a much simpler Docker invocation now:
However, as you can see, passing the Java metric configuration parameters can be convoluted and difficult to scale using this process in the container world where new instances are being spawned and destroyed asynchronously.
But when you adopt Sysdig for monitoring Java, you’ll no longer need to configure the jmxremote network stack. Sysdig retrieves the metrics exposed by a container directly from the hosting OS and natively supports basic JRE and custom JMX metrics.
Let’s try a much simpler Docker invocation now:
docker run -d -P tembleking/spring-boot-memory-blog
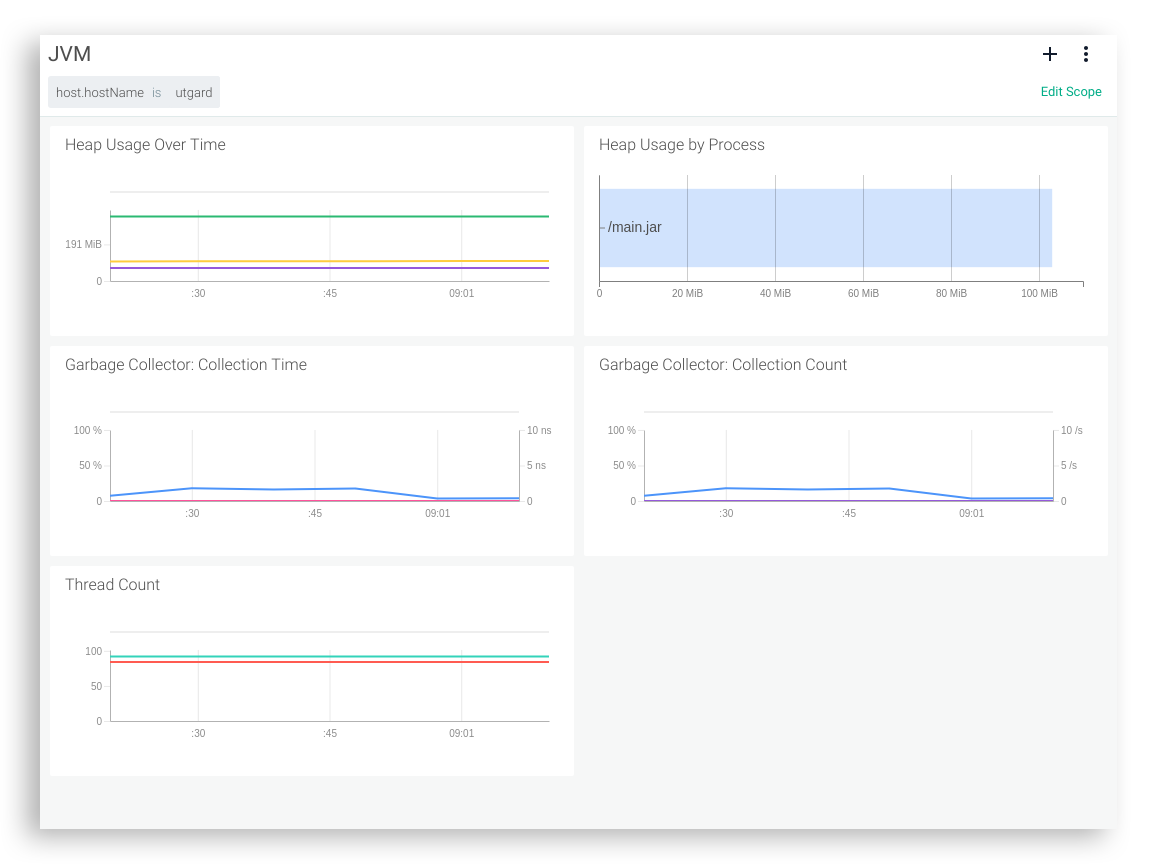
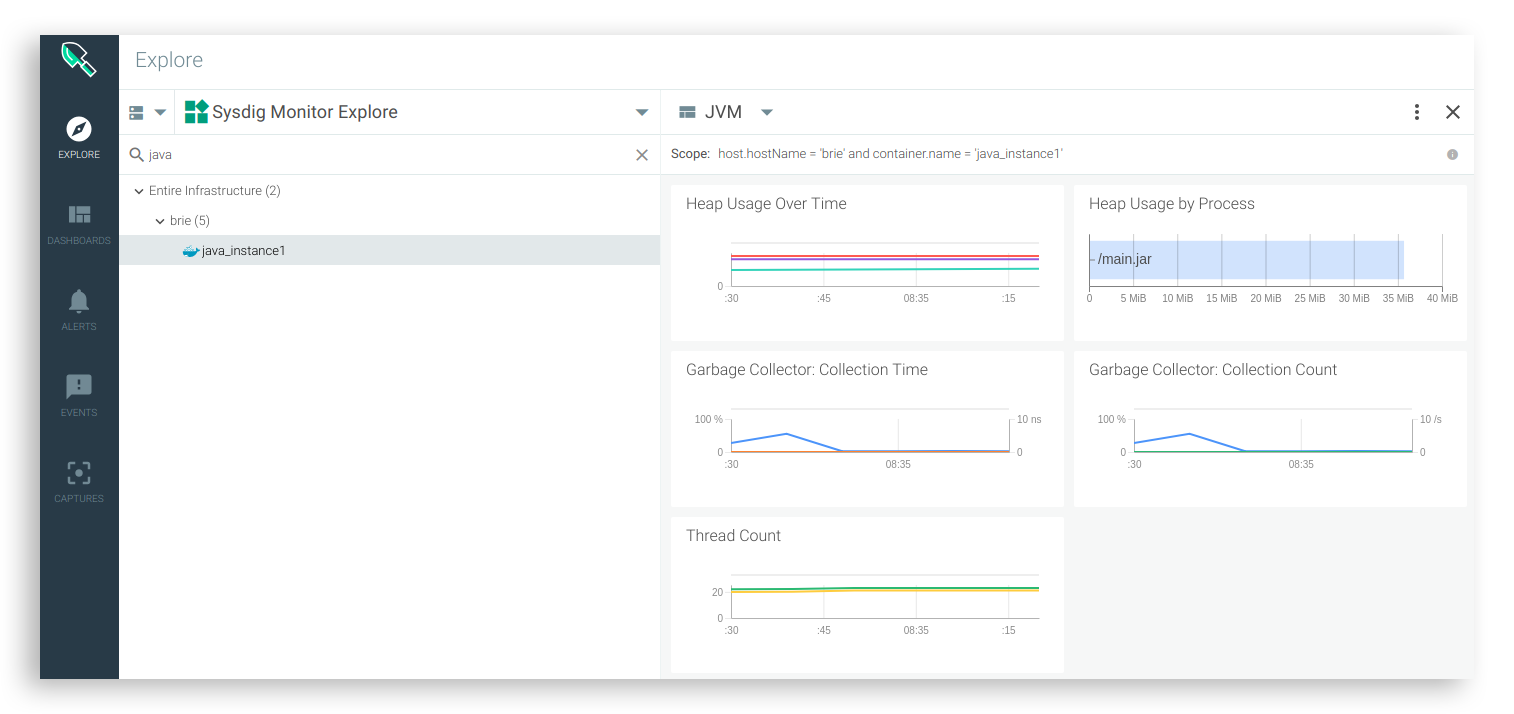 There’s no need to configure network connectivity or instrument the application, Sysdig detects the JVM running inside the container right out of the box.
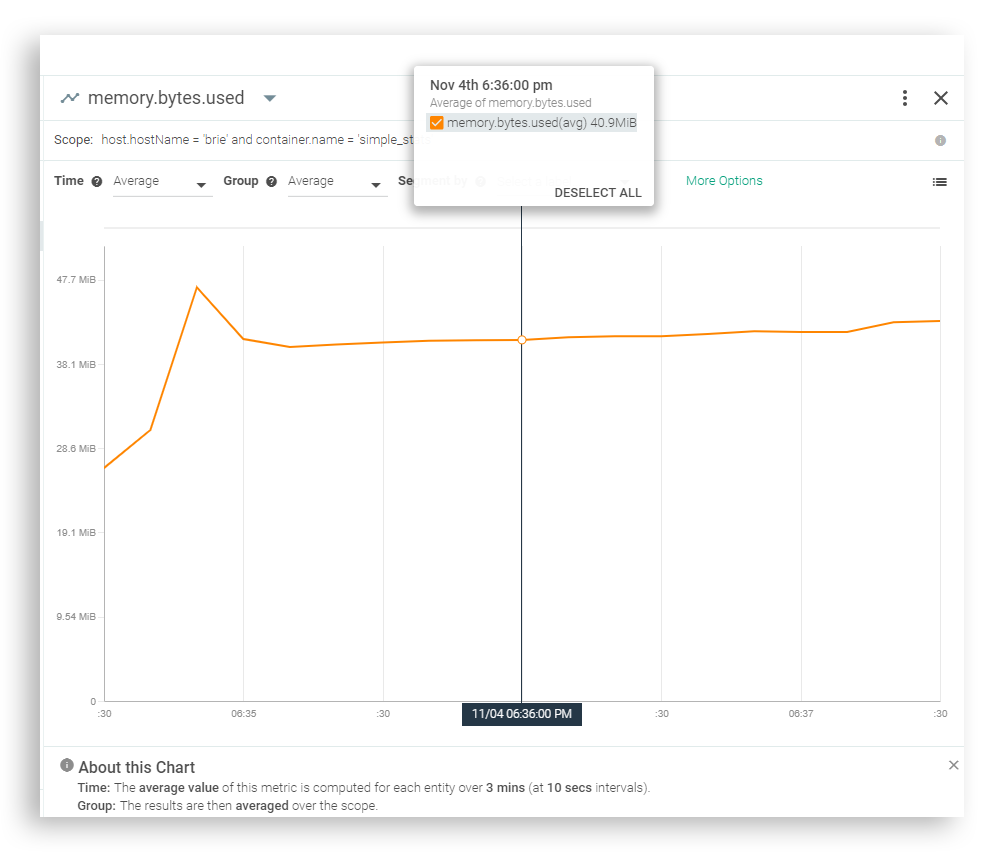
Now you can spawn a handful of identical Java containers by simply repeating the above command a few times to explore the average…
There’s no need to configure network connectivity or instrument the application, Sysdig detects the JVM running inside the container right out of the box.
Now you can spawn a handful of identical Java containers by simply repeating the above command a few times to explore the average…
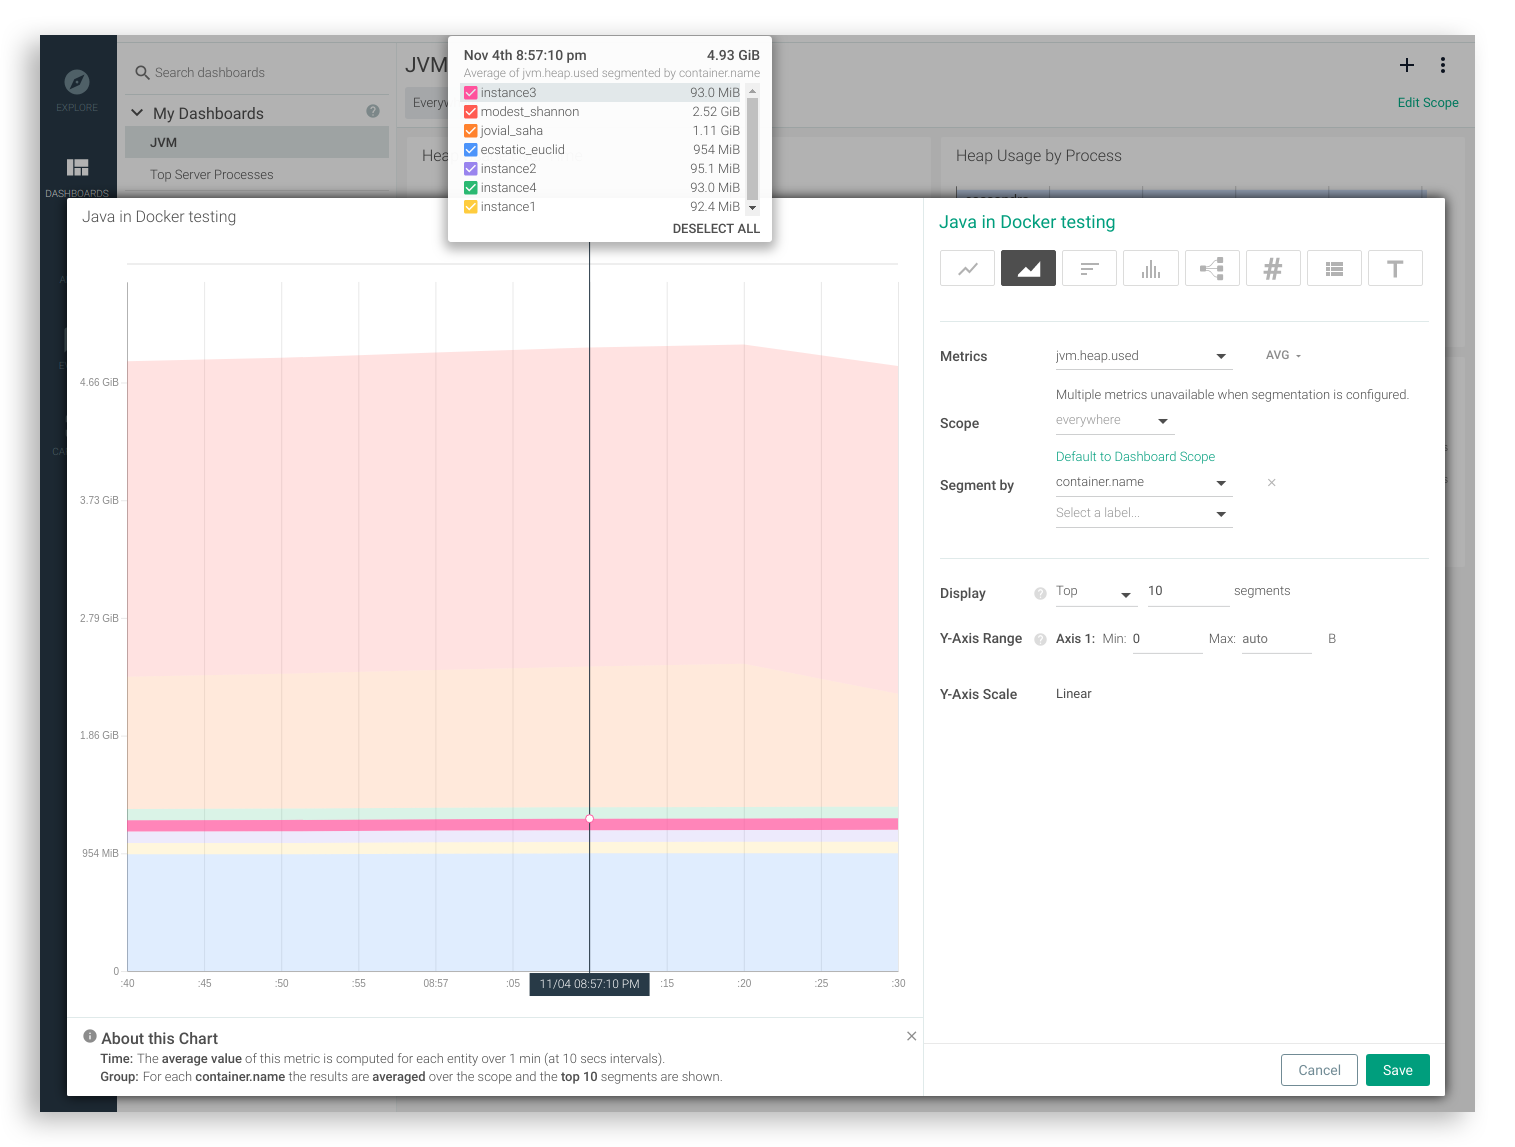
 or to watch a specific metric segmented by container.name: