Send your metrics to a Prometheus Remote Write endpoint without Prometheus – OpenTelemetry


Falco Feeds extends the power of Falco by giving open source-focused companies access to expert-written rules that are continuously updated as new threats are discovered.

Prometheus remote write is a great feature that allows the sending of metrics from almost any device to a Prometheus server. Just install a service Prometheus instance in the device, enable remote_write, and you're good to go!
Sometimes, however, you don't need to completely instrumentalize your application, or you just need to send some custom metrics. In that case, you can use OpenTelemetry instead of Prometheus.
What is OpenTelemetry
OpenTelemetry is a set of SDKs, APIs, tools, and integration that provides a vendor-agnostic implementation for managing traces, metrics, and logs supporting open-source projects like Jaeger and Prometheus.
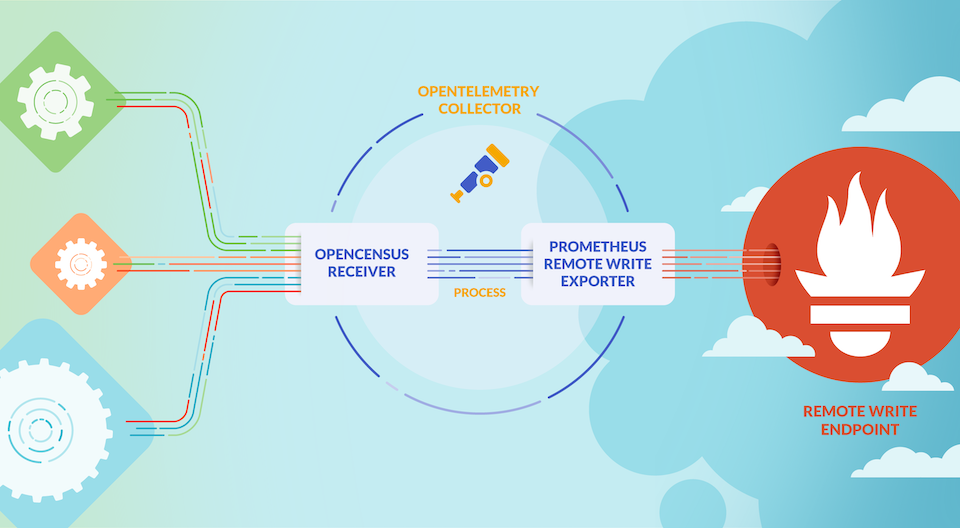
The OpenTelemetry Collector provides a standard and agnostic way to receive, process, and export data. It allows users to create a simple scenario for pushing metrics to any external Prometheus server with remote_write enabled, without managing a Prometheus server.
All your batch jobs could send their metrics to this service immediately to Prometheus Remote Write instead.
Configure OpenTelemetry Collector
You can use the OpenTelemetry Collector exporter for Prometheus Remote Write for this purpose.
The OpenTelemetry Collector needs to be configured with:
A receiver
Configure the OpenTelemetry Collector Receiver for OpenCensus. This would enable an endpoint where you can directly push metrics with the OpenCensus Metric Format.
An exporter
Exporter for your Prometheus remote write endpoint and the necessary environment variables for connecting with it – for example, an authorization header with the Bearer Token.
A service
OpenTelemetry requires you to enable any process via Service Pipelines, where receivers and exporters are connected.
This process has the following steps:
- Batch jobs push metrics to OpenTelemetry Collector with OpenCensus Metric Format.
- OpenTelemetry adds any external labels you have configured in the Prometheus Remote Write Exporter.
- OpenTelemetry Collector sends metric(s) to the Remote Write backend.
To configure a Bearer Token, you can use a secret mounted as an environment variable in your Deployment.
OpenTelemetry Collector just requires a Kubernetes Deployment with the application definition, a Service for communicating with this application, and a ConfigMap where we configure our process.
You can find the latest release of OpenTelemetry Collector here, and the latest Docker Image available.
Deploy OpenTelemetry Collector in your Cluster
This is how you can deploy the OpenTelemetry collector with a Kubernetes Deployment, a Service, and a ConfigMap. You can also use the OpenTelemetry Operator to run the Collector.
Deployment
Deploy the Collector with one replica by using a Kubernetes Deployment. In this case, we are using the latest available version. Check all available image versions for the otel/opentelemetry-collector in DockerHub.
If you need to authenticate to the Prometheus remote write endpoint, you'll need to create a secret:
kubectl create secret generic remote-write-api-token --from-literal=remote-write-api-token="Remote Write Token”And add it to the configuration:
       env:
       - name: BEARER_TOKEN
         valueFrom:
           secretKeyRef:
             name: remote-write-api-token
             key: remote-write-api-token
Service
For our purpose, we only define the OpenCensus port for pushing metrics to OpenTelemetry Collector. You can find OpenTelemetry Collector default ports for other receivers and exporters.
ConfigMap
Configure the Collector exporter with the prometheusremotewrite type. Add the BEARER_TOKEN variable in the Deployment if needed. In this example, we are also including an extra label that the OpenTelemetry collector will include in all of its metrics.
# otel-cm.yaml
apiVersion: v1
kind: ConfigMap
metadata:
 labels:
   app: opentelemetry
   component: otel-collector-conf
 name: otel-collector-conf
data:
 otel-collector-config: |
   receivers:
     opencensus:
   processors:
     batch:
   exporters:
     prometheusremotewrite:
       endpoint: "https://remote-endpoint/prometheus/remote/write"
       headers:
         Authorization: "Bearer ${BEARER_TOKEN}"
       external_labels:
         server: otel
   service:
     extensions: [health_check]
     pipelines:
       metrics:
         receivers: [opencensus]
         processors: [batch]
         exporters: [prometheusremotewrite]
If you're deploying this in a Kubernetes cluster, you'll need to apply all the configurations in its own namespace.
Send Metrics to OpenTelemetry
This is the OpenCensus metrics format that your jobs will need to use to send the metrics into OpenTelemetry. You can send multiple metrics with one query and with the desired labels.
{
   "node": {
     "identifier": {
       "host_name": "HOSTNAME",
       "pid": 123,
       "start_timestamp": "TIMESTAMP"
     }
   },
   "metrics": [
     {
       "metric_descriptor": {
         "name": "my_custom_metric",
         "description": "Build has been correctly executed",
         "unit": "1",
         "type": "GAUGE_INT64",
         "label_keys": [
           {
             "key": "environment",
             "description": "Representing the environment"
           },
           {
               "key": "kernel",
               "description": "Kernel version"
             }
         ]
       },
       "timeseries": [
         {
           "start_timestamp": "TIMESTAMP",
           "label_values": [
             {
               "value": "ENVIRONMENT",
               "has_value": true
             },
             {
               "value": "KERNEL",
               "has_value": true
             }
           ],
           "points": [
             {
               "timestamp": "TIMESTAMP",
               "int64_value": "VALUE"
             }
           ]
         }
       ]
     }
   ]
 }
One Metric can be sent every minute by using the previous Metric template in a bash script – for example, when your batch job is finished, introducing one RANDOM number.
#!/bin/bash

...my custom batch job...

query=`cat query-body-example-template.json`
value=$((1 + $RANDOM % 10))
hostname=`hostname`
timestamp=`date -u +%FT%TZ`
kernel=`uname -r`

query=$(sed -e "s/HOSTNAME/$hostname/g" -e "s/TIMESTAMP/$timestamp/g" -e "s/ENVIRONMENT/dev/g" -e "s/KERNEL/$kernel/g" -e "s/VALUE/$value/g" <<< $query)

curl -H "Content-Type: application/json" -XPOST :55678/v1/metrics --data "$query"
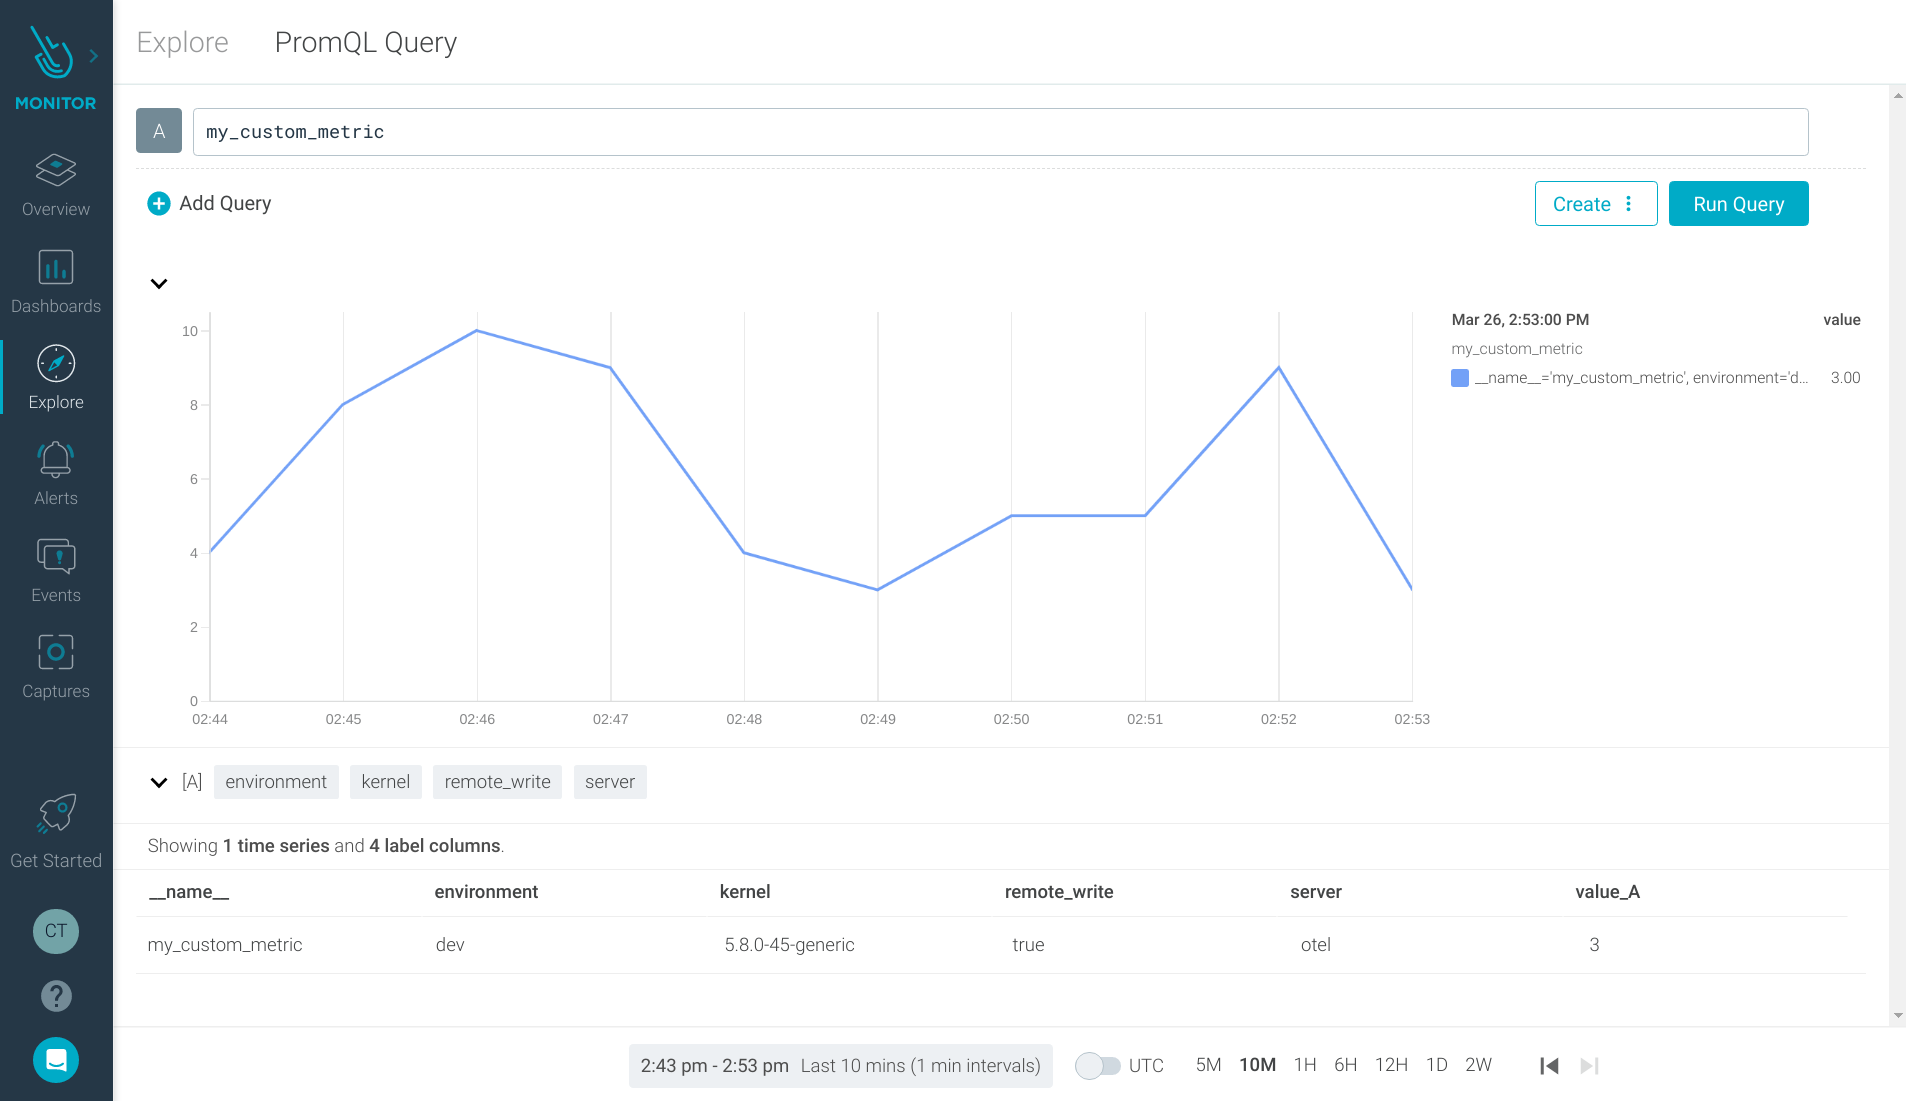
With the OpenTelemetry configuration you will see your metric:
If you prefer to send the metric directly by using curl, you can perform the following query:
curl -H "Content-Type: application/json" <otel-collector-url>:55678/v1/metrics --data "$query"Where $query is the content from the previous JSON.
Putting it all together
In this article, you've learned how OpenTelemetry can be a great solution to send metrics to a Prometheus remote write endpoint, without needing to install and configure a service Prometheus instance.
This is a fast and simple way of monitoring your business batch processes.
This is even easier with Sysdig's Prometheus-managed platform. Sign up in a few minutes and instantly push your metrics to our Prometheus remote write compatible endpoint!