
In this blog, you will learn how monitoring data from your Kubernetes environments can be used to detect indicators of a compromise in Kubernetes.
Securing Kubernetes is challenging: Configuration flexibility, large clusters, ephemeral containers, and an ever-growing services ecosystem produce complex environments that open up your attack surface. Adversaries get an advantage because complexity is a natural enemy of security. You not only have to watch for misconfigurations that can facilitate attacks, but also for anomalous activity that hides behind the complexity.
 Organizations typically have separate tools for Kubernetes security and monitoring that often don’t talk to each other, resulting in siloed data that can leave your environment exposed. Ironically, monitoring systems often detect the early signs of a malicious attack as they are continuously monitoring various metrics and events. In order to be on top of indicators of compromise and respond quickly to security issues, it is important that security teams also have access to monitoring data.
Let’s review the different types of monitoring alerts that serve as Indicators of Compromise (IoC) in Kubernetes environments that you should watch out for.
Organizations typically have separate tools for Kubernetes security and monitoring that often don’t talk to each other, resulting in siloed data that can leave your environment exposed. Ironically, monitoring systems often detect the early signs of a malicious attack as they are continuously monitoring various metrics and events. In order to be on top of indicators of compromise and respond quickly to security issues, it is important that security teams also have access to monitoring data.
Let’s review the different types of monitoring alerts that serve as Indicators of Compromise (IoC) in Kubernetes environments that you should watch out for.
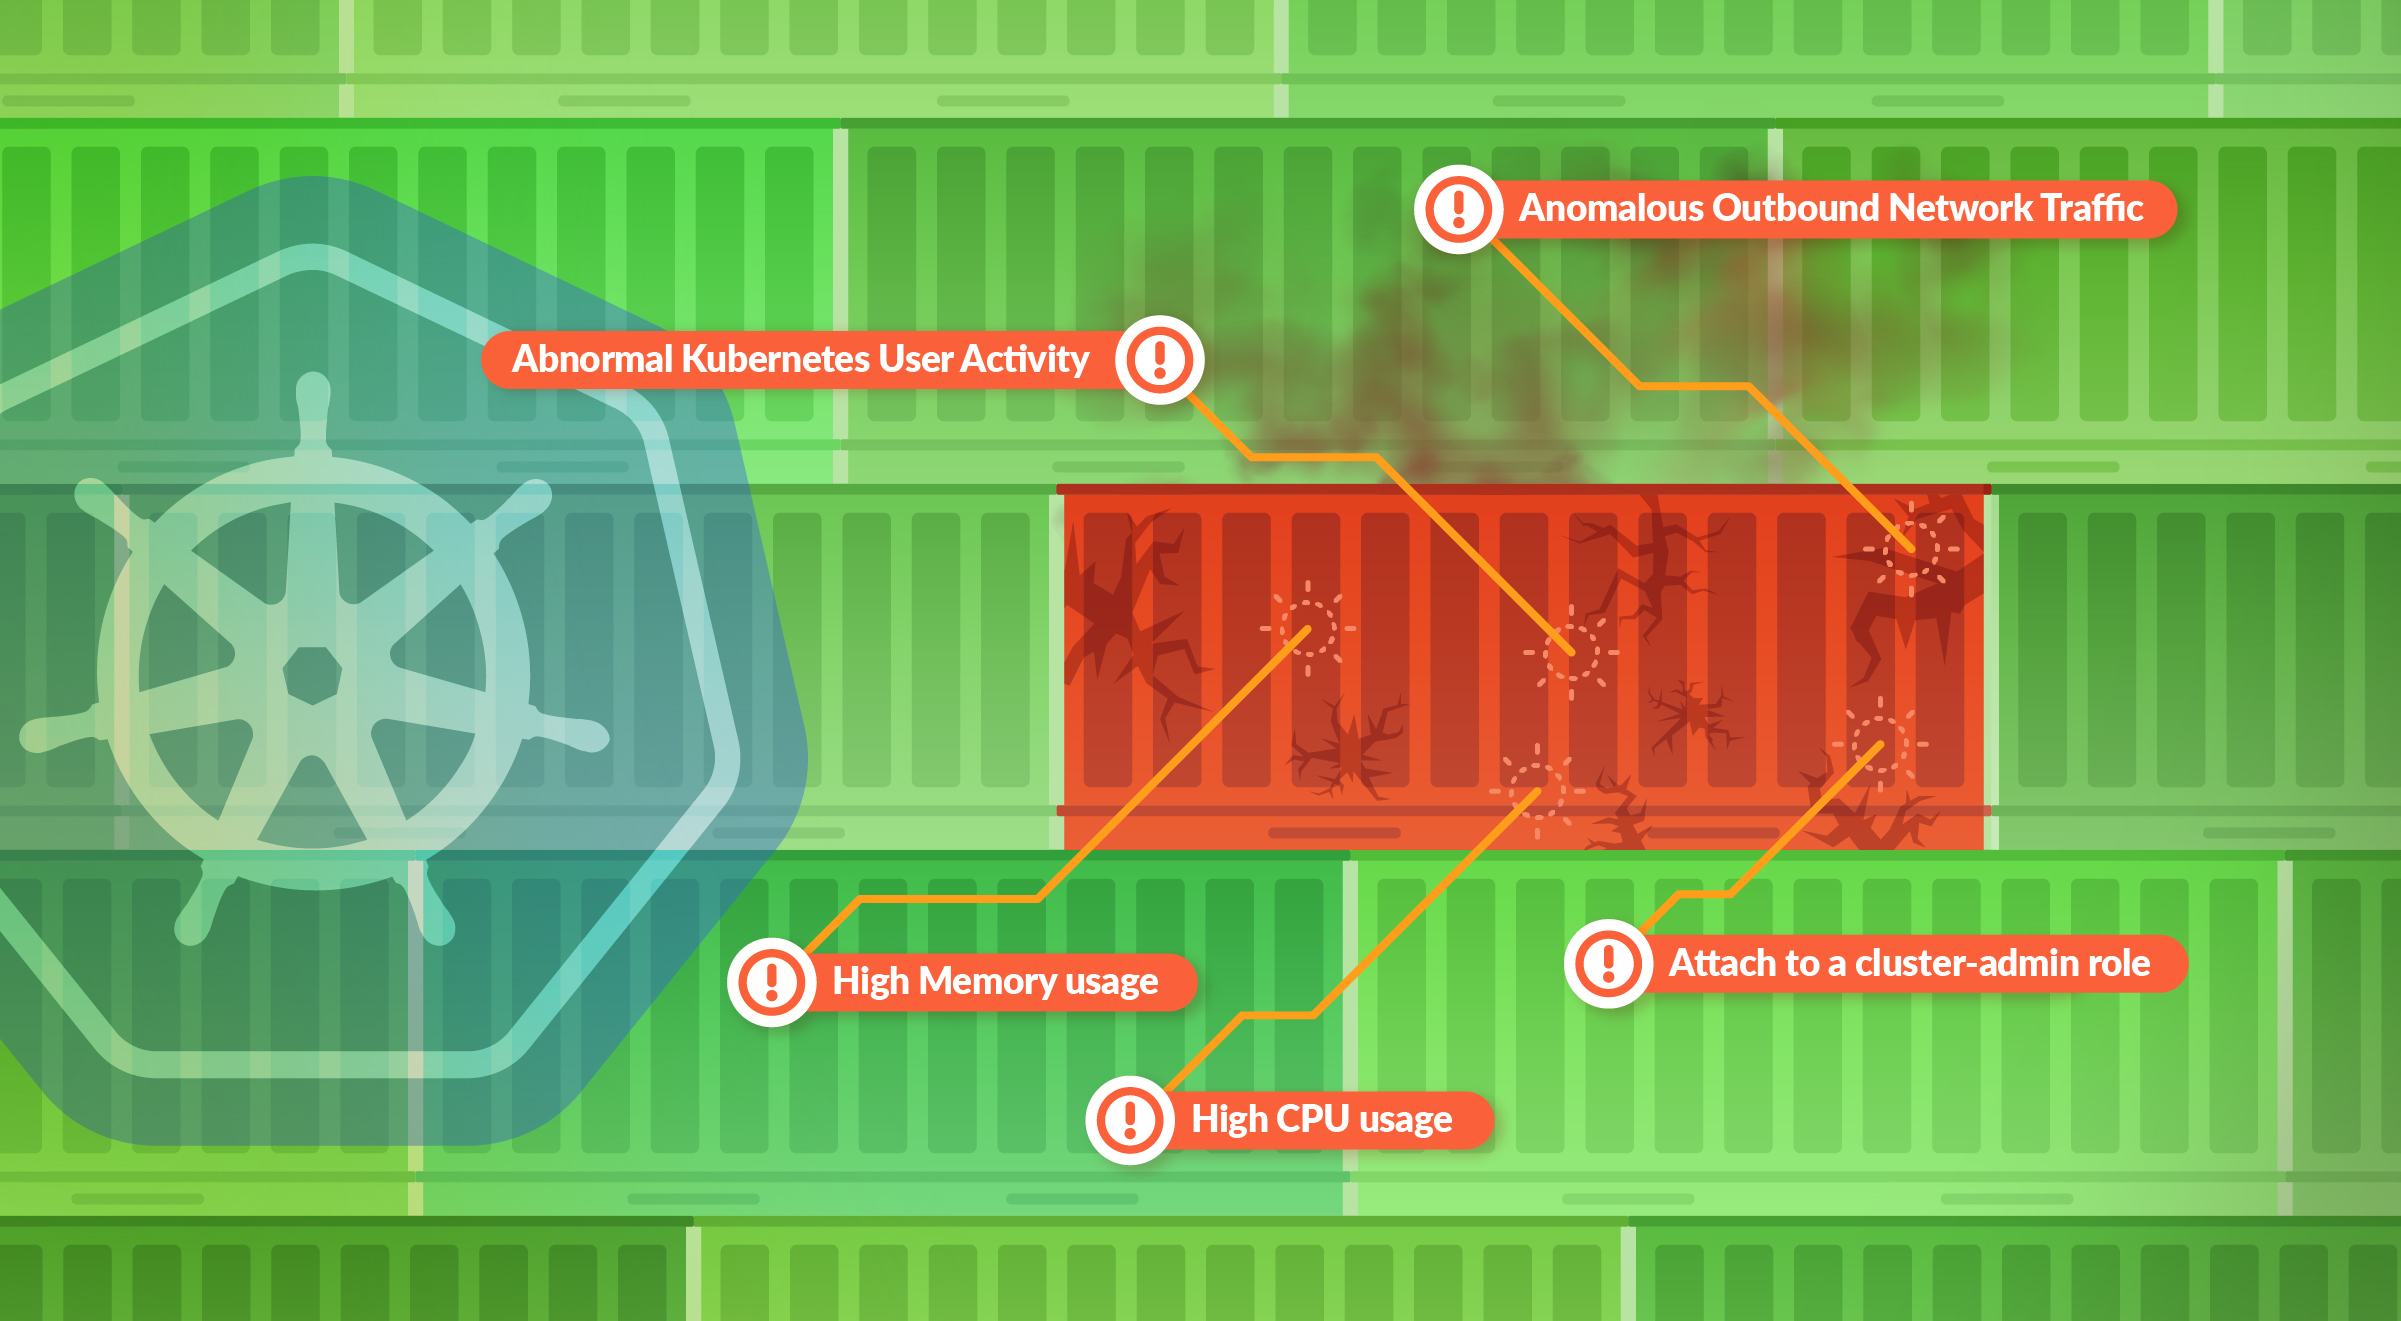
Kubernetes indicators of compromise
These top 10 Indicators of Compromise were put together by analyzing how Sysdig’s customers monitor their Kubernetes deployments, and the types of Kubernetes metrics they monitor that could have security implications. We also observed how they use Sysdig as their Kubernetes security tool to detect runtime threats and alert on abnormal activities which could be IoCs.1. Container memory/CPU spike
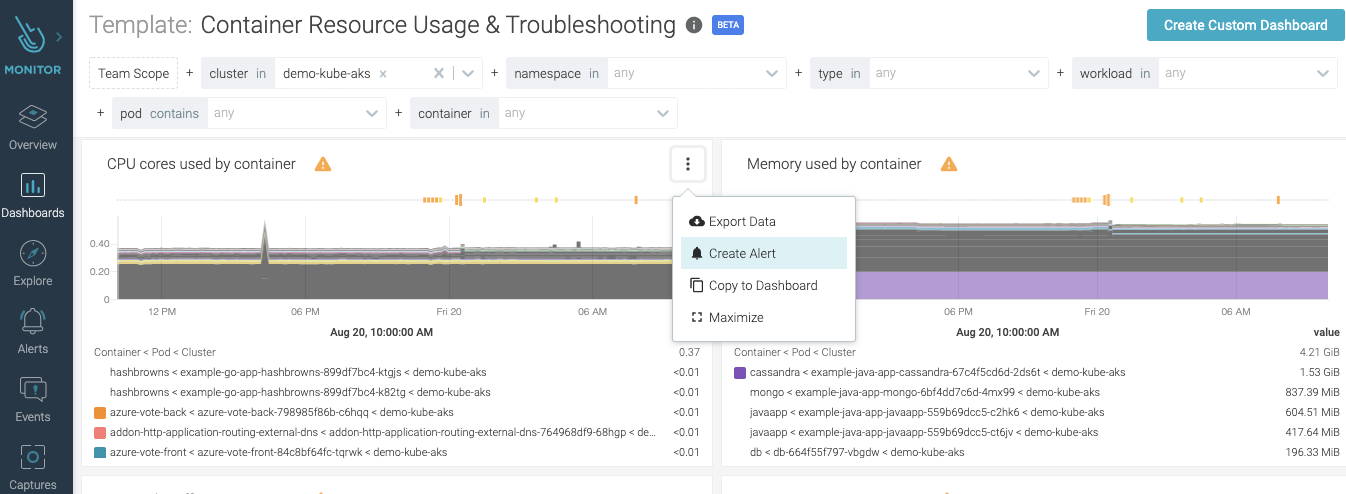
Container memory and/or CPU spike is a notoriously common early symptom for resource hijacking. Resource hijacking is when an attacker gets access to your computing resources and performs malicious activity that is very resource intensive, the most common being cryptocurrency mining. Cryptocurrencies, like Bitcoin, Ethereum, etc., use resource intensive computations to validate transactions on the network. For an attacker, the ideal environment would be in an unsuspecting Kubernetes cluster where they can easily spin up several containers to do the job. The following PromQL query will provide the CPU usage for each workload:sum (rate (container_cpu_usage_seconds_total{container=~".+"}[1w]))
by (container) / ignoring (container) group_left
sum( machine_cpu_cores{}) * 100
That being said, CPU/memory spikes are not the only sign of cryptomining. Cryptominers can also kill your existing processes if they start to compete for resources. For greater confidence, you could verify the presence of process kill events to know you are experiencing a compromise.
For an example on how a crypto currency attack works, and how to detect it, check our “Crypto miner attack – Sysrv-Hello Botnet targeting WordPress pods” article.
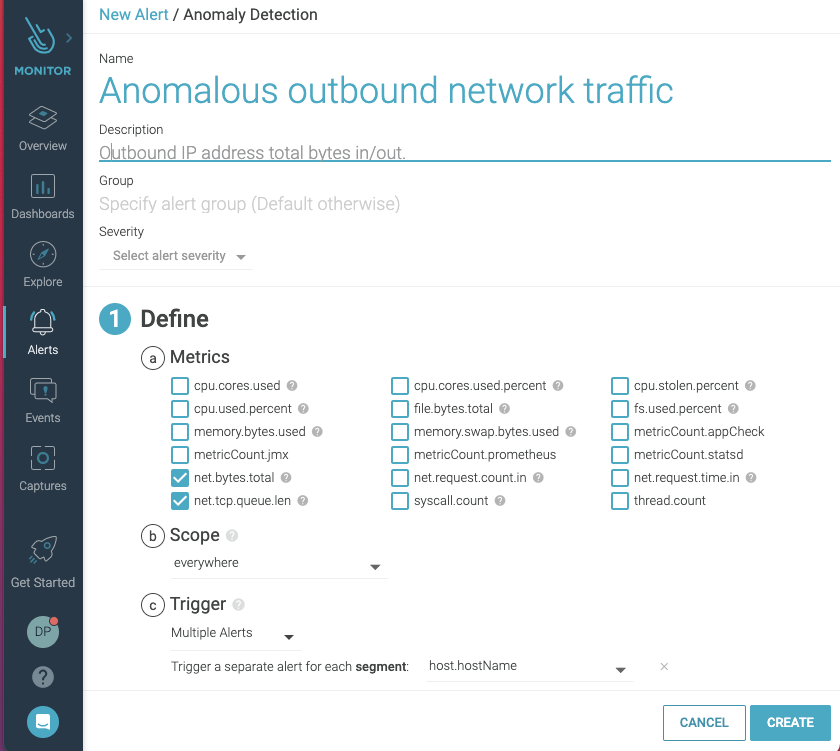
2. Anomalous outbound network traffic
Unusual outbound network traffic represents an anomaly. It is a commonly monitored Kubernetes metric and could be an indicator of compromise uncovering – for instance, an exfiltration or a compromised host used as a zombie in a botnet. Detecting anomalous connections in Kubernetes is complicated, since keeping track of who is talking to who (and why) is much harder with distributed containerized services. Your tool needs to be able to discover containers, hosts, Kubernetes nodes, services, and processes in full context (e.g., namespace, deployment, pod, process), and create a real-time topology map that will give visibility into all network connections in and out of a particular pod or service: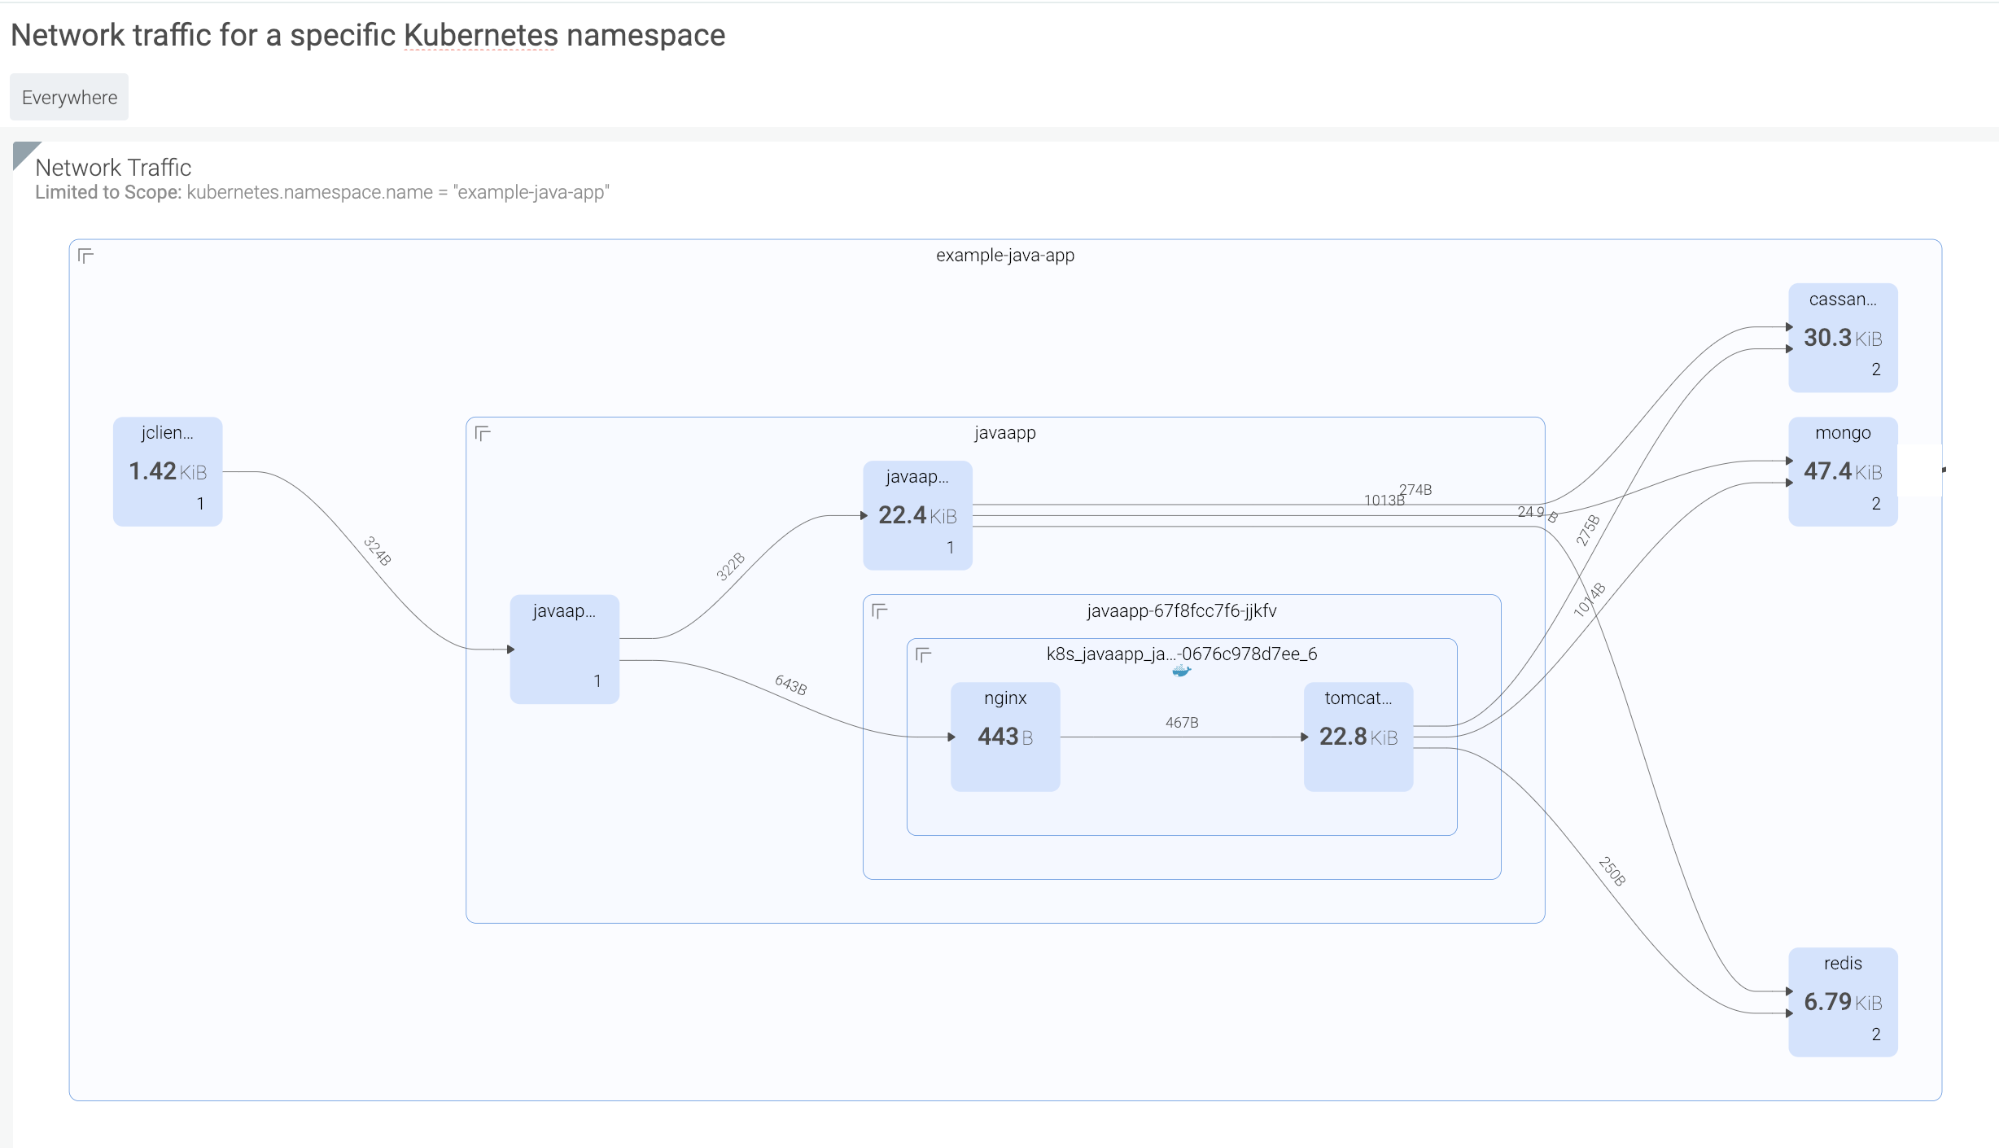 Then, detecting anomalous traffic can be done by monitoring connections made by a given service to a specific outbound IP address, and observing the total bytes in/out.
3. Attach to a cluster-admin role
Attackers can take certain actions, like attaching to a cluster-admin role to conduct privilege escalation inside your cluster. In Kubernetes, a well-orchestrated attack usually starts with some level of privilege escalation (e.g., Tesla, WeightWatchers security incidents in 2018) and is followed by execution of commands or lateral movement through the network. One way to catch this indicator of compromise is to have a topology map that shows the average of all images running with a root user across your multiple kubernetes clusters, either on-prem or in the cloud. These are potential points of privilege escalation.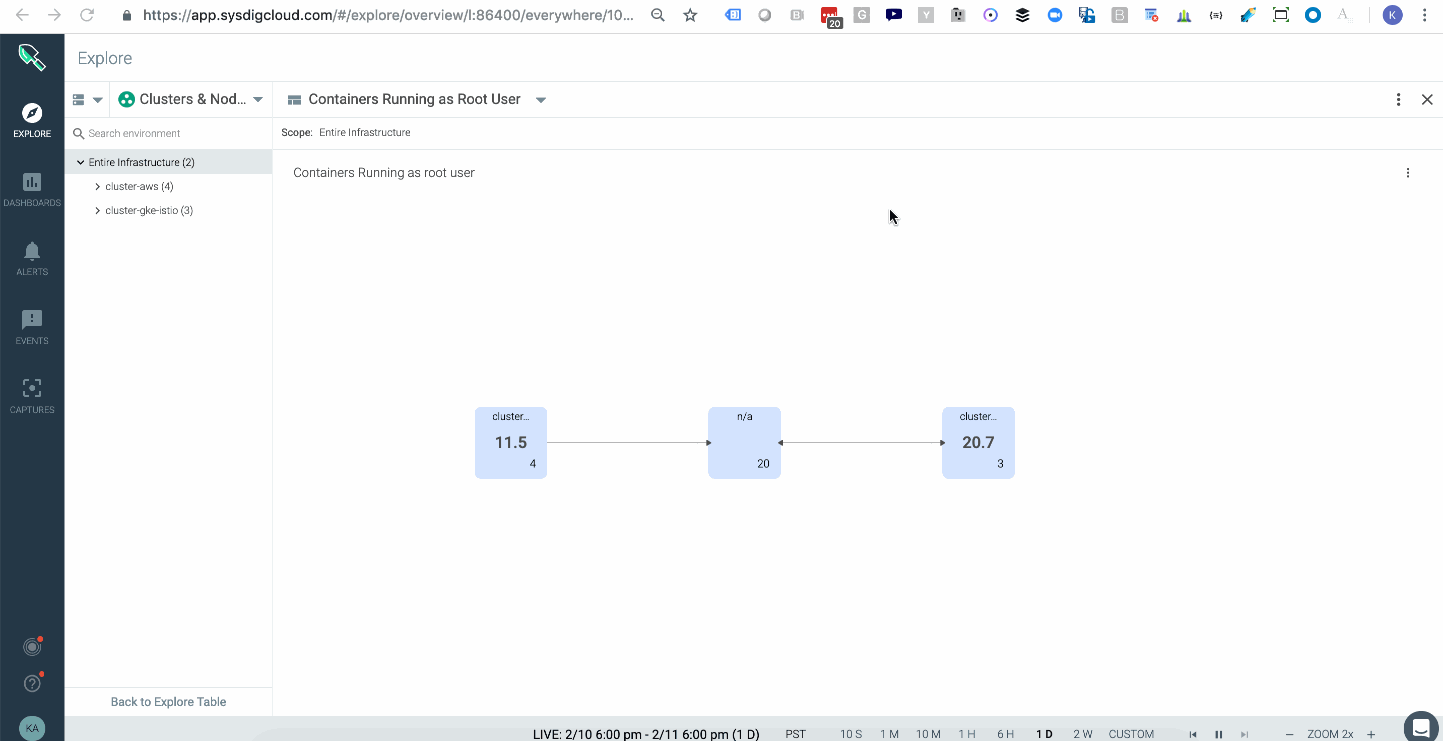 In addition, having policy rules to alert you when privileged containers launched will further hone your detection capabilities.
4. Abnormal Kubernetes user activity
Abnormal user activity can also reveal an attacker in action and be an early sign of an indicator of compromise. Although a specific user activity could be a legitimate action, like an administrator opening a shell in a container to perform troubleshooting, any interactive user activity is suspicious. Interactive user activity is an anti-pattern and may indicate that something malicious is going on. Checking the course of actions and verifying if they fall into any observed adversary behavior path can provide higher confidence of an attack, and avoid false positives. For instance, auditing unusual account behavior and monitoring pods accessed, commands run, and connections made over a specific period can provide a clearer indication of a breach. Observing abnormal activity applies to insider attacks, as well as account takeover. Using a security tool with visibility into system activities, such as user commands including the command arguments, pid, directory, etc., which correlates them with akubectl user session, you will be able to detect anomalous behavior. For a zero-trust approach, make use of fine-grained runtime detection that allows the building of very tight lists of expected activity, flagging anything outside the list. That can provide protection from known and unknown attack profiles.
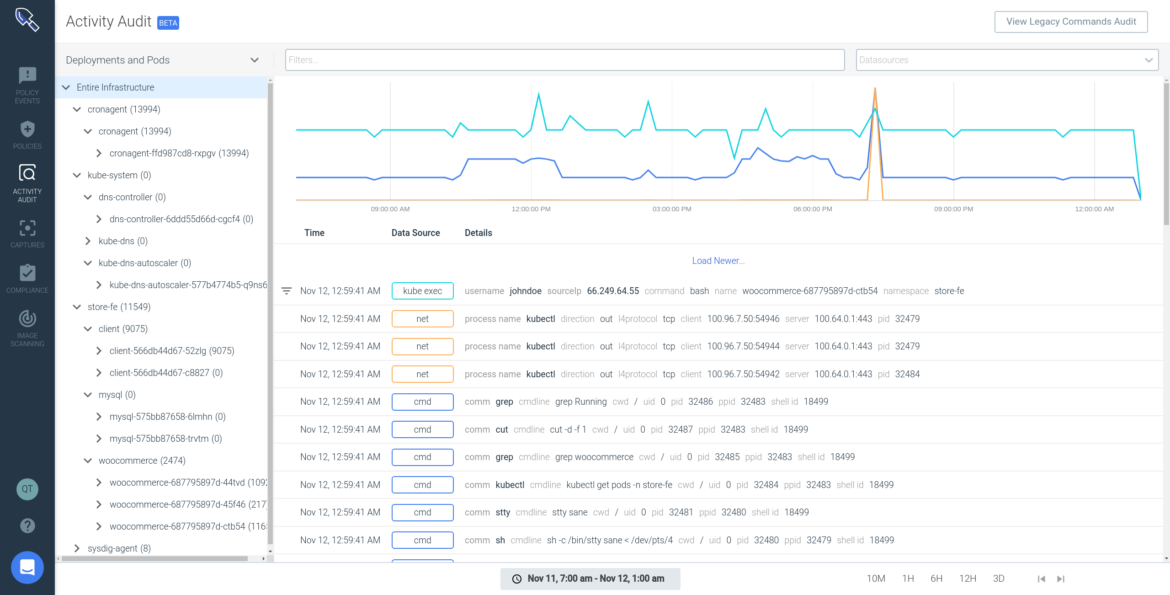 Another important thing to keep in mind is that adversaries usually try to cover traces of their presence and actions by killing the container. Make sure that your tool keeps an activity audit even after the container is gone.
5. Abnormal inbound traffic
An abnormal amount of inbound traffic tied to a Denial of Service (DoS) attack can be another indicator of compromise to watch out for. In Kubernetes environments, a DoS attack on the API Server would lead to the server not being able to handle requests or have poor performance. One typical DoS attack generates a huge amount of requests to consume all the process capacity of the server (e.g., SYN flooding). So, an important indicator to detect Kubernetes API server attacks is abnormal inbound traffic. The Kubernetes API server inbound traffic size is dependent on your cluster size and the workload. So, you should see an inbound traffic hike, for example, when a mass deployment happens. Nonetheless, out of these unique situations, it is necessary to monitor your Kubernetes API server traffic status, identifying specific services with a traffic spike. Make sure that you can monitor Kubernetes API server inbound traffic size posture and easily get details such as container name and specific threshold crossed. For more details, read “Detecting the Kubernetes API server DoS vulnerability (CVE-2019-1002100).”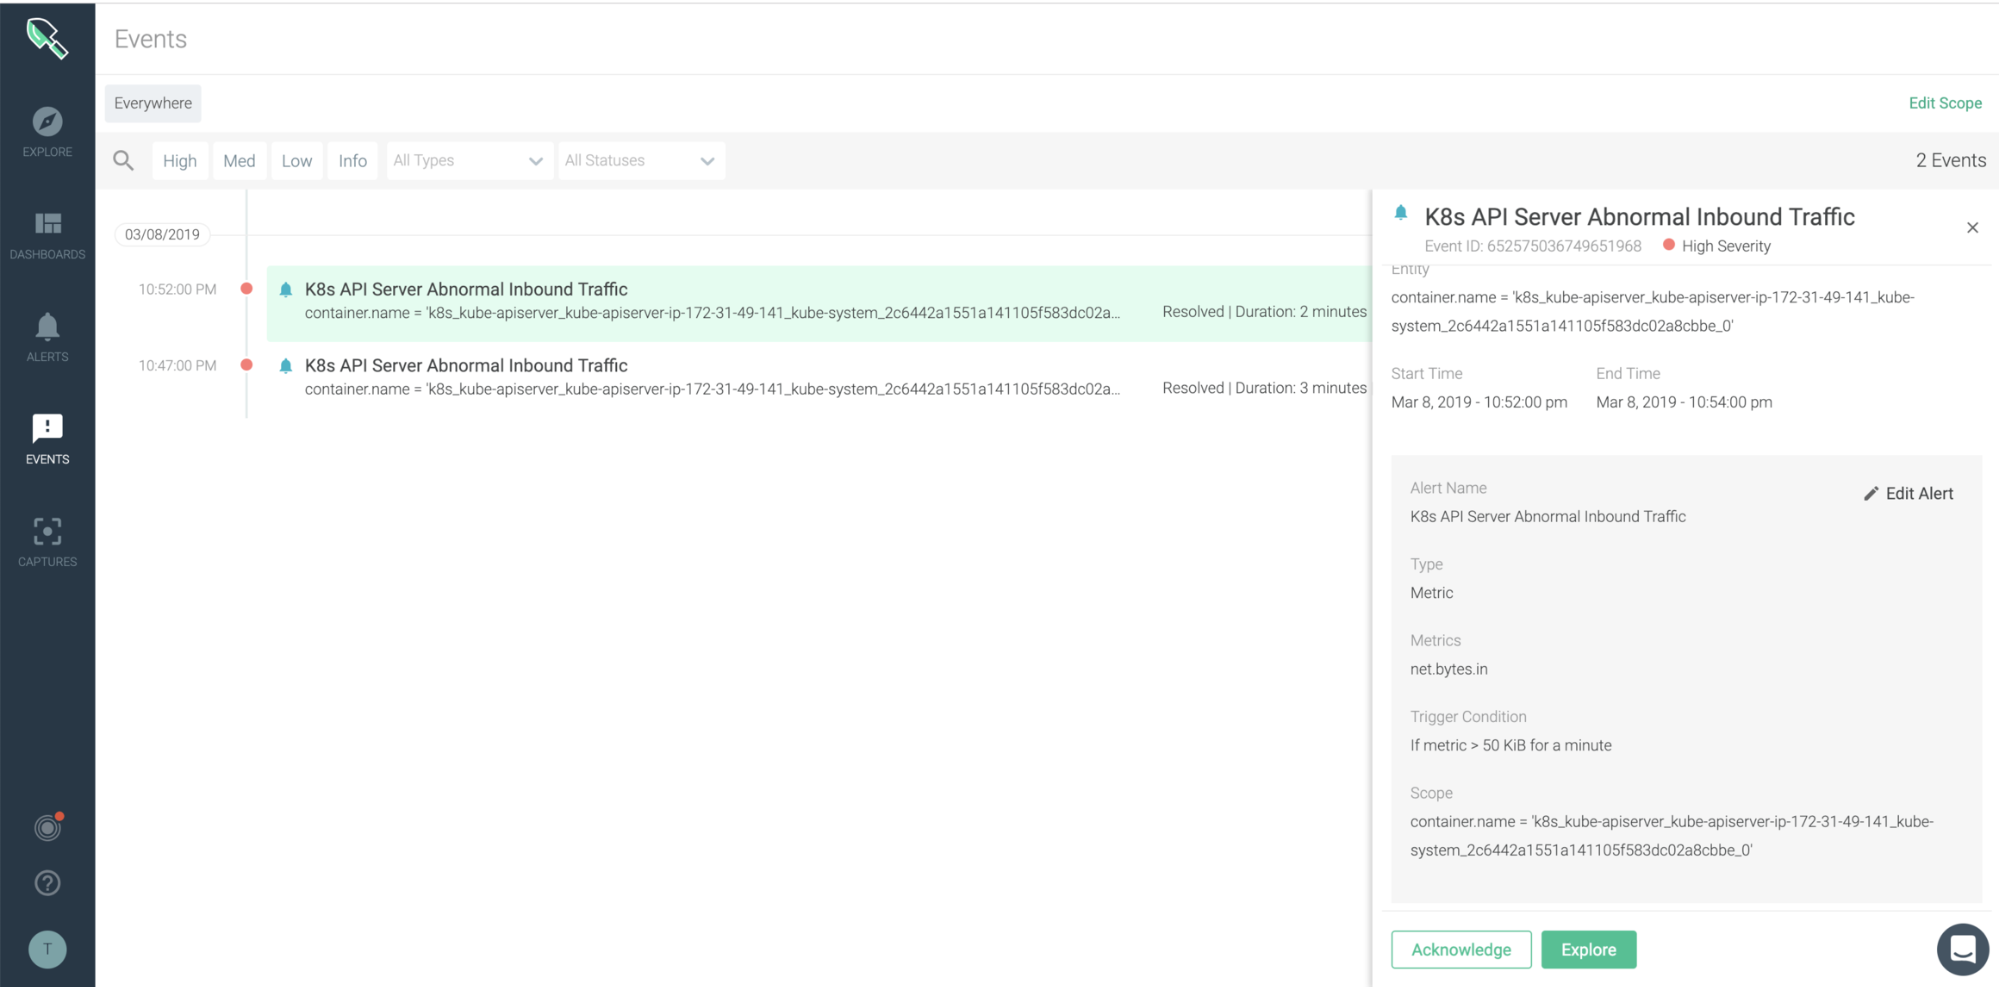
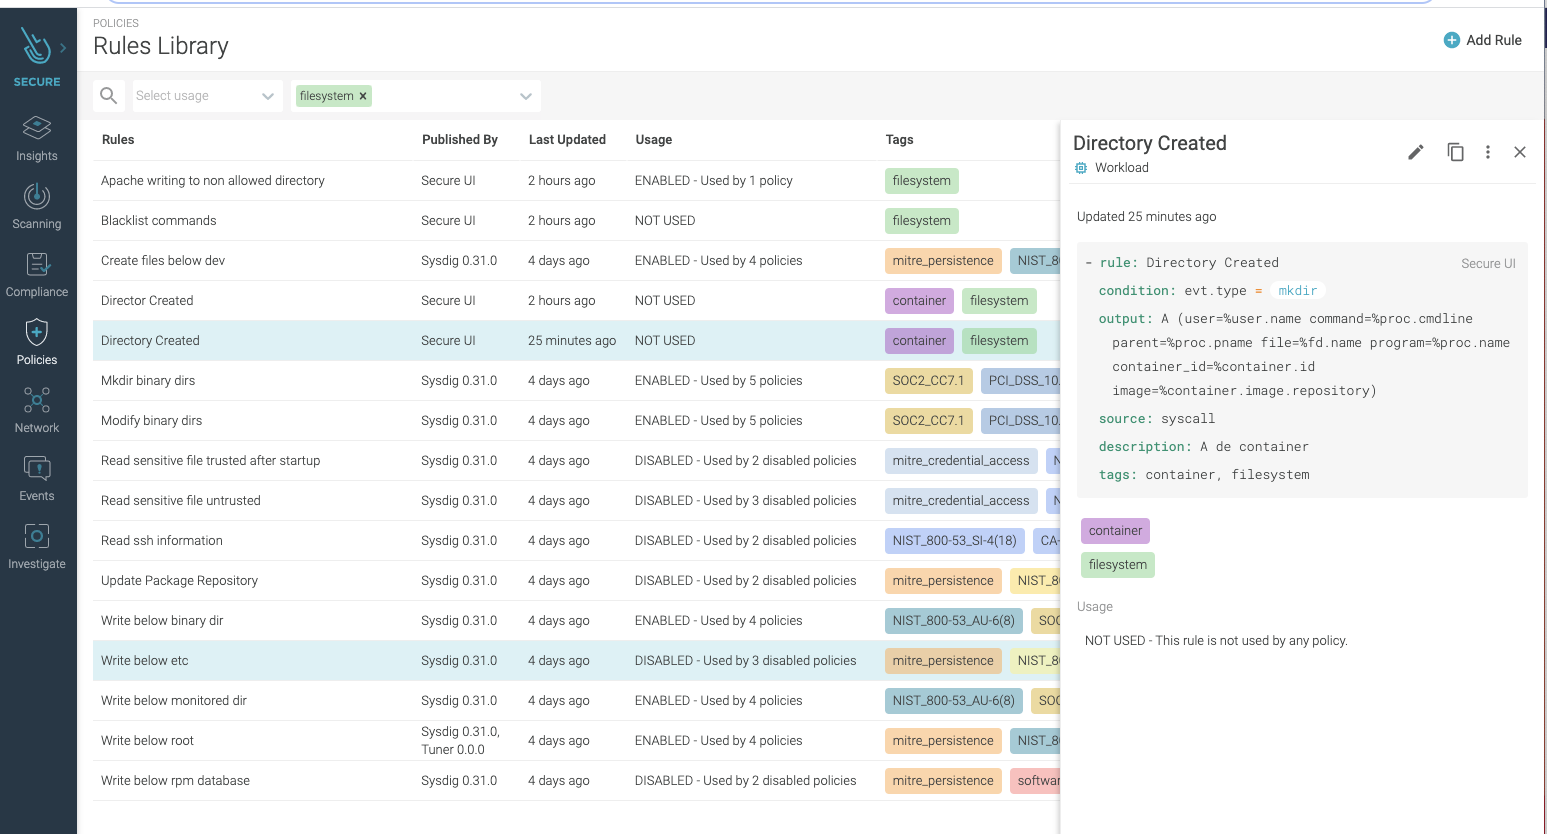
6. Unexpected changes in file system or directory (FIM)
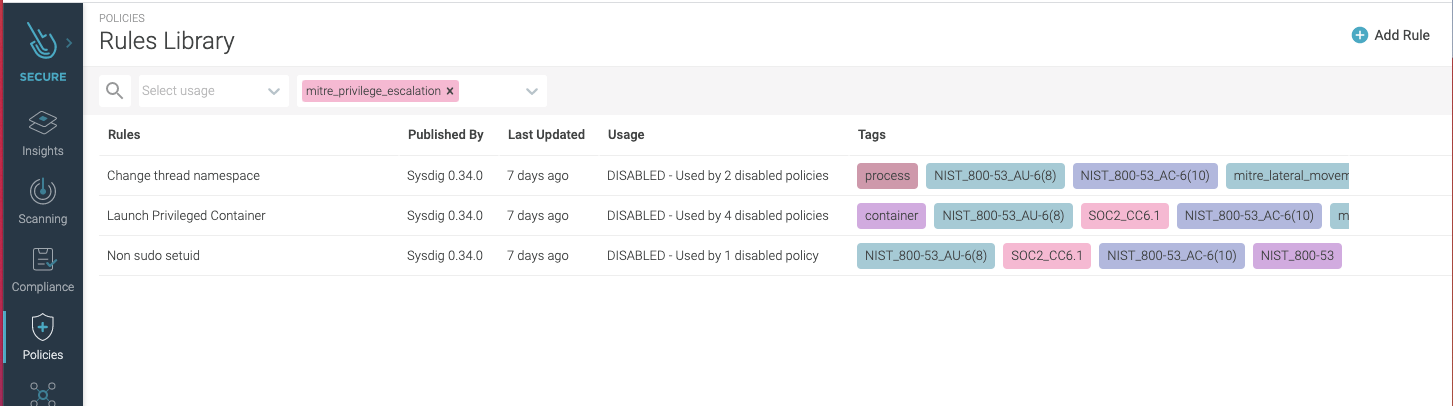
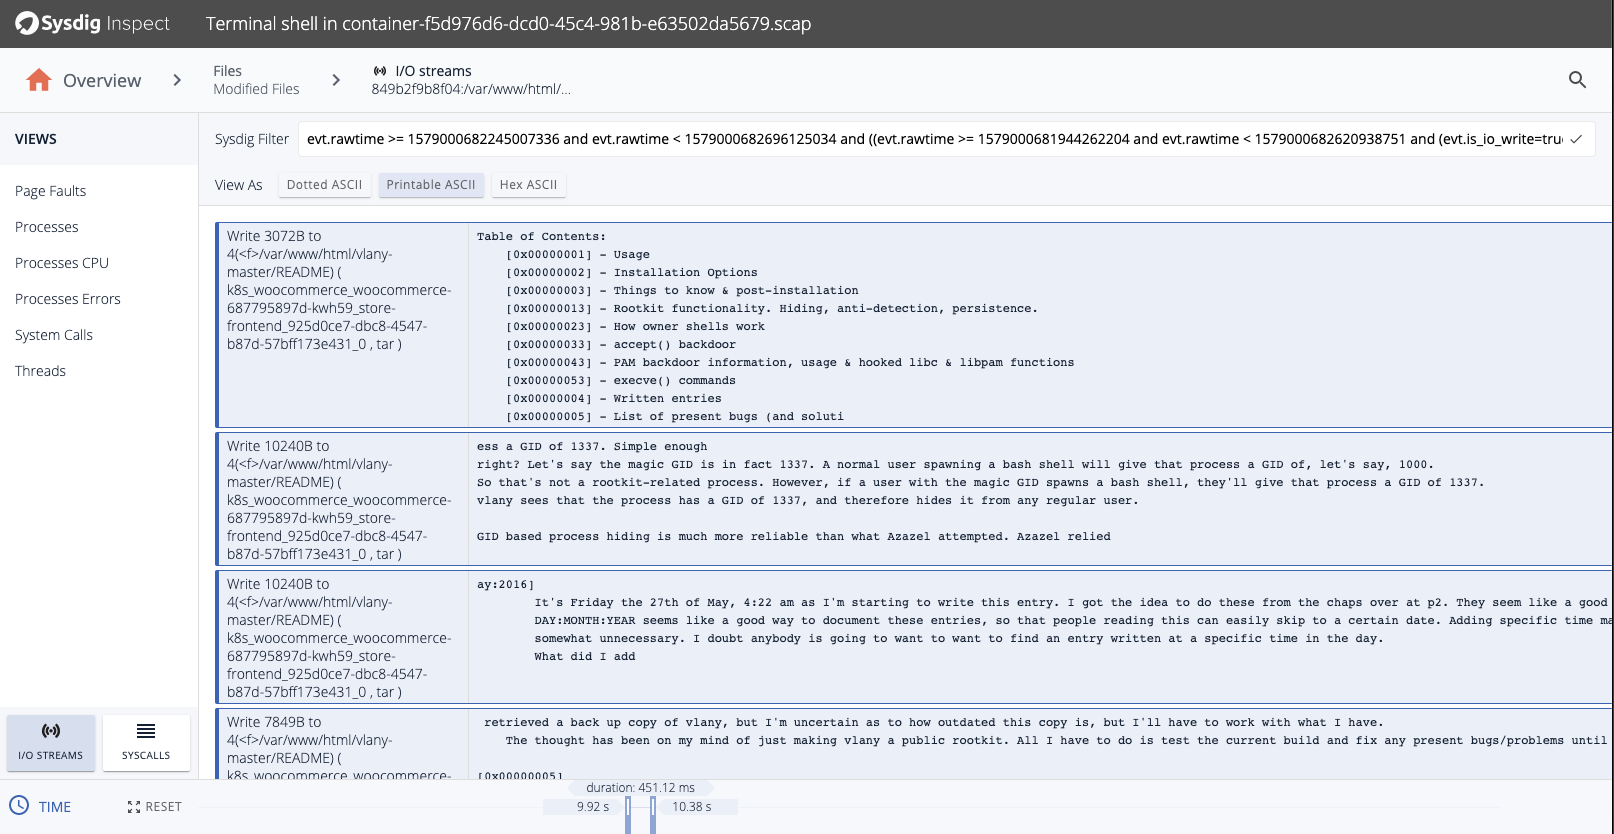
An unexpected change in the filesystem (FS) or directory could be a sign of an attacker executing malicious code on the system. This is why security teams need to implement file integrity monitoring (FIM) to spot these attacks. Attackers will leave behind signs that they’ve tampered with a host in system files and configurations. By looking for these kinds of changes, organizations can more quickly identify compromised systems. For example an attacker could create a container mounted/etc/ from the host filesystem to /mnt/etc/ inside the container. Then, by writing to files below /mnt/etc/ inside the container, they can write to files below /etc on the host. Ideally, your runtime security tool has rules already created to detect these types of actions since they are flagged as IOC by many security standards and frameworks, including MITRE, NIST, and SOC2.
 As a next step, the attacker could install packet-sniffing software to harvest credit card data as it moves around the network. While the chances of catching the specific harvesting tool are slim — because attackers can easily avoid detection by changing the binary name — there are good chances to detect the malicious behavior, catching the unexpected changes to the system that houses the harvesting tool.
In case of compromise, understanding the adversary’s course of action and the compromise blast radius is critical. Therefore, make sure that you have forensic capabilities. All pre- and post-attack container activities should be recorded to allow teams to analyze everything that happened (such as commands run, files touched, connections made, etc.), even after the container is gone!
As a next step, the attacker could install packet-sniffing software to harvest credit card data as it moves around the network. While the chances of catching the specific harvesting tool are slim — because attackers can easily avoid detection by changing the binary name — there are good chances to detect the malicious behavior, catching the unexpected changes to the system that houses the harvesting tool.
In case of compromise, understanding the adversary’s course of action and the compromise blast radius is critical. Therefore, make sure that you have forensic capabilities. All pre- and post-attack container activities should be recorded to allow teams to analyze everything that happened (such as commands run, files touched, connections made, etc.), even after the container is gone!
 You can learn more about this in our “File Integrity Monitoring best practices” article.
7. DNS request anomalies or large spikes in DNS requests from a specific host
Abnormal DNS traffic is identified as a potential technique under Command and Control (e.g., C&C or C2) tactics in the MITRE ATT&CK matrix. The unique patterns of this traffic can be recognized and are a very standard approach to identifying a compromise. Seeing a large spike in DNS requests from a specific host can serve as a good indicator of potentially malicious activity. Watching for patterns of DNS requests to external hosts, compared against geoIP and reputation data, and implementing appropriate filtering can help to identify and mitigate C&C tactics over DNS. One approach is to monitor Kubernetes coredns metrics, including coredns requests count. This is a good example of how monitoring metrics data from your environment can provide intelligence to unveil signs of an attack.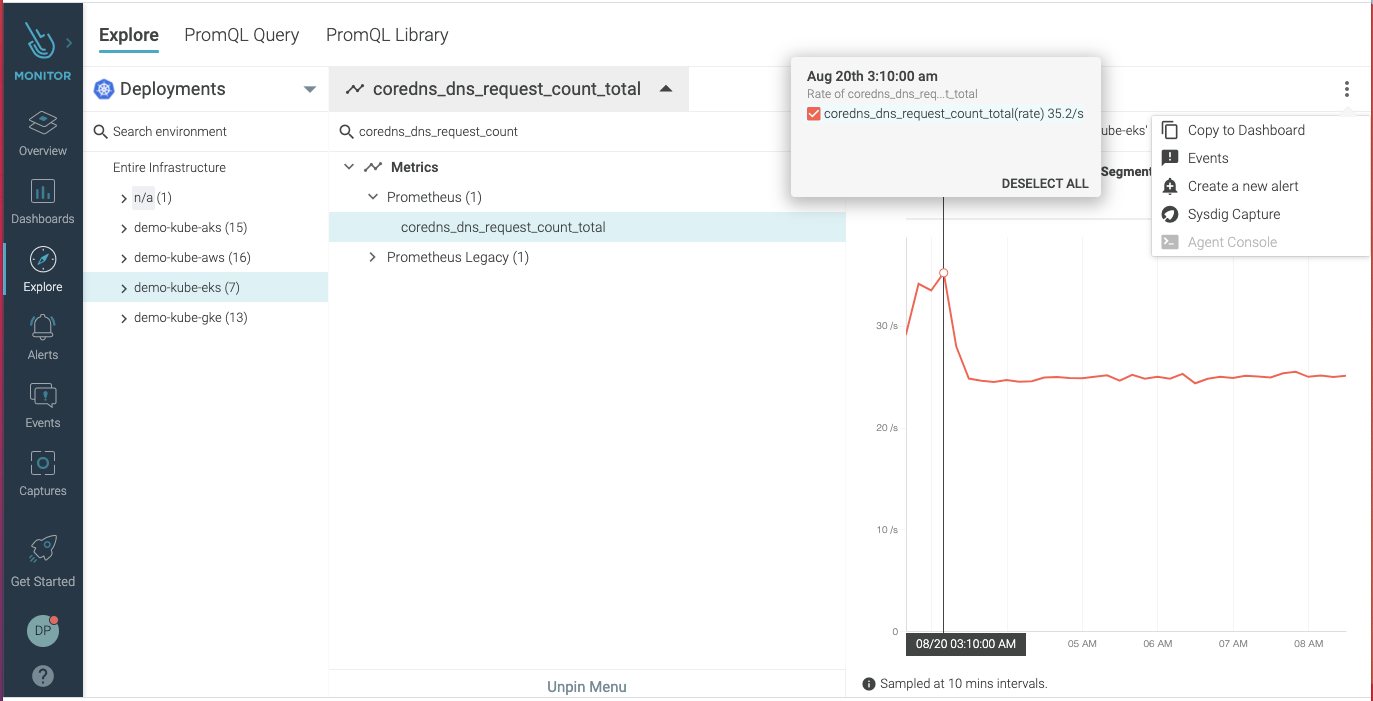 Read more about resolving DNS with Falco
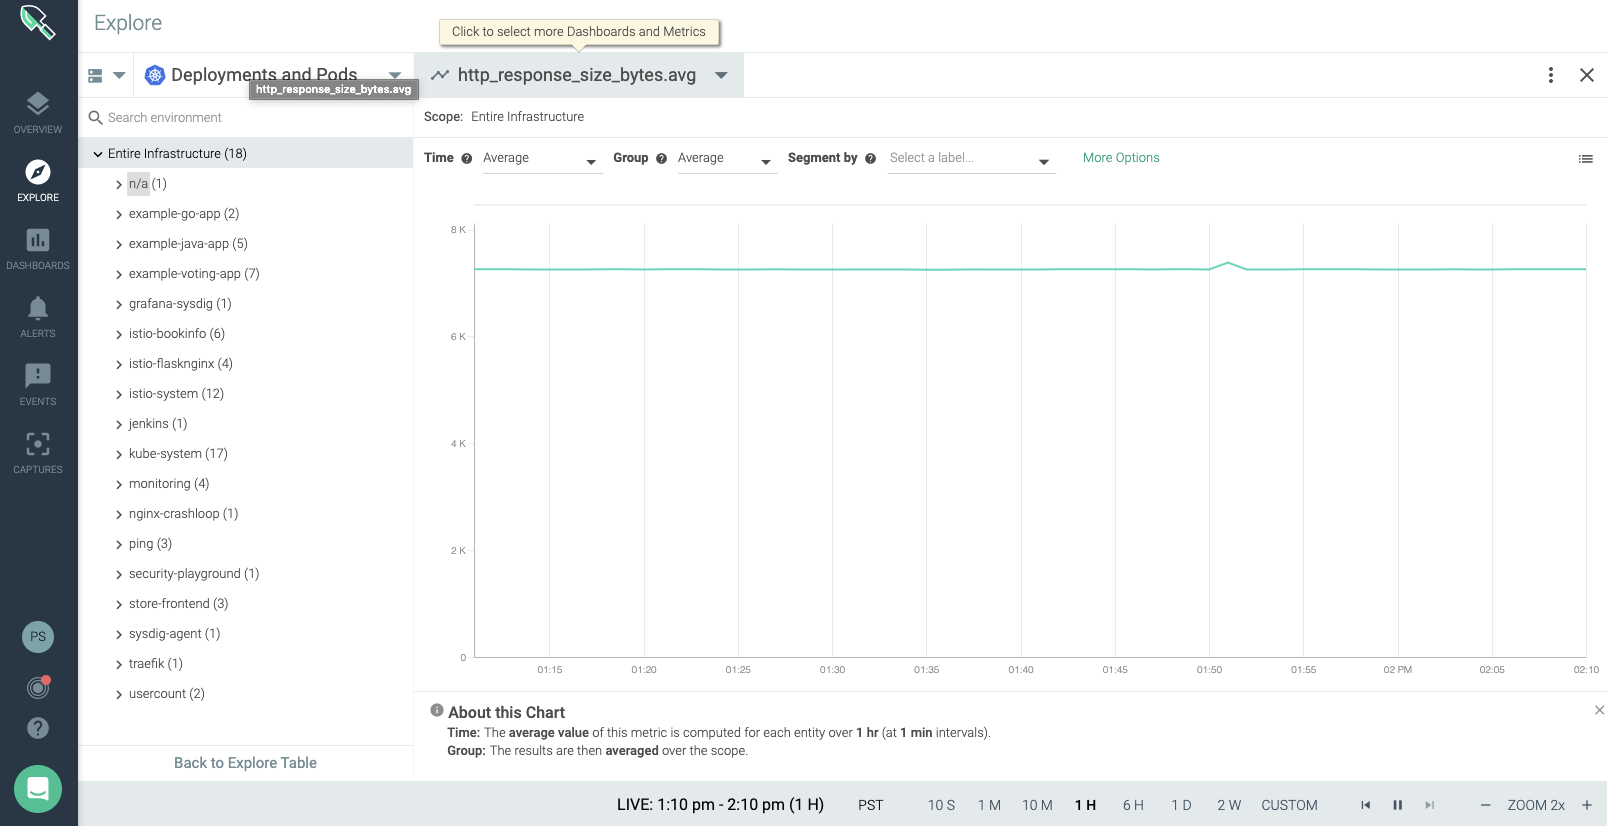
8. Unusual HTTP response sizes
Unusual HTTP Response Sizes could be a sign of an exfiltration. For instance, if an attacker accesses a web application in a PCI scoped namespace that holds sensitive credit card data, the HTTP responses exfiltrating data would be larger than a normal request. You can use metrics, such ashttp_response_size_byte, to monitor the Kubernetes deployments for unusual HTTP response size and detect an exfiltration.
9. Unknown binary processes spawned
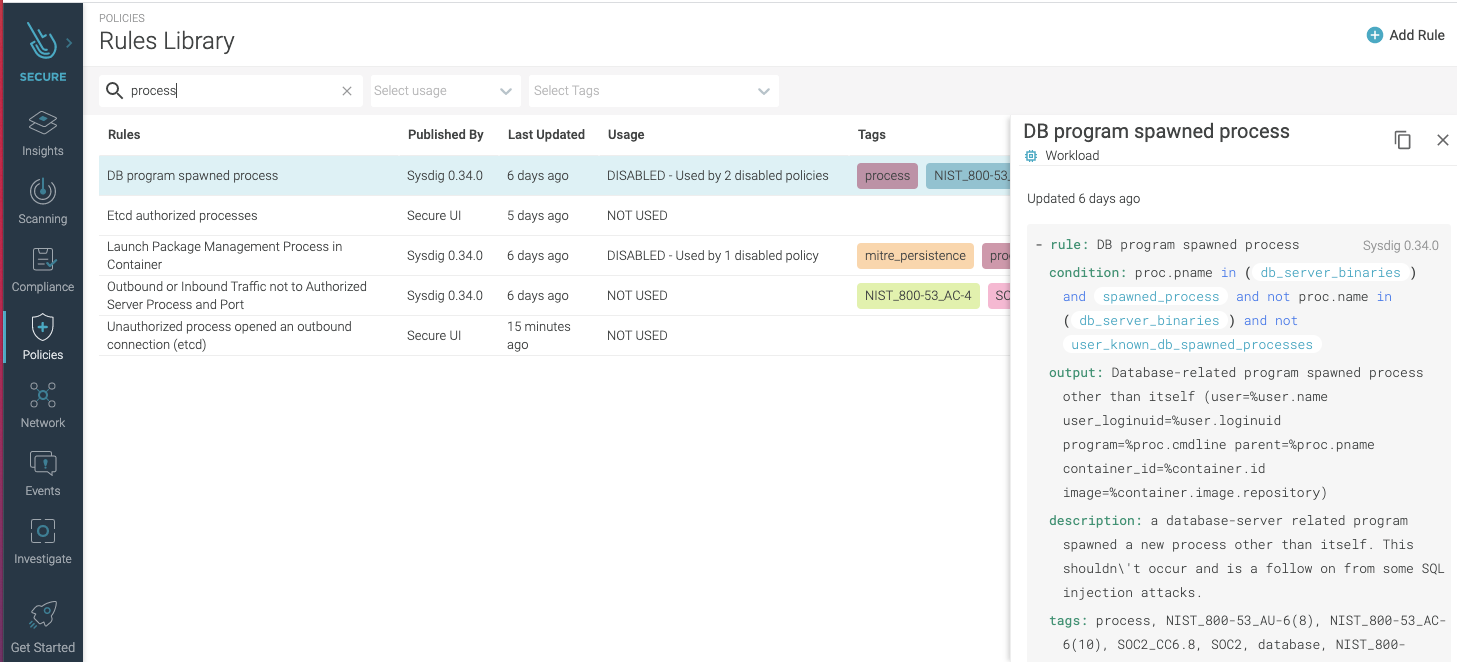
Containers offer some security advantages, one of them being that they run a set of processes that are usually well known. So, detecting that an unknown binary process spawned could be an indicator of compromise and a sign of an execution or lateral movement technique. Detecting this type of compromise in action requires runtime protection and fine-grained visibility into the container’s runtime. Processes expected to be running in a container is something that can be easily defined, either manually or automatically, via image profiling. Once the list of processes is defined, the next step is simply to include it as a runtime policy rule for the container that would detect unknown binary processes spawned.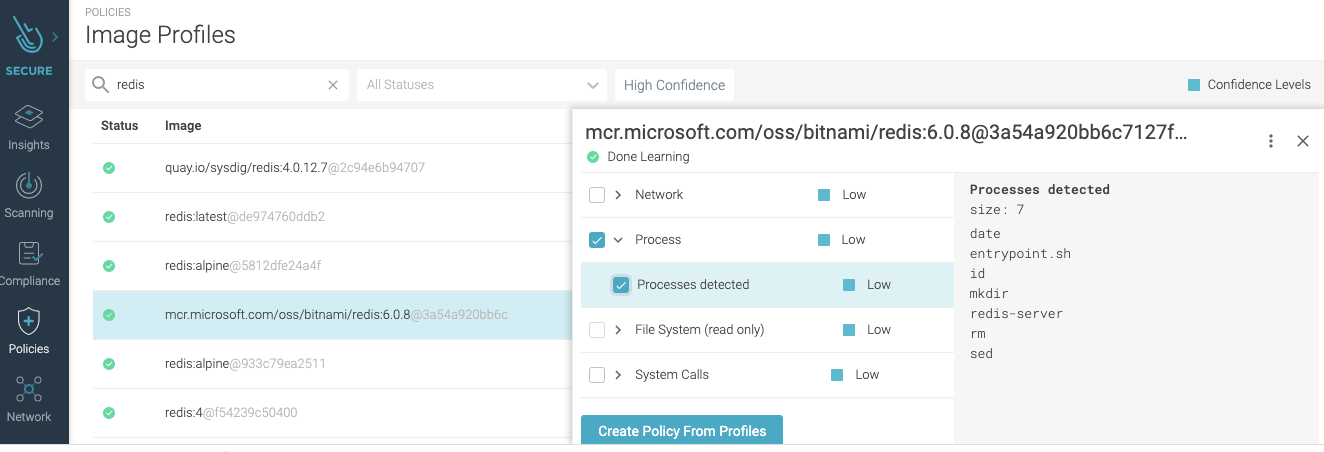 Here’s an example of a rule to detect unknown spawned process:
 Detecting is not all of it, however. Besides timely notification and remediation (e.g., killing, stopping, pausing the infected container), you also need auditable evidence for transparency and improved intelligence. Make sure that you have a tool that covers the complete workflow: real-time detection, remediation, and auditing.
10. HTTP 403 and 404 error codes spikes
Consecutive, failed HTTP requests, resulting in 403-forbidden or 404-unknown responses, can be seen as intrusion attempts and an indicator of an Initial Access TTP. Adversaries could be trying to access restricted areas or perform fingerprinting. Make sure you monitor HTTP metrics, including errors, alerting to a sudden increase in the number of error codes count.
Conclusion
Security incidents are not isolated events. They push limits, break through boundaries, make use of unexpected interactions (e.g., start processes and connections, modify accounts and permissions, etc.), and cause resource consumption disturbance (e.g., CPU, memory, bandwidth, etc.). Security incidents are anomalous in behavior and impact, leaving a trail of indicators of their malicious presence and procedures. You just need to be alerted to the combined signs to uncover a compromise, or attempt to do so, as quickly as possible. In this blog, we shared the top 10 indicators of a compromise in Kubernetes, and how you could detect them, by including monitored metrics and events from your Kubernetes environments in your security approach. Although detecting an early indicator of compromise is important, preventing the security incident would be preferred. That’s why security must be an integral part of the entire software development lifecycle (SDLC) – from code to production, a fully embraced Secure DevOps culture. You improve protection by enforcing security policies pre-deployment on Infrastructure as Code (IaC), having security integrated into the CI/CD pipeline, and continuously checking for drifts and threats at runtime.With Sysdig Secure DevOps, you get unified visibility across workloads and cloud infrastructure from a single security and monitoring event store. Accurately alert on threats, misconfigurations, operational issues, and compliance risks pre-deployment and in production, and respond using a detailed activity record. Easily plug into your existing workflows with out-of-the-box integrations. It only takes a few minutes to get started! Request a free trial today!