
Custom Metrics
Ingest high volume custom metrics in any format at a low cost.

Why Sysdig Monitor for Custom Metrics?
Using Sysdig Monitor, companies can collect custom metrics and monitor at a significantly lower cost, at much higher volumes, and in any format (such as Prometheus, StatsD or JMX). Sysdig customers have reduced their metrics monitoring costs by as much as 75%.
Custom Metrics Formats
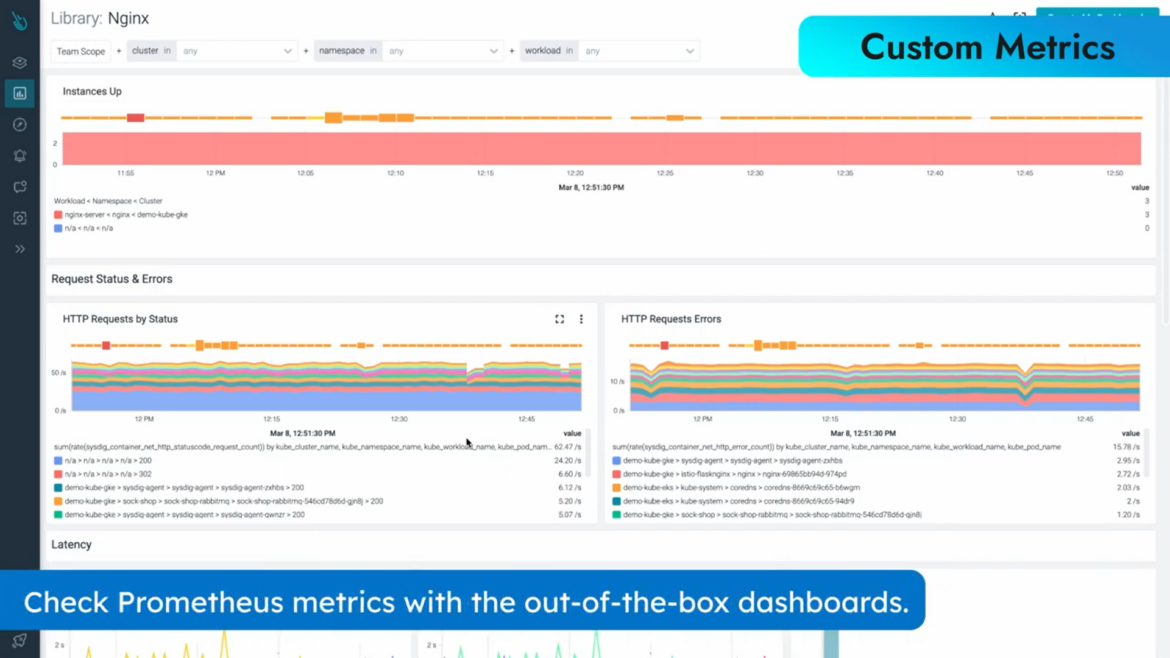
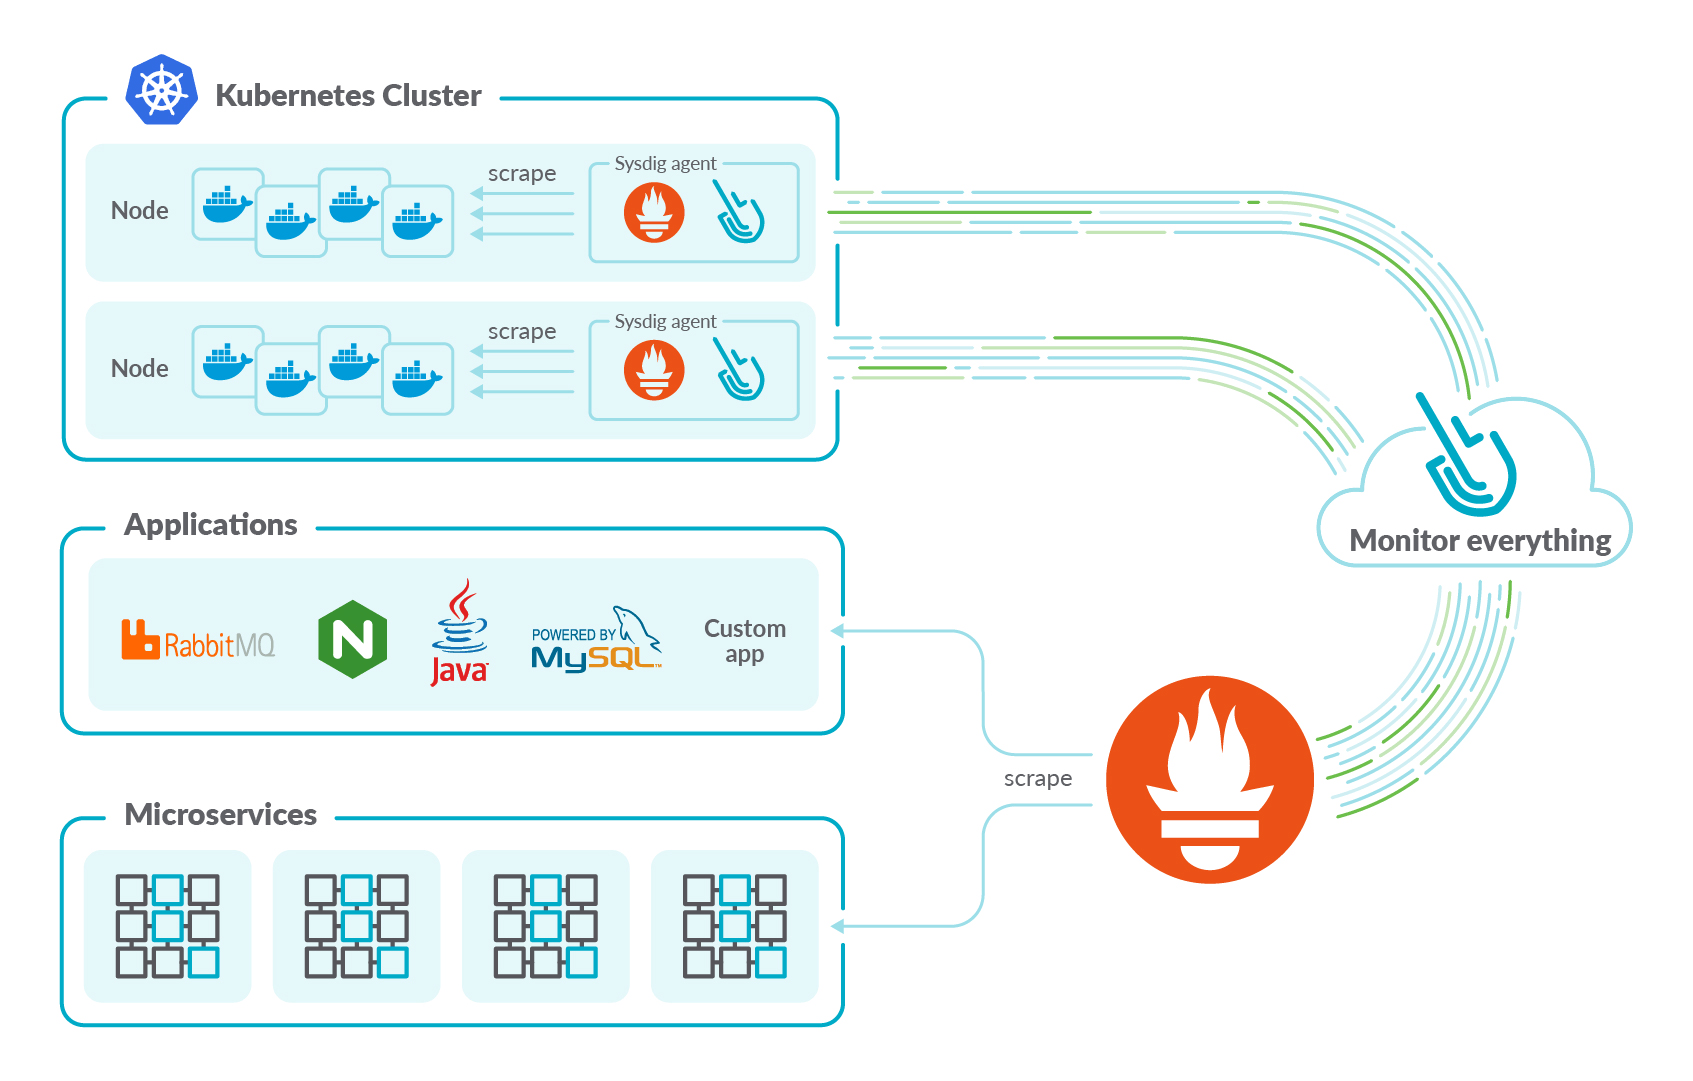
Prometheus Metric Collection
Collect, store, and query Prometheus metrics and labels. A lightweight Prometheus server is directly embedded into the Sysdig agent to facilitate metric collection.
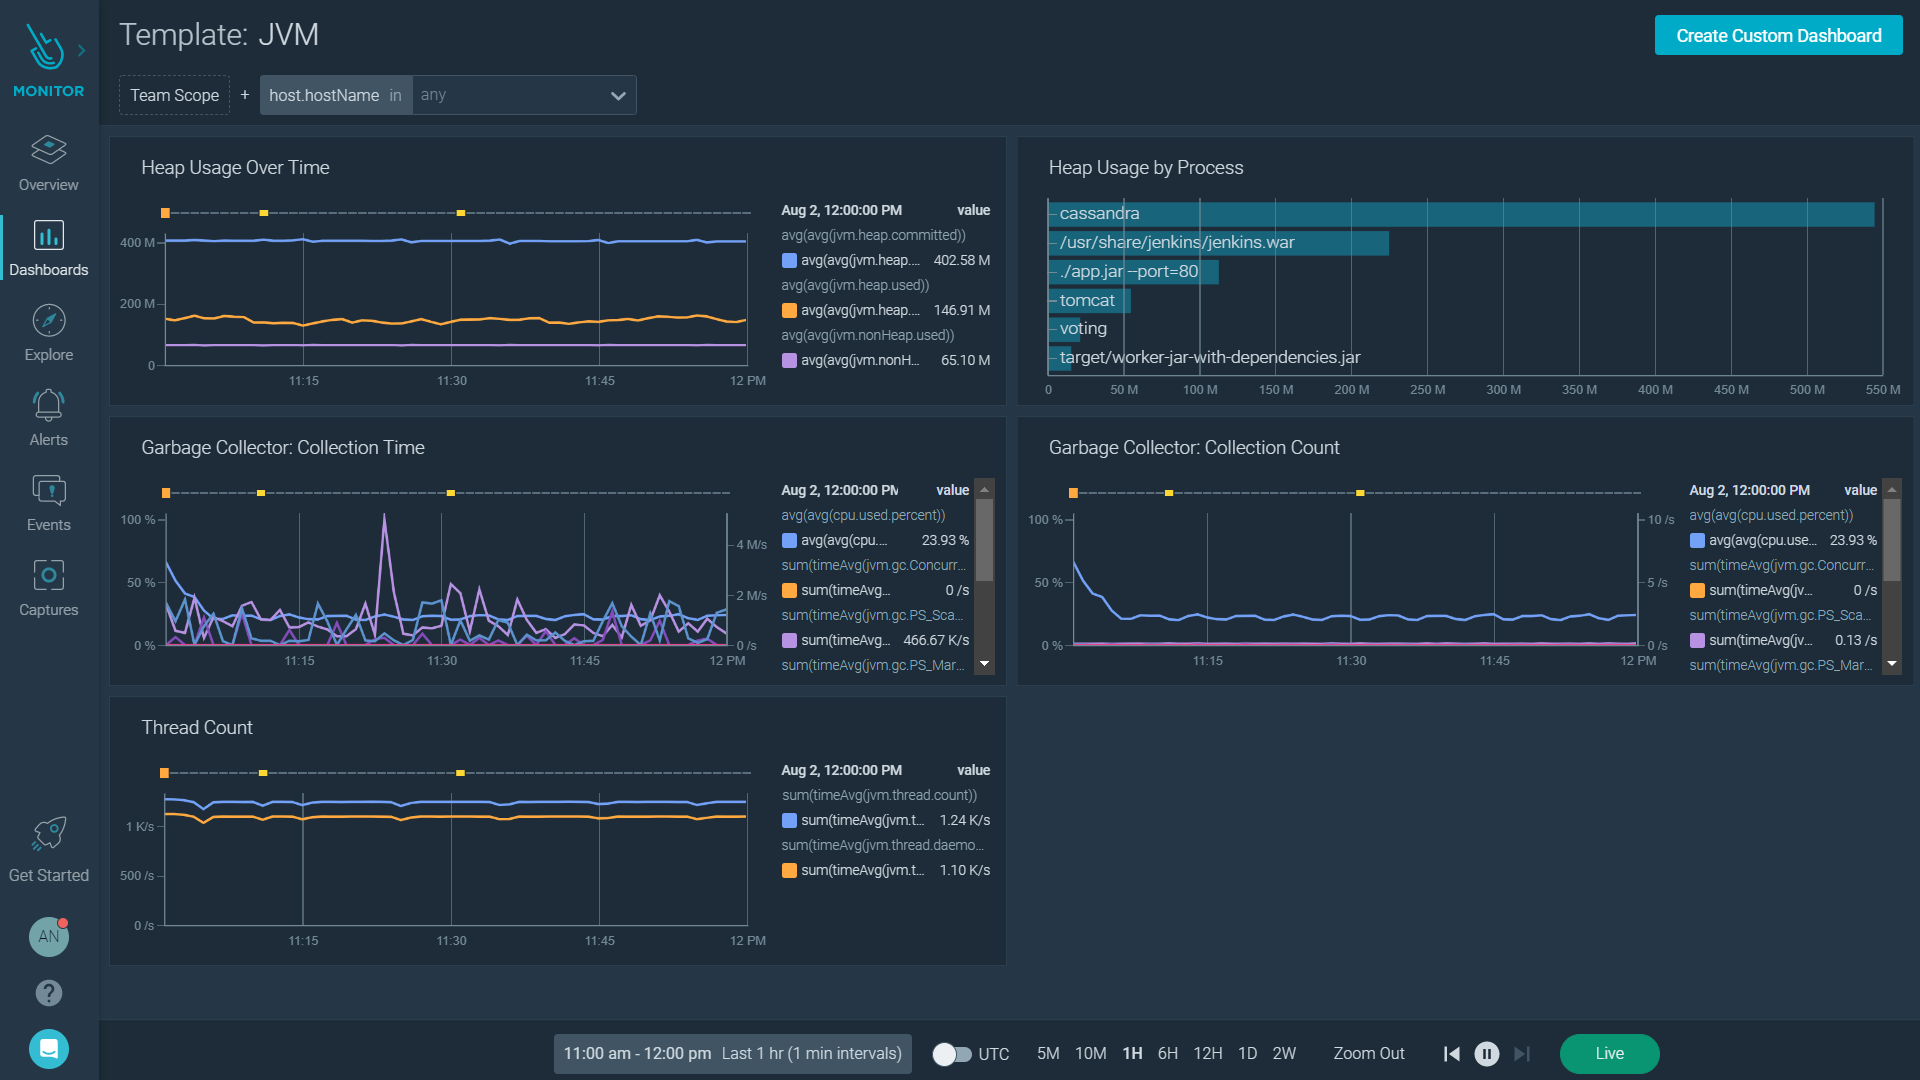
JMX Metric Collection
Discover and retrieve JMX metrics from your Java virtual machines using the JMX protocol. Virtual machines will be polled to collect metrics like Heap Memory and Garbage collector.
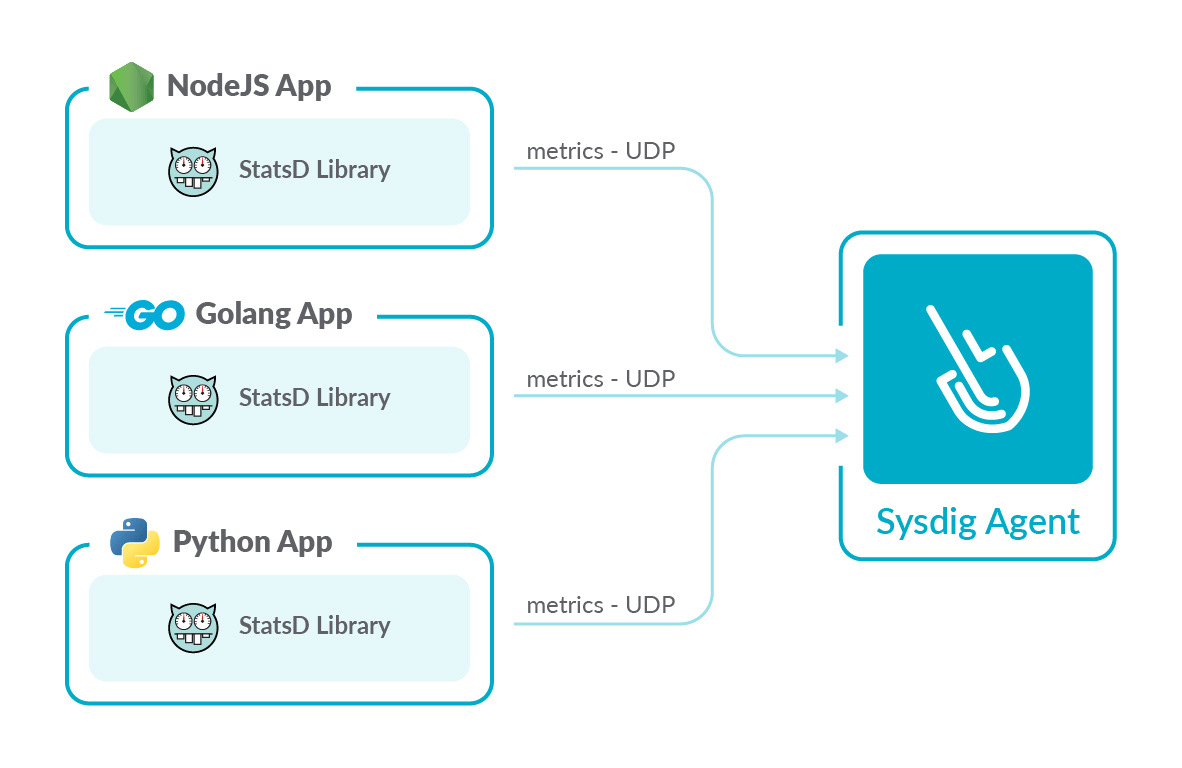
StatsD Metric Collection
Collecting StatsD metrics is easy with an embedded StatsD collector. Point your library at our agent and see all your metrics in the context that is most helpful for you.


Take the Next Step!
See a live demo how observability with Sysdig Monitor can help you.
Deep visibility for containers, Kubernetes, and cloud.