
As we already discussed in previous articles, the Kubernetes control plane is made up of a few key components playing different roles. Those are necessary to ensure both Kubernetes and applications are functional and behaving properly.
Due to the complexity of Kubernetes, and the rapid adoption of Cloud environments, many organizations are still in their cloud-native adoption journey. Most of these organizations have to deal with complex issues on a regular basis, and it’s not always easy to react in a timely manner. Application monitoring and troubleshooting can end up being a big headache if not handled properly, but Kubernetes control plane monitoring can also be a huge pain when monitoring and troubleshooting issues in your Kubernetes and cloud infrastructure. The good news is Sysdig Monitor can help with such hard tasks!
Keep reading and discover how Sysdig Monitor can help you with Kubernetes control plane monitoring.
Kubernetes control plane monitoring
The Kubernetes control plane is the engine room within a Kubernetes cluster. As mentioned earlier, it is key to properly monitor its components. Otherwise, you may end up facing serious problems in your applications, even service disruptions.
If you are interested in learning more about how to monitor the Kubernetes control plane using your own Prometheus self-managed instance, please check out the following articles:
- How to Monitor Kubernetes API Server
- How to Monitor etcd
- How to Monitor kube-controller-manager
- How to Monitor the Kubelet
- How to Monitor CoreDNS
On the other hand, Sysdig Monitor provides its own managed service for Prometheus. Customers don’t need to take care of either Prometheus scalability, performance or long term storage, these critical points are covered by Sysdig. What Sysdig does under the hood to pull your metrics and Kubernetes data, in a few words, is:
- The Sysdig Agent has to be deployed as a first step on all the nodes in your cluster.
- The agent starts collecting metrics and low-level information from your containers and nodes with eBPF.
- Kubernetes, infrastructure metadata, and application context is used to enrich metrics. These metrics, network data, processes information, resource utilization, syscalls, and much more is collected and ingested by Sysdig Monitor.
- Kubernetes control plane components such as the Kubernetes API Server, scheduler, kube-controller-manager, CoreDNS, etcd are scraped automatically.
- Kubelet metrics are also collected by the Sysdig Agent, including cAdvisor data.
- You can either push your own custom metrics to the Sysdig Prometheus managed service using remote-write, or configure the Sysdig Agent to discover any custom endpoint and start collecting metrics from there.
- All your data is automatically available for you in a few seconds in the Sysdig Monitor portal.
In terms of Kubernetes control plane monitoring, Sysdig Monitor will provide all the relevant information about your Kubernetes control plane a few minutes after deploying the agent. You can start then, monitoring Kubernetes control plane components thanks to the out-of-the-box dashboards or troubleshooting any issue that may come up at the control plane level.
Similar to how Sysdig Monitor leverages its own agent to monitor and capture data and traffic in your Kubernetes environment, it can be done in other Kubernetes distributions like OpenShift, Rancher, and managed Kubernetes platforms like EKS. If you want to learn more about how to monitor OpenShift with Sysdig Monitor, check out this step-by-step guide.
How to configure the Sysdig Agent
The first time you log into the Sysdig Monitor portal, you’ll be redirected automatically to the onboarding section. Here, you’ll find instructions to deploy the agent easily in a few steps. Otherwise, the Sysdig documentation portal provides all the information you need to complete this initial task.
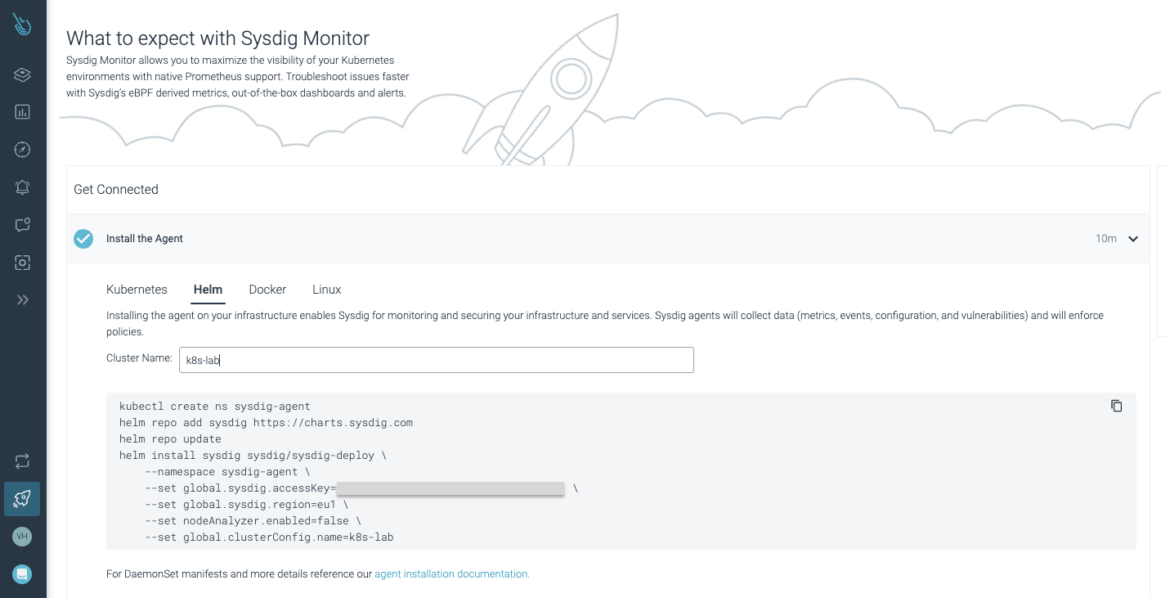
Let’s get started with the Sysdig Agent installation. A Helm chart will be used in this scenario.
# kubectl create ns sysdig-agent
namespace/sysdig-agent created
# helm repo add sysdig https://charts.sysdig.com
"sysdig" has been added to your repositories
# helm repo update
Hang tight while we grab the latest from your chart repositories...
...Successfully got an update from the "sysdig" chart repository
...Successfully got an update from the "prometheus-community" chart repository
Update Complete. ⎈Happy Helming!⎈
# helm install sysdig sysdig/sysdig-deploy \
>     --namespace sysdig-agent \
>     --set global.sysdig.accessKey=abcdefgh-ijkl-mnop-qrst-uvwxyz012345 \
>     --set global.sysdig.region=eu1 \
>     --set nodeAnalyzer.enabled=false \
>     --set global.clusterConfig.name=k8s-lab
NAME: sysdig
LAST DEPLOYED: Wed Jan 18 09:58:46 2023
NAMESPACE: sysdig-agent
STATUS: deployed
REVISION: 1
NOTES:
The agent for Sysdig Secure DevOps Platform is spinning up on each node in your
cluster. After a few seconds, you should see your hosts appearing in the
Sysdig Agent Health & Status Dashboard.

Links for your deployment:
  * Sysdig Monitor: https://eu1.app.sysdig.com/#/dashboard-template/view.sysdig.agents?last=10
  * Sysdig Secure: https://eu1.app.sysdig.com/secure/#/data-sources/agents
Wait for a few minutes and check whether the Pods are already up and running.
# kubectl get pods  -n sysdig-agent
NAME                 READY   STATUS    RESTARTS   AGE
sysdig-agent-9hk84   1/1     Running   0          4m1s
sysdig-agent-smtm6   1/1     Running   0          4m1s
sysdig-agent-vpcbn   1/1     Running   0          4m1s
At this point, you are ready to start monitoring and troubleshooting your whole Kubernetes cluster.
Kubernetes control plane metrics ingestion is auto-magic (automatic and magical). If control plane dashboards and metrics are not shown up after the initial Sysdig Agent deployment, reach out to your support customer representative and request activation.
Sysdig Monitor benefits for Kubernetes environments
As soon as you log into the Sysdig Monitor portal, and after deploying the Sysdig Agent, you’ll soon realize that Sysdig Monitor offering is really wide, covering many different use cases:
- Kubernetes monitoring and troubleshooting. Monitor your cluster capacity and availability, troubleshoot issues up to 10x faster, and effectively measure resource consumption vs. actual limits and requests.
- Prometheus monitoring, providing a Prometheus managed service and long term storage for long-term time series retention.
- Custom metrics. Collect your own custom metrics thanks to the Sysdig Agent or push them out using remote-write. Explore and analyze your custom metrics data yourself with the PromQL explorer.
- Cloud monitoring enables you to actively monitor your cloud provider services and get benefits from the metadata enrichment on metrics and alerts.
- Cost optimization will allow you to observe and optimize your workloads efficiently to reduce wasted spending by 40% on average.
In order to cover all these use cases, Sysdig Monitor provides lots of features, all of them available from the very beginning. Let’s enumerate some of these functionalities:
- Tons of dashboards provided out of the box. Both applications and internal Kubernetes components can be observed from the very beginning, thanks to the Sysdig dashboards.
- Sysdig Advisor will help you troubleshoot complex issues in Kubernetes environments.
- The recently released Sysdig Cost Advisor helps you to identify the areas where you are overspending, providing a remediation to start cutting costs by 40%.
- Sysdig Inspect provides an interface to analyze syscalls and other internals from data captures.
- Metrics explorer is one of the other amazing features. It allows you to explore and pull data from all your metrics.
- A set of predefined alerts available for your either own or other third-party applications.
- Much more
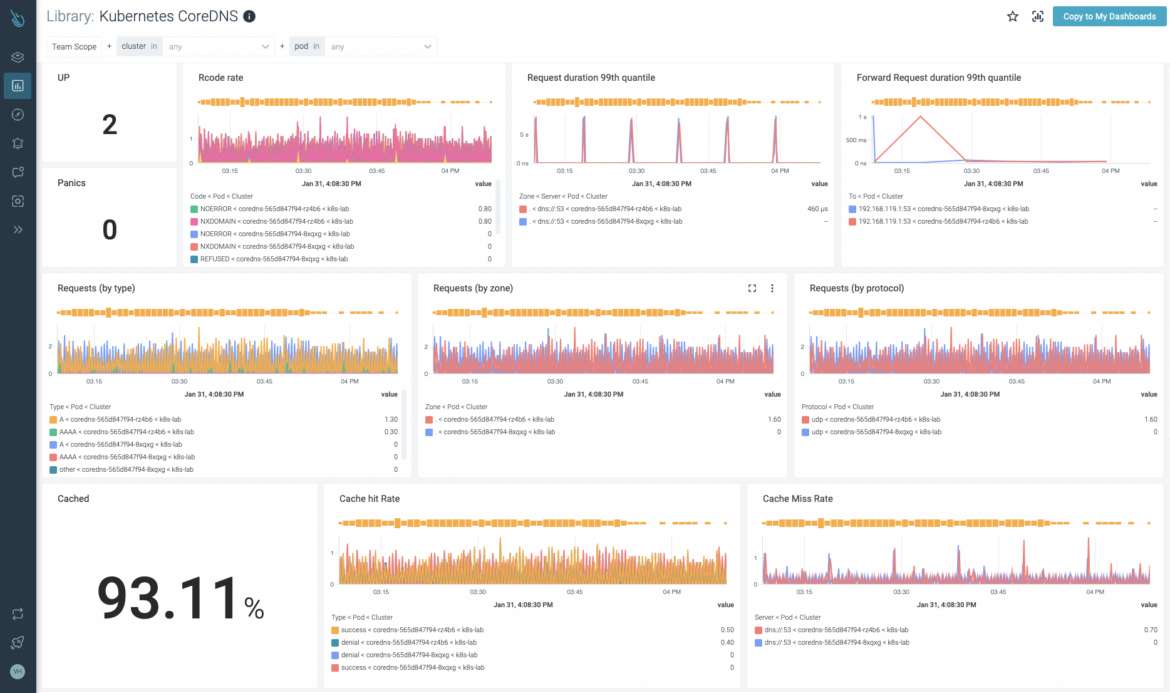
Out-of-the-box dashboards for Kubernetes control plane monitoring
As soon as the agent starts collecting data from your Kubernetes node, and the Kubernetes control plane, you’ll soon realize that lots of dashboards will show up automatically, providing all the information you may need to monitor your Kubernetes applications and services. Did you follow the required steps to deploy the Sysdig Agent? If so, then you are ready to start observing what’s going on in your whole Kubernetes infrastructure!
Sysdig Monitor is able to detect third-party workloads in your Kubernetes infrastructure. Some of these workloads are enabled automatically and can be monitored without any additional step. Istio is a good example. Just log into the Sysdig Monitor platform and start consuming metrics. Many other components at a higher level are integrated into Sysdig Monitor in the same way, like CNIs, or CoreDNS. You don’t need to worry about tweaking your monitoring system after version changes, these integrations are maintained by Sysdig. Check the official Sysdig documentation for more information on the third-party applications integrations available.
That’s really good stuff, but what about troubleshooting issues in Kubernetes?
Let’s talk about that in the next section. Keep reading and learn more about how to troubleshoot control plane issues in Kubernetes.
Troubleshooting Kubernetes control plane issues with Sysdig Monitor
Thanks to the Sysdig Advisor, users can easily spot issues in your Kubernetes infrastructure at a glance. Even those complex and hidden issues that may come up at the control plane level can be troubleshooted up to 10x faster than traditional troubleshooting.
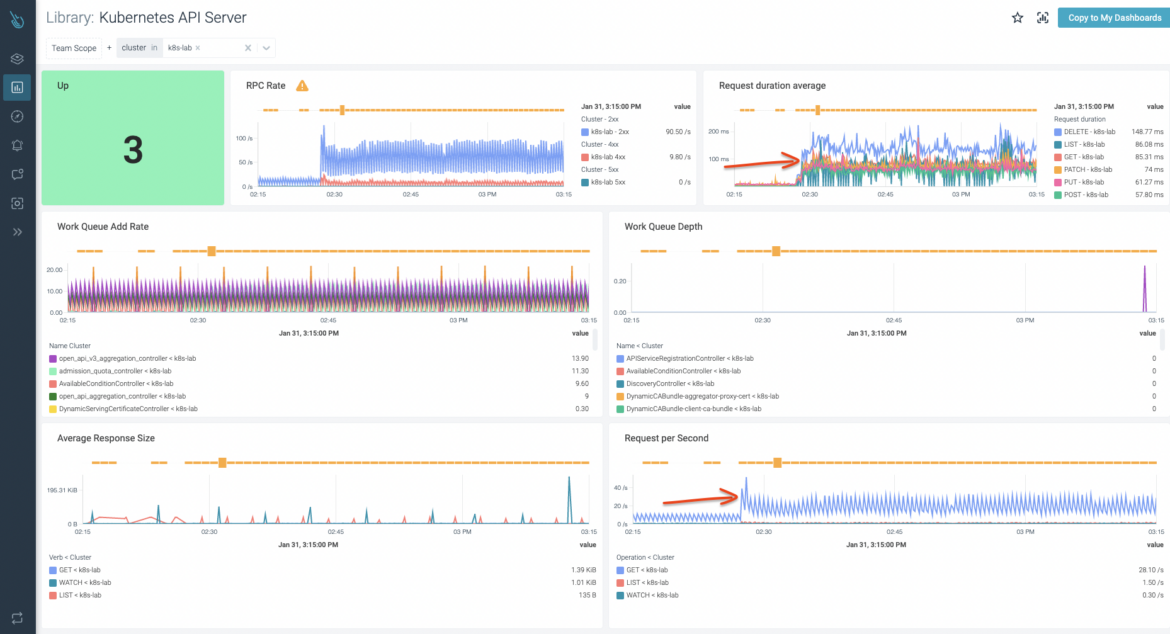
In the following example, you’ll notice that something really weird started to happen with the Kubernetes API server. In the out-of-the-box Kubernetes API server dashboard it can be seen abnormal behavior: 4xx http response codes, a sudden increase in API server request duration operations, among others. Let’s see how we can figure out what’s going on.
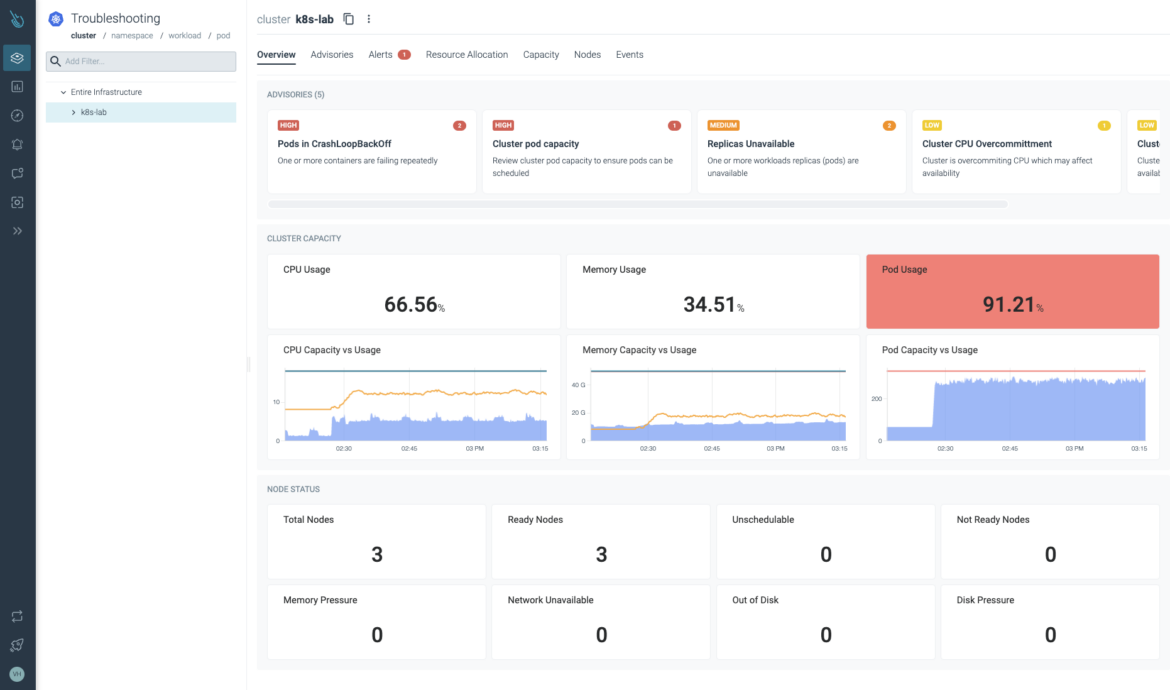
With Sysdig Advisor, you can easily check your entire infrastructure. In this case, a sudden CPU and memory increase was detected.
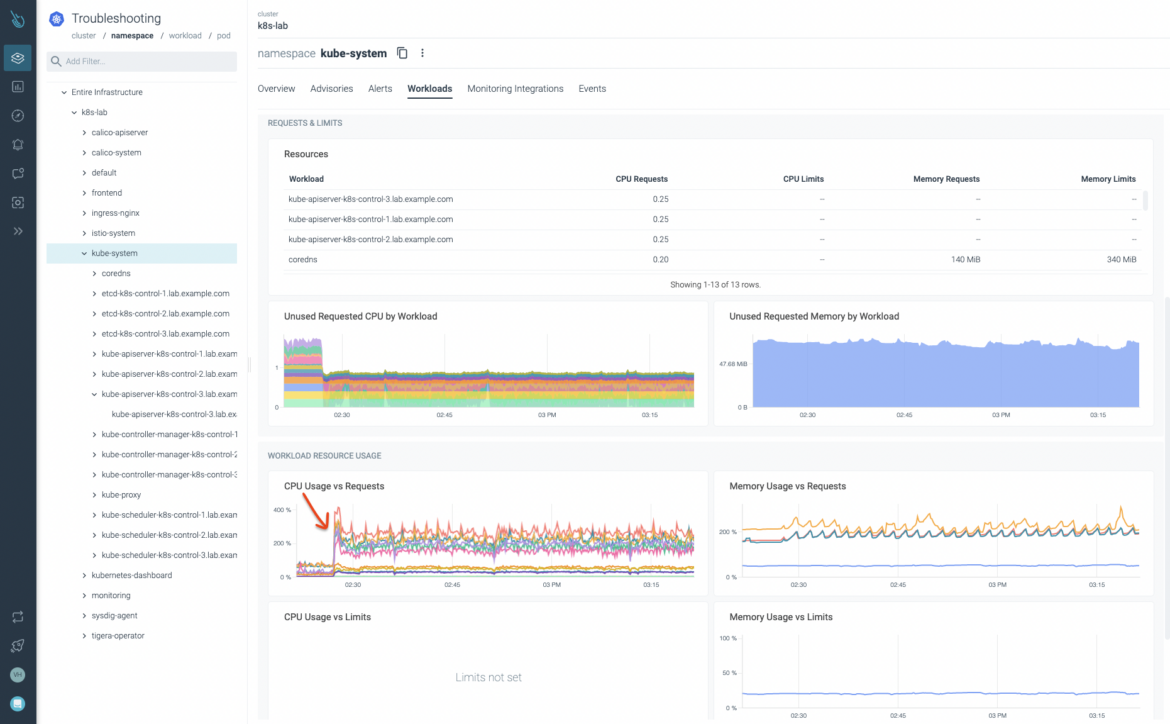
Drilling down through the namespaces available in the cluster and selecting kube-system, you’ll find the control-plane Pods. It can be confirmed that something abnormal is happening, impacting heavily on the Kubernetes API server and etcd performance.
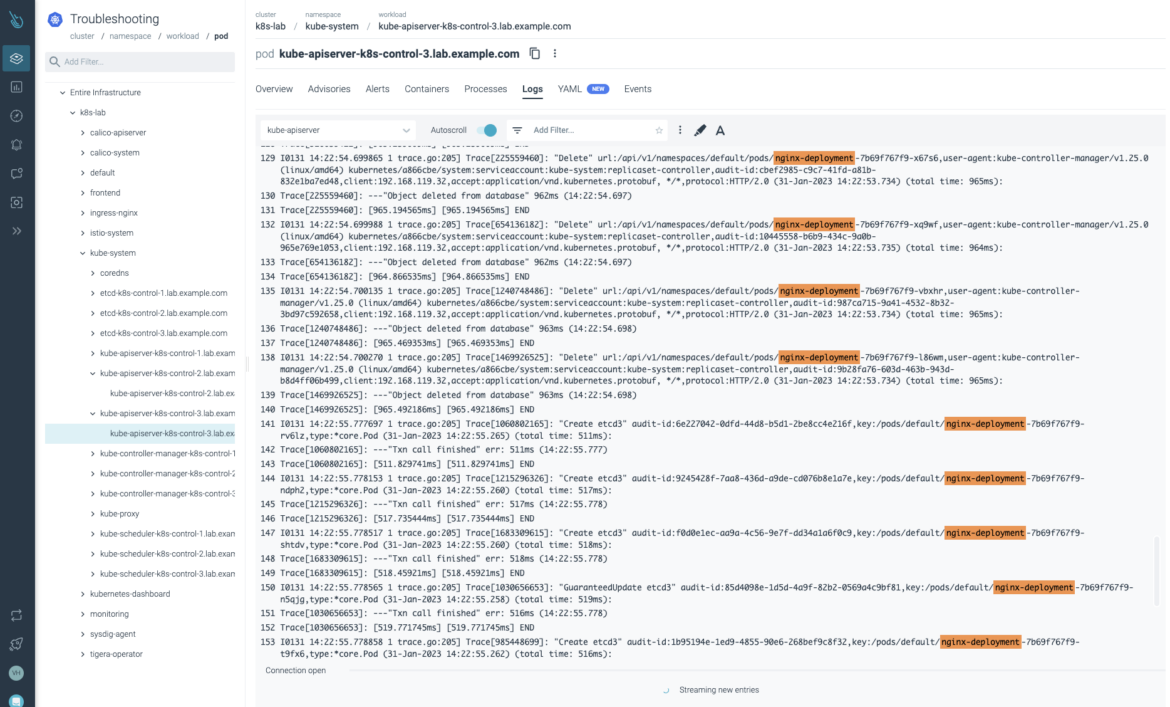
Next, let’s check some of the Kubernetes API server Pod logs, just in case we can get useful information. As you can see in the following picture, the kube-apiserver Pods are continuously reporting these few messages. It seems to be some sort of issue with the nginx-deployment, having the API quite busy deleting Pods and creating etcd entries on a permanent basis.
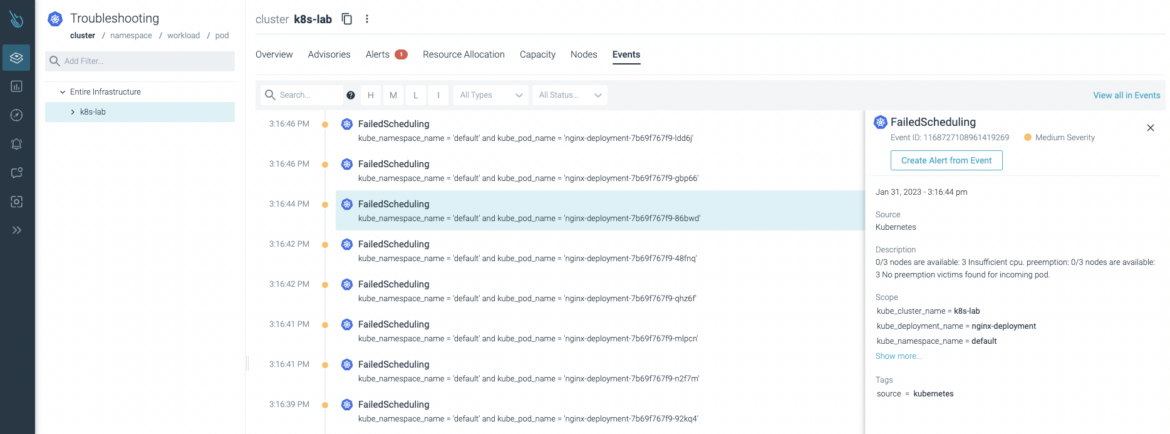
The Events section in Sysdig Advisor can confirm that. There is some issue with that deployment. The Kubernetes cluster is reporting a lot of nginx-deployment object related events. No nodes are available to host these Pods.
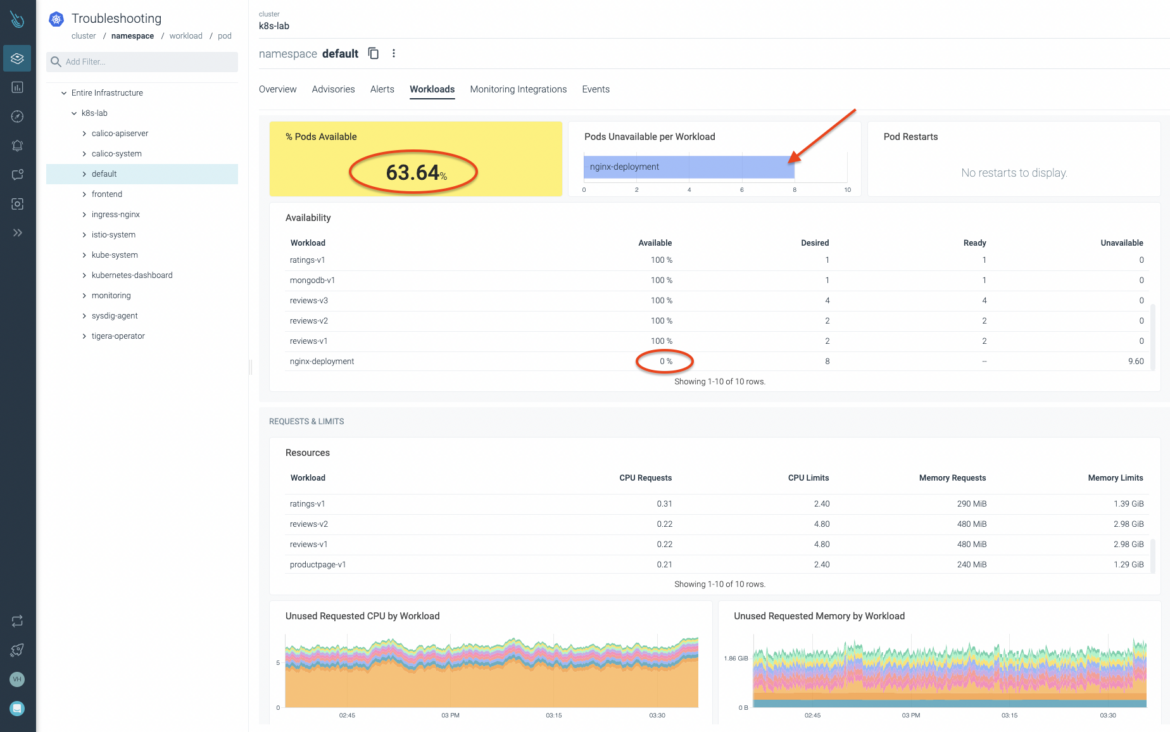
This deployment can be located within the default namespace. Let’s check it first: around 63% of Pods available, and 0% nginx-deployment Pods available.
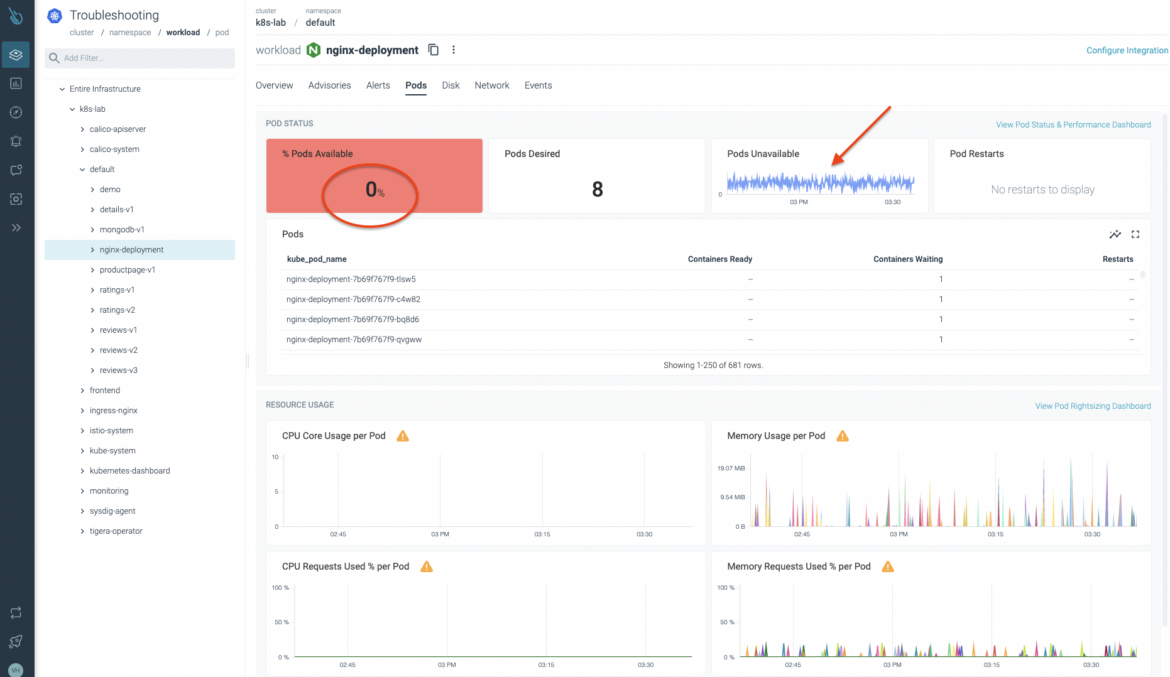
Let’s select the nginx-deployment in the default namespace. There is certainly a problem with the nginx-deployment, it is stuck and generating an excessive burden on Kubernetes API and etcd.
Conclusion
Kubernetes control plane monitoring and troubleshooting can be difficult, noisy, and a time-consuming task. Sysdig provides an out-of-the-box troubleshooting and monitoring experience even for the most complicated deployments.
Sysdig Monitor provides a lot of functionalities to start monitoring and troubleshooting issues from the very beginning. Thanks to its own Prometheus compatible managed instance, you won’t need to worry about scalability, performance, or any maintenance at all. Start consuming your own custom metrics just a couple of minutes after deploying the agent, or explore and observe your cloud-native applications, Kubernetes, and cloud services and components. Everything is in a single place: the Sysdig Monitor portal.
In this article, you have learned how to easily monitor the Kubernetes control plane, as well as how to troubleshoot a real issue where the Kubernetes API Server and etcd were involved.
You can monitor and troubleshoot Kubernetes control plane components easily with Advisor and Sysdig Monitor. If you haven’t tried it yet, request a 30-day trial account and start monitoring and troubleshooting your Kubernetes infrastructure. It’s free and it doesn’t require any payment method at all!