


Falco Feeds extends the power of Falco by giving open source-focused companies access to expert-written rules that are continuously updated as new threats are discovered.

Prometheus monitoring is quickly becoming the Docker and Kubernetes monitoring tool to use. This guide explains how to implement Kubernetes monitoring with Prometheus. You will learn to deploy a Prometheus server and metrics exporters, setup kube-state-metrics, pull and collect those metrics, and configure alerts with Alertmanager and dashboards with Grafana. We'll cover how to do this manually as well as by leveraging some of the automated deployment/install methods, like Prometheus operators.

In this guide, we'll cover:
- Intro to Prometheus and its core concepts
- How Prometheus compares to other monitoring solutions
- How to install Prometheus
- Monitoring a Kubernetes Service
- Monitoring a Kubernetes cluster
After this article, you'll be ready to dig deeper into Kubernetes monitoring. Additional reads in our blog will help you configure additional components of the Prometheus stack inside Kubernetes (Alertmanager, push gateway, grafana, external storage), setup the Prometheus operator with Custom ResourceDefinitions (to automate the Kubernetes deployment for Prometheus), and prepare for the challenges using Prometheus at scale.
"Monitor your #Kubernetes cluster using #Prometheus, build the full stack covering Kubernetes cluster components, deployed microservices, alerts, and dashboards."
Why use Prometheus for Kubernetes monitoring
Two technology shifts took place that created a need for a new monitoring framework:
- DevOps culture: Prior to the emergence of DevOps, monitoring consisted of hosts, networks, and services. Now, developers need the ability to easily integrate app and business related metrics as an organic part of the infrastructure, because they are more involved in the CI/CD pipeline and can do a lot of operations-debugging on their own. Monitoring needed to be democratized, made more accessible, and cover additional layers of the stack.
- Containers and Kubernetes: Container-based infrastructures are radically changing how we do logging, debugging, high-availability, etc., and monitoring is not an exception. Now you have a huge number of volatile software entities, services, virtual network addresses, and exposed metrics that suddenly appear or vanish. Traditional monitoring tools are not designed to handle this.
Why is Prometheus the right tool for containerized environments? These four characteristics made Prometheus the de-facto standard for Kubernetes monitoring:
- Multi-dimensional data model: The model is based on key-value pairs, similar to how Kubernetes organizes infrastructure metadata using labels. It allows for flexible and accurate time series data, powering its Prometheus query language.
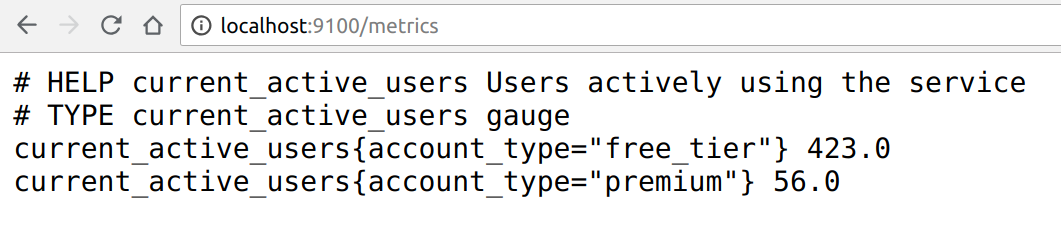
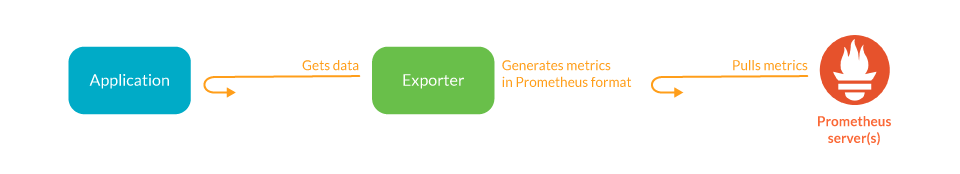
- Accessible format and protocols: Exposing prometheus metrics is a pretty straightforward task. Metrics are human readable, in a self-explanatory format, and published using a standard HTTP transport. You can check that the metrics are correctly exposed by using your web browser:
- Service discovery: The Prometheus server is in charge of periodically scraping the targets so that applications and services don't need to worry about emitting data (metrics are pulled, not pushed). These Prometheus servers have several methods to auto-discover scrape targets. Some of them can be configured to filter and match container metadata, making it an excellent fit for ephemeral Kubernetes workloads.
- Modular and high available components: Metric collection, alerting, graphical visualization, etc. are performed by different composable services. All of these services are designed to support redundancy and sharding.
How Prometheus compares to other Kubernetes monitoring tools
Prometheus released version 1.0 during 2016, so it's a fairly recent technology. There were a wealth of tried-and-tested monitoring tools available when Prometheus first appeared. So, how does Prometheus compare with these other veteran monitoring projects?
Key-value vs dot-separated dimensions: Several engines like StatsD/Graphite use an explicit dot-separated format to express dimensions, effectively generating a new metric per label:
current_active_users.free_tier = 423
current_active_users.premium = 56
This method can become cumbersome when trying to expose highly dimensional data (containing lots of different labels per metric). Flexible, query-based aggregation becomes more difficult as well.
Imagine that you have 10 servers and want to group by error code. Using key-value, you can simply group the flat metric by {http_code="500"}. Using dot-separated dimensions, you will have a big number of independent metrics that you need to aggregate using expressions.
Event logging vs. metrics recording: InfluxDB / Kapacitor are more similar to the Prometheus stack. They use label-based dimensionality and the same data compression algorithms. Influx is, however, more suitable for event logging due to its nanosecond time resolution and ability to merge different event logs. Prometheus is more suitable for metrics collection and has a more powerful query language to inspect them.
Blackbox vs whitebox monitoring: As we mentioned before, tools like Nagios/Icinga/Sensu are suitable for host/network/service monitoring and classical sysadmin tasks. Nagios, for example, is host-based. If you want to get internal detail about the state of your micro-services (aka whitebox monitoring), Prometheus is a more appropriate tool.
The challenges of microservices and Kubernetes monitoring
There are unique challenges to monitoring a Kubernetes cluster that need to be solved in order to deploy a reliable monitoring / alerting / graphing architecture.
Monitoring containers: visibility
Containers are lightweight, mostly immutable black boxes, which can present monitoring challenges.
The Kubernetes API and the kube-state-metrics (which natively uses prometheus metrics) solve part of this problem by exposing Kubernetes internal data, such as the number of desired / running replicas in a deployment, unschedulable nodes, etc.
Prometheus is a good fit for microservices because you just need to expose a metrics port, and don't need to add too much complexity or run additional services. Often, the service itself is already presenting a HTTP interface, and the developer just needs to add an additional path like /metrics.
In some cases, the service is not prepared to serve Prometheus metrics and you can't modify the code to support it. In that case, you need to deploy a Prometheus exporter bundled with the service, often as a sidecar container of the same pod.
Dynamic monitoring: changing and volatile infrastructure
As we mentioned before, ephemeral entities that can start or stop reporting any time are a problem for classical, more static monitoring systems.
Prometheus has several autodiscover mechanisms to deal with this. The most relevant for this guide are:
Consul: A tool for service discovery and configuration. Consul is distributed, highly available, and extremely scalable.
Kubernetes: Kubernetes SD configurations allow retrieving scrape targets from Kubernetes' REST API, and always stay synchronized with the cluster state.
Prometheus Operator: To automatically generate monitoring target configurations based on familiar Kubernetes label queries. We will focus on this deployment option later on.
Monitoring new layers of infrastructure: Kubernetes components
Using Kubernetes concepts like the physical host or service port become less relevant. You need to organize monitoring around different groupings like microservice performance (with different pods scattered around multiple nodes), namespace, deployment versions, etc.
Using the label-based data model of Prometheus together with the PromQL, you can easily adapt to these new scopes.
Kubernetes monitoring with Prometheus: Architecture overview
We will get into more detail later on. This diagram covers the basic entities we want to deploy in our Kubernetes cluster:
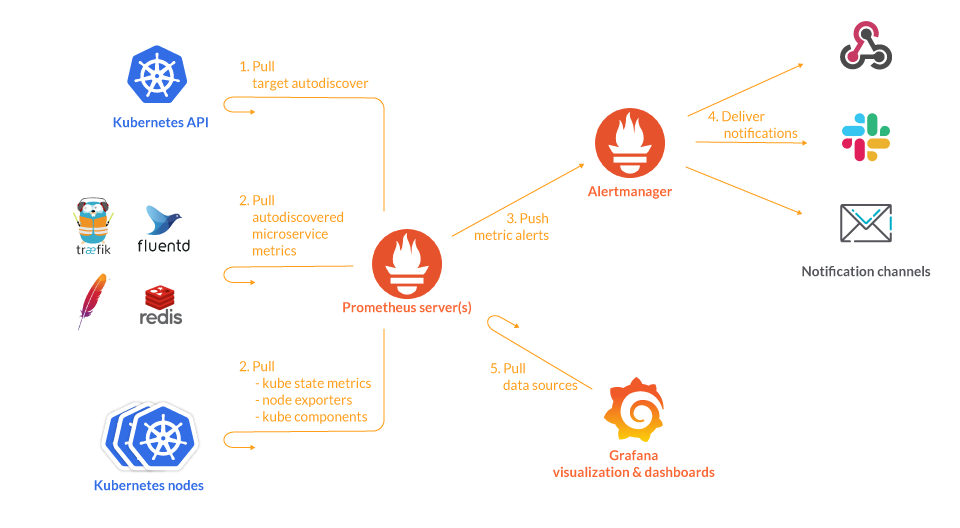
- The Prometheus servers need as much target auto discovery as possible. There are several options to achieve this:
- Prometheus Kubernetes SD (service discovery)
- The Prometheus operator and its Custom Resource Definitions
- Consul SD
- Azure SD for Azure VM
- GCE SD for GCP instances
- EC2 SD for AWS VM
- File SD
- Apart from application metrics, we want Prometheus to collect metrics related to the Kubernetes services, nodes, and orchestration status.
- Node exporter for the classical host-related metrics: cpu, mem, network, etc.
Kube-state-metricsfor orchestration and cluster level metrics: deployments, pod metrics, resource reservation, etc.- Kubernetes control plane metrics: kubelet, etcd, dns, scheduler, etc.
- Prometheus can configure rules to trigger alerts using PromQL.
alertmanagerwill be in charge of managing alert notification, grouping, inhibition, etc. - The AlertManager component configures the receivers and gateways to deliver alert notifications.
- Grafana can pull metrics from any number of Prometheus servers and display panels and Dashboards.
How to install Prometheus
There are different ways to install Prometheus in your host or in your Kubernetes cluster:
- As a single binary running on your hosts, which is fine for learning, testing, and developing purposes but is not appropriate for a containerized deployment.
- As a Docker container which has, in turn, several orchestration options: Raw Docker containers, Kubernetes Deployments / StatefulSets, the Helm Kubernetes package manager, Kubernetes operators, etc.
Let's start with a more manual approach to a more automated process:
Single → Docker container → Helm chart → Prometheus operator
You can directly download and run the Prometheus binary in your host:
prometheus-2.21.0.linux-amd64$ ./prometheus
./prometheus
level=info ts=2020-09-25T10:04:24.911Z caller=main.go:310 msg="No time or size retention was set so using the default time retention" duration=15d
[…]
level=info ts=2020-09-25T10:04:24.916Z caller=main.go:673 msg="Server is ready to receive web requests."
Which may be nice to get a first impression of the Prometheus web interface (port 9090 by default).
A better option is to deploy the Prometheus server inside a container:
docker run -p 9090:9090 -v /tmp/prometheus.yml:/etc/prometheus/prometheus.yml \
       prom/prometheus
Note that you can easily adapt this Docker container into a proper Kubernetes Deployment object that will mount the configuration from a ConfigMap, expose a service, deploy multiple replicas, etc. The easiest way to install Prometheus in Kubernetes is using Helm.
The Prometheus community is maintaining a Helm chart that makes it really easy to install and configure Prometheus and the different applications that form the ecosystem.
To install Prometheus in your Kubernetes cluster with helm just run the following commands:
Add the Prometheus charts repository to your helm configuration:
helm repo add prometheus-community https://prometheus-community.github.io/helm-charts
helm repo add stable https://kubernetes-charts.storage.googleapis.com/
helm repo update
Install Prometheus:
# Helm 3
helm install [RELEASE_NAME] prometheus-community/prometheus
# Helm 2
helm install --name [RELEASE_NAME] prometheus-community/prometheus
After a few seconds, you should see the Prometheus pods in your cluster.
NAME                                                      READY   STATUS    RESTARTS   AGE
prometheus-kube-state-metrics-66cc6888bd-x9llw   1/1     Running   0          93d
prometheus-node-exporter-h2qx5                   1/1     Running   0          10d
prometheus-node-exporter-k6jvh                   1/1     Running   0          10d
prometheus-node-exporter-thtsr                   1/1     Running   0          10d
prometheus-server-0                              2/2     Running   0          90m
Bonus point: Helm chart deploys node-exporter, kube-state-metrics, and alertmanager along with Prometheus, so you will be able to start monitoring nodes and the cluster state right away.
A more advanced and automated option is to use the Prometheus operator. You can think of it as a meta-deployment, a deployment that manages other deployments and configures and updates them according to high-level service specifications.
How to monitor a Kubernetes service with Prometheus
Prometheus metrics are exposed by services through HTTP(S), and there are several advantages of this approach compared to other similar monitoring solutions:
- You don't need to install a service agent, just expose a web port. Prometheus servers will regularly scrape (pull), so you don't need to worry about pushing metrics or configuring a remote endpoint either.
- Several microservices already use HTTP for their regular functionality, and you can reuse that internal web server and just add a folder like /metrics.
- The metrics format itself is human-readable and easy to grasp. If you are the maintainer of the microservice code, you can start publishing metrics without much complexity or learning required.
Some services are designed to expose Prometheus metrics from the ground up (the Kubernetes kubelet, Traefik web proxy, Istio microservice mesh, etc.). Other services are not natively integrated but can be easily adapted using an exporter. An exporter is a service that collects service stats and "translates" them to Prometheus metrics ready to be scraped. There are examples of both in this guide.
Let's start with the best case scenario: the microservice that you are deploying already offers a Prometheus endpoint.
Traefik is a reverse proxy designed to be tightly integrated with microservices and containers. A common use case for Traefik is as an Ingress controller or Entrypoint. This is the bridge between the Internet and the specific microservices inside your cluster.
You have several options to install Traefik and a Kubernetes-specific install guide. If you just want a simple Traefik deployment with Prometheus support up and running quickly, use the following commands:
helm repo add stable https://kubernetes-charts.storage.googleapis.com/
helm install traefik stable/traefik --set metrics.prometheus.enabled=true
Once the Traefik pods are running, you can display the service IP:
$ kubectl get svc
k get svc
NAME         TYPE            CLUSTER-IP       EXTERNAL-IP                                                               PORT(S)                     AGE
kubernetes  ClusterIP        100.64.0.1       <none>                                                                    443/TCP                     99d
traefik    LoadBalancer      100.65.9.227 xxx.eu-west-1.elb.amazonaws.com   443:32164/TCP,80:31829/TCP  72m
traefik-prometheus ClusterIP 100.66.30.208    <none>                                                                    9100/TCP                    72m
You can check that the Prometheus metrics are being exposed in the service traefik-prometheus by just using curl from a shell in any container:
$ curl 100.66.30.208:9100/metrics
# HELP go_gc_duration_seconds A summary of the GC invocation durations.
# TYPE go_gc_duration_seconds summary
go_gc_duration_seconds{quantile="0"} 2.4895e-05
go_gc_duration_seconds{quantile="0.25"} 4.4988e-05
...
Now, you need to add the new target to the prometheus.yml conf file. Check it with the command:
kubectl get cm prometheus-server -o yamlYou will notice that Prometheus automatically scrapes itself:
  - job_name: 'prometheus'
    # metrics_path defaults to '/metrics'
    # scheme defaults to 'http'.
    static_configs:
    - targets: ['localhost:9090']
Let's add another static endpoint.
Edit the file with the command:
kubectl edit cm prometheus-serverAnd add this new job:
  - job_name: 'traefik'
    static_configs:
    - targets: ['traefik-prometheus:9100]
If the service is in a different namespace, you need to use the FQDN (e.g., traefik-prometheus.[namespace].svc.cluster.local)
Of course, this is a bare-minimum configuration and the scrape config supports multiple parameters.
To name a few:
basic_authandbearer_token: Your endpoints may require authentication over HTTPS, using a classical login/password scheme or a bearer token in the request headers.kubernetes_sd_configsorconsul_sd_configs: Different endpoint autodiscovery methods.scrape_interval,scrape_limit,scrape_timeout: Different tradeoffs between precision, resilience, and system load.
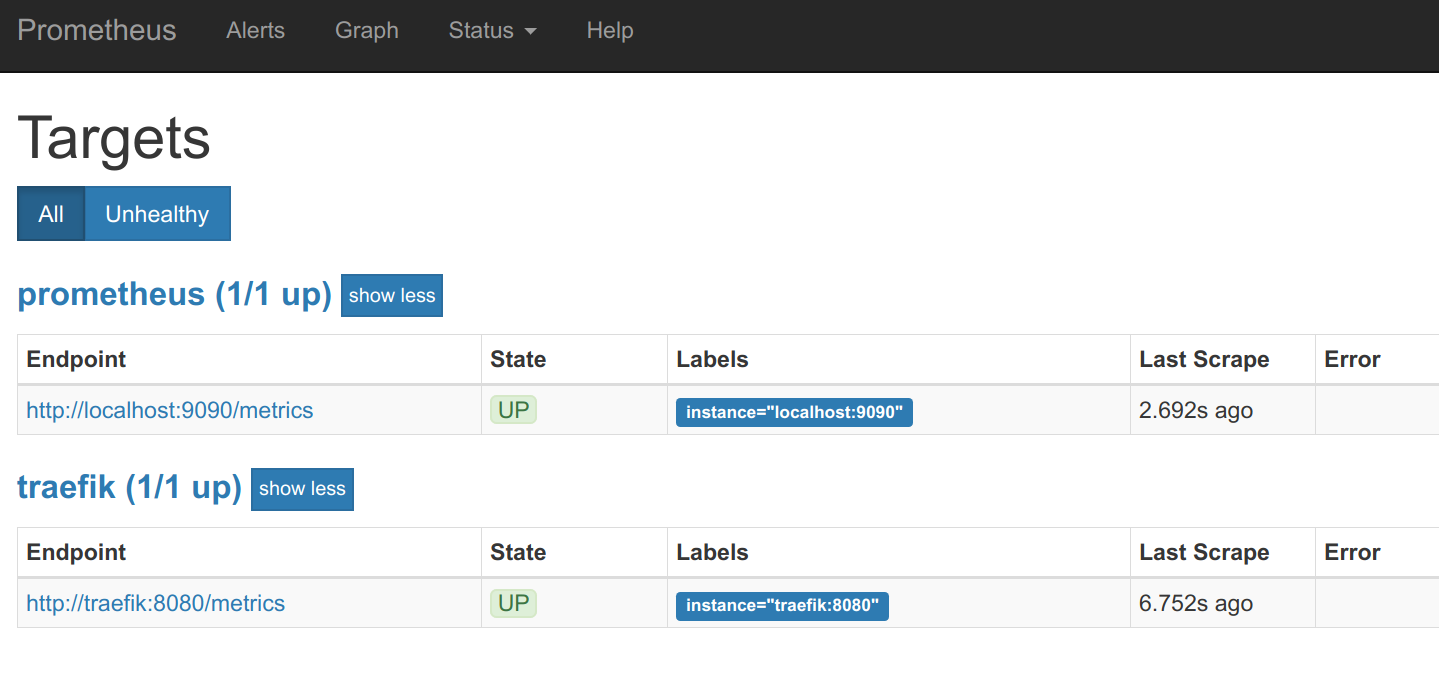
If you access the /targets URL in the Prometheus web interface, you should see the Traefik endpoint UP:
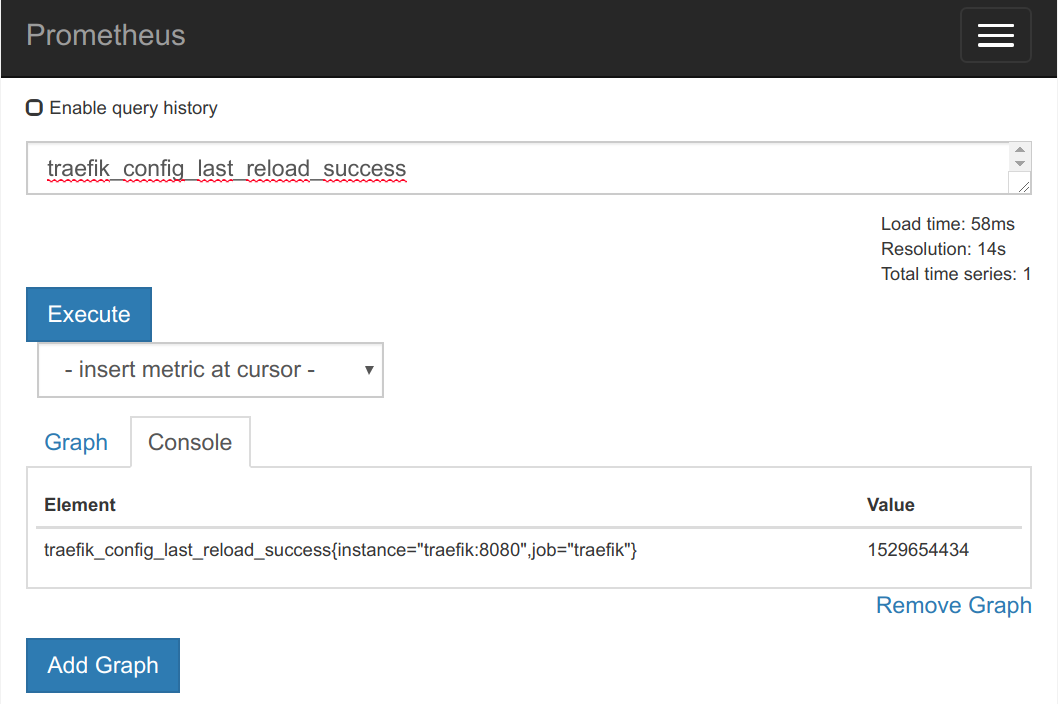
Using the main web interface, we can locate some traefik metrics (very few of them, because we don't have any Traefik frontends or backends configured for this example) and retrieve its values:
We already have a Prometheus on Kubernetes working example.
In addition to the use of static targets in the configuration, Prometheus implements a really interesting service discovery in Kubernetes, allowing us to add targets annotating pods or services with these metadata:
annotations:
  prometheus.io/port: 9216
  prometheus.io/scrape: true
You have to indicate Prometheus to scrape the pod or service and include information of the port exposing metrics.
How to monitor Kubernetes services with Prometheus exporters
Although some services and applications are already adopting the Prometheus metrics format and provide endpoints for this purpose, many popular server applications like Nginx or PostgreSQL are much older than the Prometheus metrics / OpenMetrics popularization. This complicates getting metrics from them into a single pane of glass, since they usually have their own metrics formats and exposition methods.
If you are trying to unify your metric pipeline across many microservices and hosts using Prometheus metrics, this may be a problem.
Prometheus exporters to the rescue
To work around this hurdle, the Prometheus community is creating and maintaining a vast collection of Prometheus exporters. An exporter is a "translator" or "adapter" program that is able to collect the server native metrics (or generate its own data observing the server behavior) and re-publish them using the Prometheus metrics format and HTTP protocol transports.
These exporter small binaries can be co-located in the same pod as a sidecar of the main server that is being monitored, or isolated in their own pod or even a different infrastructure.
The exporter exposes the service metrics converted into Prometheus metrics, so you just need to scrape the exporter.
Cutting through the Prometheus exporters noise with PromCat
There are hundreds of Prometheus exporters available on the internet, and each exporter is as different as the application that they generate metrics for. In most of the cases, the exporter will need an authentication method to access the application and generate metrics. These authentications come in a wide range of forms, from plain text url connection strings to certificates or dedicated users with special permissions inside of the application. In other escenarios, it may need to mount a shared volume with the application to parse logs or files, for example. Also, the application sometimes needs some tuning or special configuration to allow the exporter to get the data and generate metrics.
Sometimes, there are more than one exporter for the same application. This can be due to different offered features, forked discontinued projects, or even that different versions of the application work with different exporters. It's important to correctly identify the application that you want to monitor, the metrics that you need, and the proper exporter that can give you the best approach to your monitoring solution.
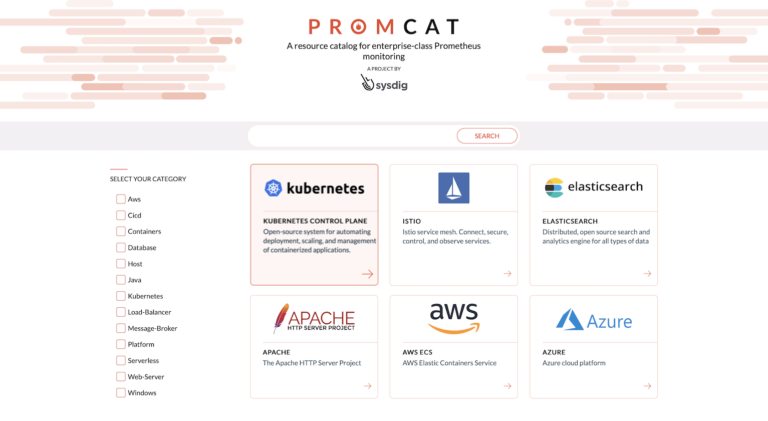
Sysdig has created a site called PromCat.io to reduce the amount of maintenance needed to find, validate, and configure these exporters. At PromCat.io, we curate the best exporters, provide detailed configuration examples, and provide support for our customers who want to use them. Check the up-to-date list of available Prometheus exporters and integrations.
Hands on: Monitoring redis as a Kubernetes service with Prometheus
We'll see how to use a Prometheus exporter to monitor a Redis server that is running in your Kubernetes cluster.
You can deploy a Prometheus sidecar container along with the pod containing the Redis server by using our example deployment:
# Clone the repo if you don't have it already
git clone git@github.com:mateobur/prometheus-monitoring-guide.git
kubectl create -f prometheus-monitoring-guide/redis_prometheus_exporter.yaml
If you display the Redis pod, you will notice it has two containers inside:
# kubectl get pod redis-546f6c4c9c-lmf6z
NAME                     READY     STATUS    RESTARTS   AGE
redis-546f6c4c9c-lmf6z   2/2       Running   0          2m
Now, you just need to update the Prometheus configuration and reload like we did in the last section:
  - job_name: 'redis'
    static_configs:
      - targets: ['redis:9121']
To obtain all of the Redis service metrics:
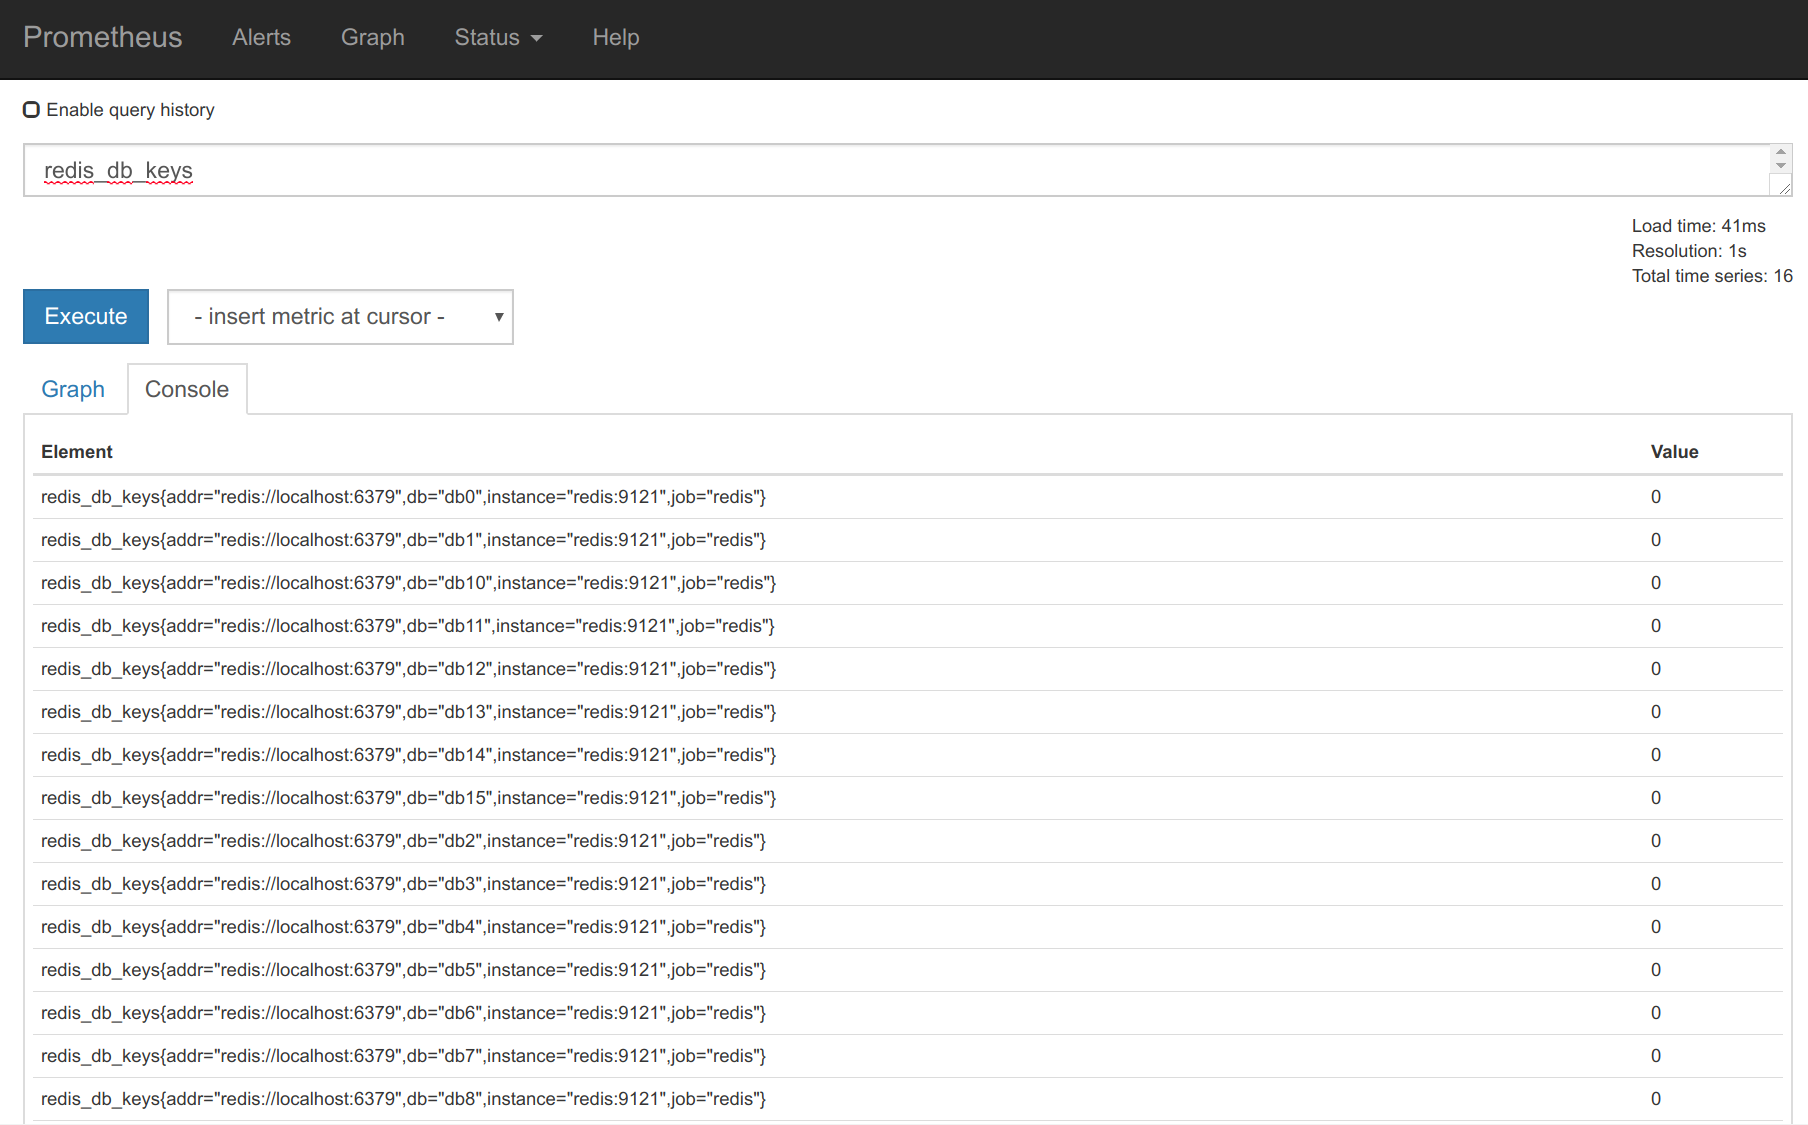
Monitoring Kubernetes cluster with Prometheus and kube-state-metrics
In addition to monitoring the services deployed in the cluster, you also want to monitor the Kubernetes cluster itself. Three aspects of cluster monitoring to consider are:
- The Kubernetes hosts (nodes): Classic sysadmin metrics such as cpu, load, disk, memory, etc.
- Orchestration level metrics: Deployment state, resource requests, scheduling and api server latency, etc.
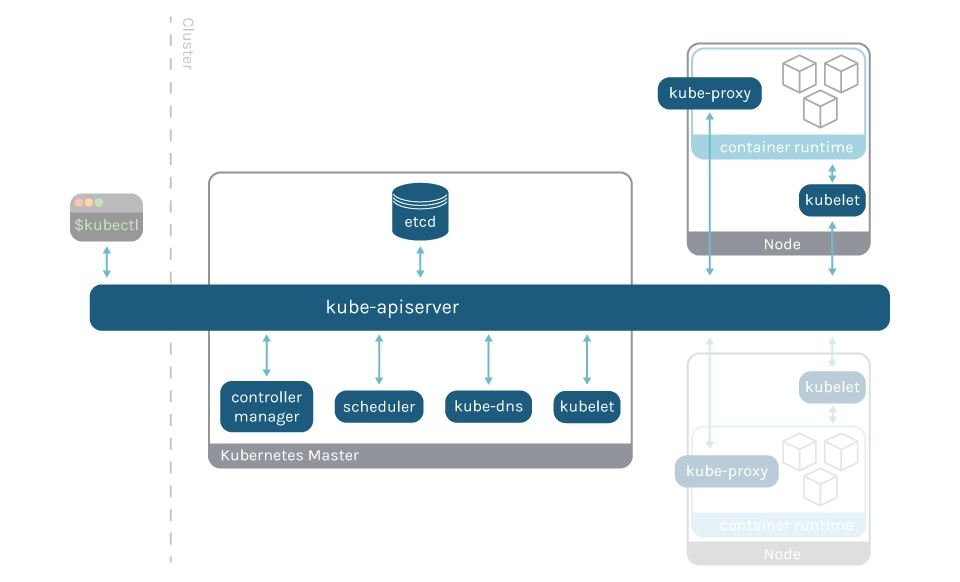
- Internal kube-system components: Detailed service metrics for the scheduler, controller manager, dns service, etc.
The Kubernetes internal monitoring architecture has recently experienced some changes that we will try to summarize here. For more information, you can read its design proposal.
Kubernetes monitoring components on a Prometheus stack
cAdvisor is an open source container resource usage and performance analysis agent. It is purpose-built for containers and supports Docker containers natively. In Kubernetes, cAdvisor runs as part of the Kubelet binary. So, any aggregator retrieving "node local" and Docker metrics will directly scrape the Kubelet Prometheus endpoints.
Kube-state-metrics is a simple service that listens to the Kubernetes API server and generates metrics about the state of the objects such as deployments, nodes, and pods. It is important to note that kube-state-metrics is just a metrics endpoint. Other entities need to scrape it and provide long term storage (e.g., the Prometheus server).
Metrics-server is a cluster-wide aggregator of resource usage data. The metrics server will only present the last data points and it's not in charge of long term storage.
Thus:
- Kube-state metrics are focused on orchestration metadata: deployment, pod, replica status, etc.
- Metrics-server is focused on implementing the resource metrics API: CPU, file descriptors, memory, request latencies, etc.
Monitoring the Kubernetes nodes with Prometheus
The Kubernetes nodes or hosts need to be monitored.
We have plenty of tools to monitor a Linux host, but they are not designed to be easily run on Kubernetes.
Thus, we'll use the Prometheus node-exporter that was created with containers in mind:
- It's hosted by the Prometheus project itself.
- It's the one that will be automatically deployed in our Prometheus operator examples.
- It can be deployed as a DaemonSet and will automatically scale if you add or remove nodes from your cluster.
The easiest way to install it is by using Helm:
# add repo only needed if it wasn't done before
helm repo add prometheus-community https://prometheus-community.github.io/helm-charts
# Helm 3
helm install [RELEASE_NAME] prometheus-community/prometheus-node-exporter
# Helm 2
helm install --name [RELEASE_NAME] prometheus-community/prometheus-node-exporter
Once the chart is installed and running, you can display the service that you need to scrape:
TYPE CLUSTER-IP EXTERNAL-IP PORT(S) AGE
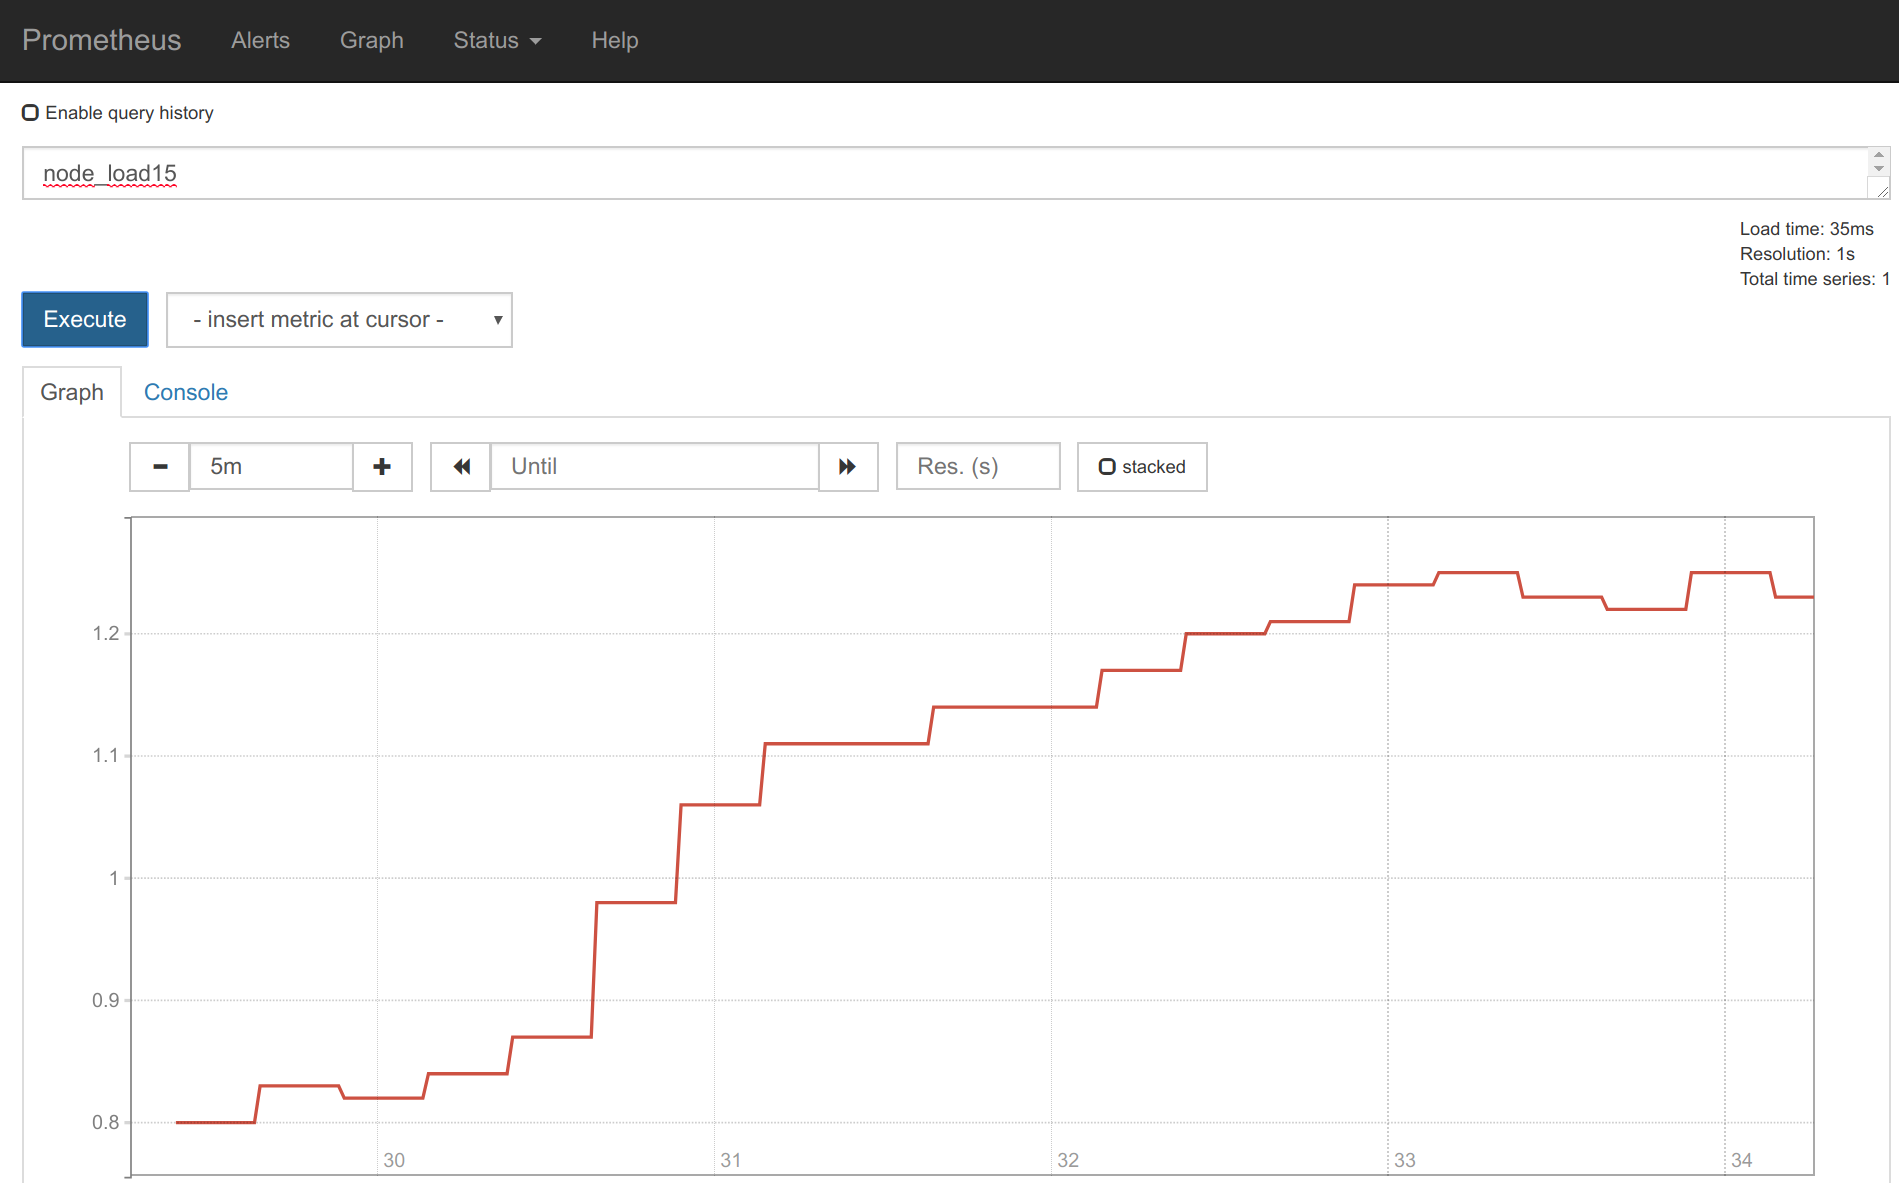
node-exporter-prometheus-node-exporter ClusterIP 10.101.57.207 <none> 9100/TCP 17mOnce you add the scrape config like we did in the previous sections (If you installed Prometheus with Helm, there is no need to configuring anything as it comes out-of-the-box), you can start collecting and displaying the node metrics.
Monitoring kube-state-metrics with Prometheus
Deploying and monitoring the kube-state-metrics just requires a few steps.
Again, you can deploy it directly using the commands below, or with a Helm chart. If you installed Prometheus with Helm, kube-state-metrics will already be installed and you can skip this step.
git clone https://github.com/kubernetes/kube-state-metrics.git
kubectl apply -f examples/standard
...
# kubectl get svc -n kube-system
NAME                 TYPE        CLUSTER-IP       EXTERNAL-IP   PORT(S)             AGE
kube-dns             ClusterIP   10.96.0.10       <none>        53/UDP,53/TCP       13h
kube-state-metrics   ClusterIP   10.102.12.190    <none>        8080/TCP,8081/TCP   1h
You just need to scrape that service (port 8080) in the Prometheus config. Remember to use the FQDN this time:
  - job_name: 'kube-state-metrics'
    static_configs:
    - targets: ['kube-state-metrics.kube-system.svc.cluster.local:8080']
Monitoring Kubernetes control plane with Prometheus
The control plane is the brain and heart of Kubernetes. All of its components are important to the proper working and efficiency of the cluster. Monitoring the Kubernetes control plane is just as important as monitoring the status of the nodes or the applications running inside. It may be even more important, because an issue with the control plane will affect all of the applications and cause potential outages.
There are several Kubernetes components that can expose internal performance metrics using Prometheus. Check these other articles for detailed instructions, as well as recommended metrics and alerts:
- How to monitor Kubernetes apiserver
- How to monitor kubelet
- How to monitor etcd
- How to monitor controller-manager
- How to monitor kube-proxy
- How to monitor kube-dns
Monitoring them is quite similar to monitoring any other Prometheus endpoint with two particularities:
- The network interfaces these processes listen to, and the http scheme and security (HTTP, HTTPS, RBAC), depend on your deployment method and configuration templates. Frequently, these services are only listening at localhost in the hosting node, making them difficult to reach from the Prometheus pods.
- These components may not have a Kubernetes service pointing to the pods, but you can always create it.
Depending on your deployment method and configuration, the Kubernetes services may be listening on the local host only.
To make the next example easier and focused, we'll use Minikube. Minikube lets you spawn a local single-node Kubernetes virtual machine in minutes.
This will work as well on your hosted cluster, GKE, AWS, etc., but you will need to reach the service port by either modifying the configuration and restarting the services, or providing additional network routes.
Installing Minikube only requires a few commands. First, install the binary, then create a cluster that exposes the kube-scheduler service on all interfaces:
minikube start --memory=4096 --bootstrapper=kubeadm --extra-config=kubelet.authentication-token-webhook=true --extra-config=kubelet.authorization-mode=Webhook --extra-config=scheduler.address=0.0.0.0 --extra-config=controller-manager.address=0.0.0.0Then, we can create a service that will point to the kube-scheduler pod:
kind: Service
apiVersion: v1
metadata:
  name: scheduler-service
  namespace: kube-system
spec:
  selector:
    component: kube-scheduler
  ports:
  - name: scheduler
    protocol: TCP
    port: 10251
    targetPort: 10251
Now you will be able to scrape the endpoint: scheduler-service.kube-system.svc.cluster.local:10251
Prometheus at scale
Monitoring with Prometheus is easy at first. You can have metrics and alerts in several services in no time. The problems start when you have to manage several clusters with hundreds of microservices running inside, and different development teams deploying at the same time.
Global visibility, high availability, access control (RBAC), and security are requirements that need to add additional components to Prometheus, making the monitoring stack much more complex.
There are unique challenges using Prometheus at scale, and there are a good number of open source tools like Cortex and Thanos that are closing the gap and adding new features.
There is also an ecosystem of vendors, like Sysdig, offering enterprise solutions built around Prometheus.
What's next?
We have covered basic prometheus installation and configuration. But now it's time to start building a full monitoring stack, with visualization and alerts.
We suggest you continue learning about the additional components that are typically deployed together with the Prometheus service. We will start using the PromQL language to aggregate metrics, fire alerts, and generate visualization dashboards.
Further reads in our blog will help you set up the Prometheus operator with Custom ResourceDefinitions (to automate the Kubernetes deployment for Prometheus), and prepare for the challenges using Prometheus at scale.
You may also find our Kubernetes monitoring guide interesting, which compiles all of this knowledge in PDF format.
Want to put all of this PromQL, and the PromCat integrations, to the test? Sysdig Monitor is fully compatible with Prometheus and only takes a few minutes to set up. Start your free trial today!