What Is the Kubernetes Dashboard?
SHARE:

Content
The Kubernetes Dashboard is a web-based UI that allows administrators to perform basic operating tasks and review cluster events. You can use the dashboard as a quick tool for viewing and monitoring the cluster, submitting manifests, inspecting logs, and getting system information.
In this extended article, we will take a deep dive into the Kubernetes dashboard. We will explain how to install it, how to access it from inside or outside the cluster, and how to administer it remotely.
To follow along, you will need to have access to a Kubernetes cluster. You can use Kind to create local Kubernetes clusters for testing purposes. (Just follow their instructions to install and deploy your sample cluster.) Alternatively, you can use a managed service like Digital Ocean or GCloud to simulate a real-world example.
Let’s get started.
Kubernetes Dashboard Basics
The Kubernetes dashboard, which is maintained by the official Kubernetes team, is a general-purpose web application that you can deploy on your cluster. It consists of two main components: a front-end and a back-end.
The dashboard provides a web view of your cluster and can be used for simple administrative tasks. You can deploy it by applying the official manifest:
$ kubectl apply -f https://raw.githubusercontent.com/kubernetes/dashboard/v2.5.0/aio/deploy/recommended.yaml


namespace/kubernetes-dashboard created
serviceaccount/kubernetes-dashboard created
service/kubernetes-dashboard created
secret/kubernetes-dashboard-certs created
secret/kubernetes-dashboard-csrf created
secret/kubernetes-dashboard-key-holder created
configmap/kubernetes-dashboard-settings created
role.rbac.authorization.k8s.io/kubernetes-dashboard created
clusterrole.rbac.authorization.k8s.io/kubernetes-dashboard created
rolebinding.rbac.authorization.k8s.io/kubernetes-dashboard created
clusterrolebinding.rbac.authorization.k8s.io/kubernetes-dashboard created
deployment.apps/kubernetes-dashboard created
service/dashboard-metrics-scraper created
deployment.apps/dashboard-metrics-scraper createdCode language: JavaScript (javascript)
There is also a Kubernetes dashboard Helm chart if you prefer to use Helm.
Once installed, it will create several resources, secrets, and service accounts under the kubernetes-dashboard namespace. You can inspect all of the resources that it created using the following command:
$ kubectl get all -n kubernetes-dashboard

NAME                                            READY   STATUS    RESTARTS   AGE
pod/dashboard-metrics-scraper-c45b7869d-9kbcs   1/1     Running   0          4m5s
pod/kubernetes-dashboard-764b4dd7-4qhx5         1/1     Running   0          4m5s
…Code language: JavaScript (javascript)
Accessing the Kubernetes Dashboard
Now, we’ll show you how to access the cluster locally. The dashboard itself is located in:
This follows the standard convention for accessing services via proxy in Kubernetes.
To access this URL, you need to run the kubectl tool in a mode that allows it to act as a reverse proxy. This is an intentional design feature of Kubernetes that enables you to securely access the cluster’s internal services from your local machine:
$ kubectl proxy &Only HTTP connections are allowed when connecting to the service via proxy. You cannot sign in from domains other than localhost and 127.0.0.1.
Now, navigate to the URL. You will be prompted to choose an authentication method for logging in. You can use either a secret token or the kubeconfig:
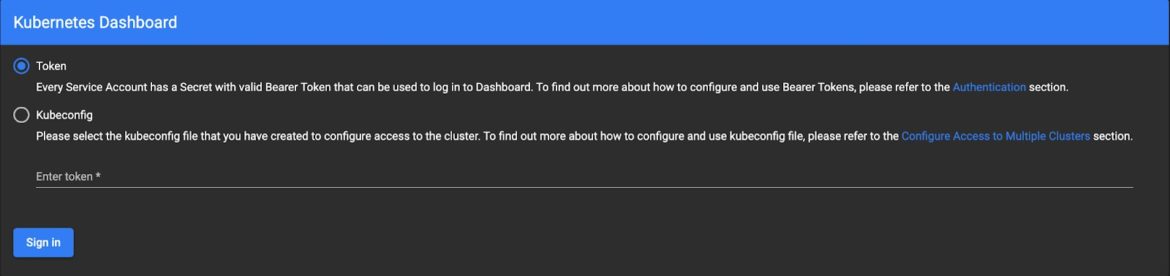
Fig 1. Kubernetes Dashboard Login
Next, we will explain how authentication and tokens work.
Kubernetes Dashboard Authentication and Tokens
Kubernetes allows two types of users to gain access to resources: normal users and service accounts managed by Kubernetes.
Normal users are predefined users that have administrative access credentials. They cannot be added via the API, so this category is reserved for users who are managed by an outside, independent service. For example, LDAP can be used to provision normal users.
Service accounts, on the other hand, are users that Kubernetes manages and controls. To verify requests, you can use signed tokens that are provisioned when you create a new service account.
You can create a new service account by providing a name and (optionally) a private key. Kubernetes will sign and store a secret for that service account which you can then use to log in to the dashboard. We’ll show you how to do that next.
First, create an admin user service account, and then query the ServiceAccount token value:
$ cat sa-admin-user.yml
apiVersion: v1
kind: ServiceAccount
metadata:
  name: admin-user
  namespace: kubernetes-dashboard
---
apiVersion: rbac.authorization.k8s.io/v1
kind: ClusterRoleBinding
metadata:
  name: admin-user
roleRef:
  apiGroup: rbac.authorization.k8s.io
  kind: ClusterRole
  name: cluster-admin
subjects:
- kind: ServiceAccount
  name: admin-user
  namespace: kubernetes-dashboard

$ kubectl apply -f sa-admin-user.yml
serviceaccount/admin-user created
clusterrolebinding.rbac.authorization.k8s.io/admin-user created

$ kubectl -n kubernetes-dashboard get secret $(kubectl -n kubernetes-dashboard get sa/kubernetes-dashboard -o jsonpath="{.secrets[0].name}") -o go-template="{{.data.token | base64decode}}"Code language: JavaScript (javascript)
Copy and paste the token to gain access to the dashboard:
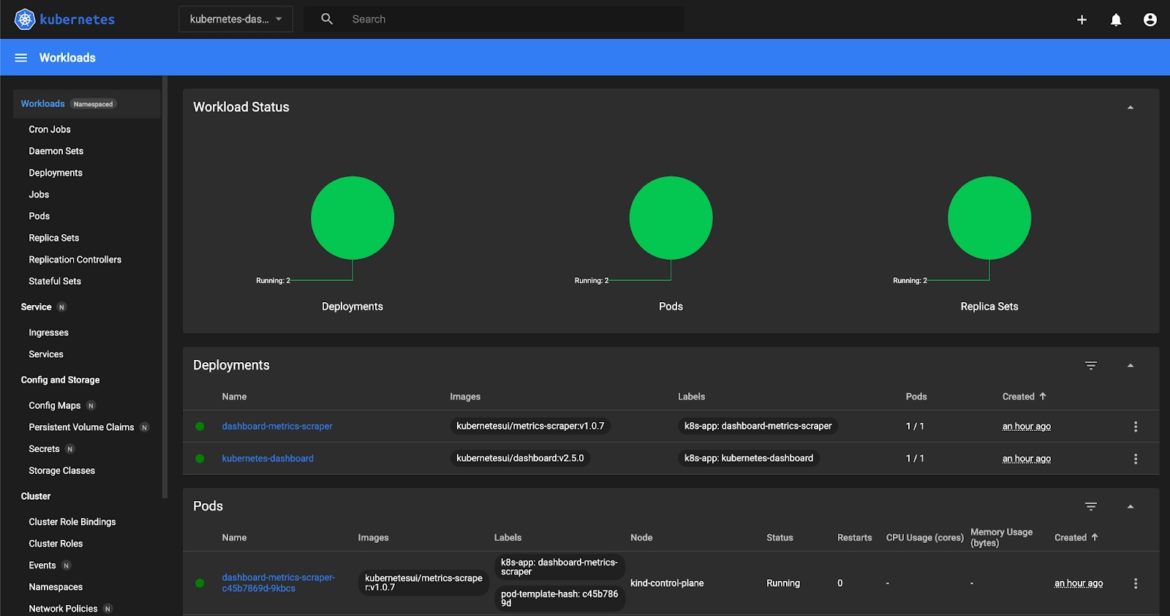
Fig 2. The Kubernetes Dashboard
Feel free to navigate around the dashboard to learn about its features.
Alternative Access to the Dashboard
An alternative way to access the dashboard is via port forwarding. This will only allow HTTPS connections by default. The dashboard manifest uses a service that exposes port 8443, so we need to use that mapping:
$ kubectl port-forward -n kubernetes-dashboard service/kubernetes-dashboard 8080:443

Forwarding from 127.0.0.1:8080 -> 8443
Forwarding from [::1]:8080 -> 8443Code language: JavaScript (javascript)
Note that Chrome won’t allow you to access the https://localhost:8080/ due to untrusted certificates in the chain. Therefore, unless you’ve imported the dashboard’s default certificates, you will be blocked. Firefox will allow you to proceed after you accept all of the warnings.
Skipping Authentication
You can also enable skip-login by redeploying the kubernetes-dashboard application using certain arguments. You can do that in the dashboard itself. Locate the kubernetes-dashboard deployment under this namespace and edit the resource definition as shown below:
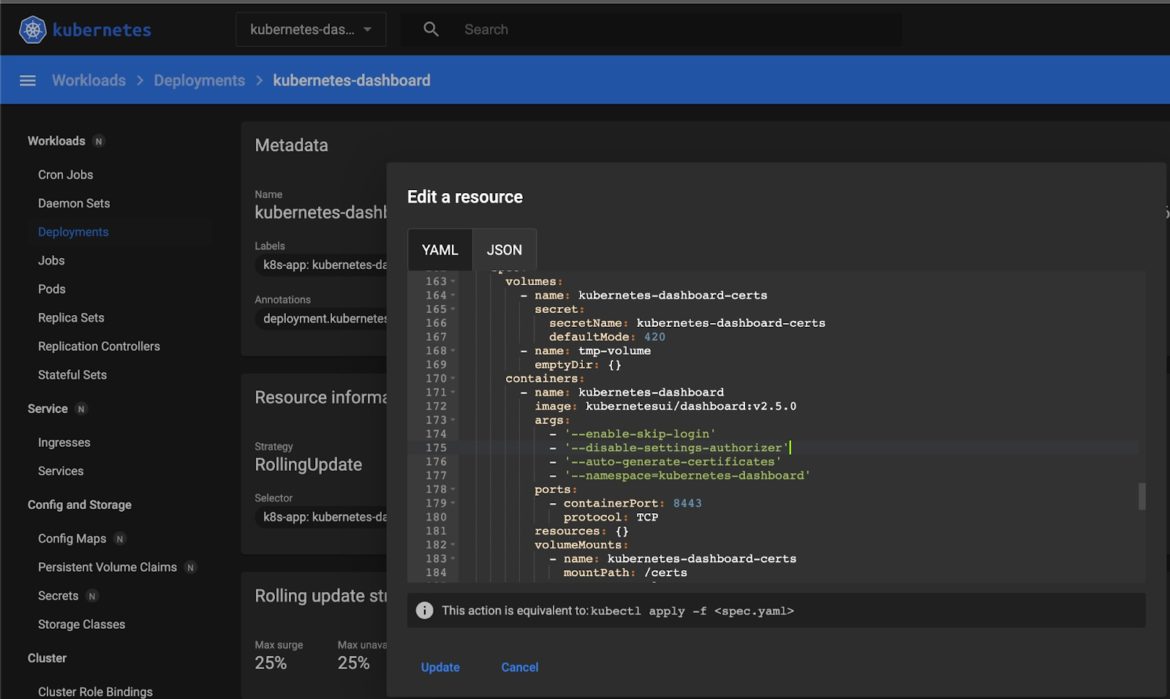
Fig 3. Enabling Skip-Login
After you redeploy it, log out of the dashboard and try to log in again. It should give you the option to skip authentication and go straight to the dashboard. If you log in this way, however, you will only have default access credentials, which should be very restrictive by default.
Note: In some earlier versions of Kubernetes (< 1.10.1), this method had a security vulnerability (CVE-2018-18264) that allowed for secrets to be read within a cluster after skipping authentication. This was patched in later versions, but it’s still a good practice to adopt a monitoring privilege escalation solution so that similar events can be mitigated early.
Checking Logs in a Kubernetes Dashboard
When you explore the dashboard page, you will see that you have several options for monitoring the logs. You can select relevant resources (like pods, jobs, and stateful sets) by clicking on the corresponding icons in the top sidebar:
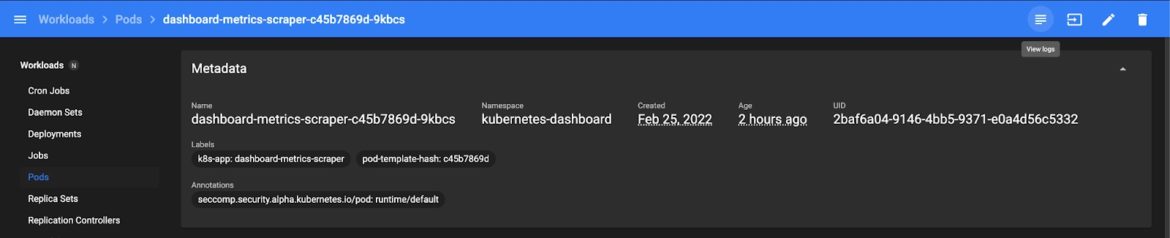
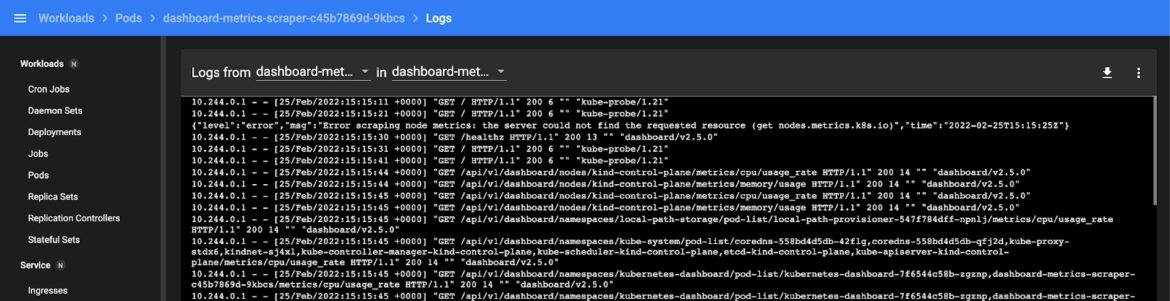
Fig 4. Checking Logs
You can also review the events under the cluster heading:
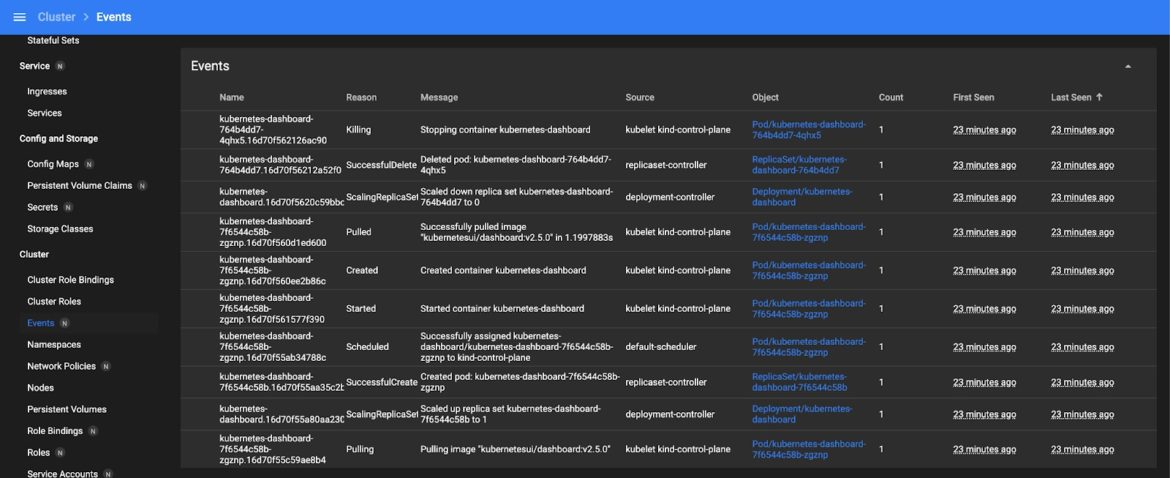
Fig 5. Reviewing Events
Note that the kubectl tool can return both types of information as well, but the UI displays things in a more readable format.
Exposing the Kubernetes Dashboard to the Public
In our current example, we can only access the dashboard locally. There are several ways to allow access to the dashboard from an external IP.
For example, if you expose the Kubernetes node of the kube API to the public, you can access the dashboard using the following url:
https://<master-ip>:<apiserver-port>/api/v1/namespaces/kubernetes-dashboard/services/https:kubernetes-dashboard:/proxy/Code language: HTML, XML (xml)You can also expose the dashboard using a service definition or an ingress controller.
You can patch an existing service for the dashboard to expose the nodeport:
$ kubectl --namespace kubernetes-dashboard patch svc kubernetes-dashboard -p '{"spec": {"type": "NodePort"}}'

$ kubectl get svc -n kubernetes-dashboard kubernetes-dashboard -o jsonpath="{.spec.ports[0].nodePort}"
32418%
Then, you can use https://NODE_HOST:NODE_PORT to access the dashboard. However, you normally shouldn’t expose the dashboard to the public; instead, you should access it via proxy to keep it secure.
Conclusion
The Kubernetes dashboard is an excellent tool for quickly monitoring the state of your cluster and applying manifests. It is relatively simple to deploy and access, and you can start managing small cluster deployments like a pro within minutes.